TSLA nice douple topTSLA shows this morning a nice double top pattern which indicates a down step.
Overall is TSLA currently not in shape to break out and is a short in short term.
Tslashort

TSLA 12% Additional Correction TheoryYesterday, Goldman Sachs analyst Mark Delaney joined Barclays and Morgan Stanley in downgrading the rating of TSLA from Buy to Neutral/Hold, followed by a decrease of just over 6% in the EV maker's share price. The Bloomberg analyst recommendation consensus graph, where sell = 1 & buy = 5, has declined approx. 0.2 points to 3.45 in the past week. Wall Street Journal quotes an average price target of $207.
So why are analysts lowering their price targets?
Fundamentals:
TSLA closed at $256.60 on Friday, representing more than a 130% yearly increase. In the 36 days before the local high on June 21st, the stock gained 69%. This was mainly due to its strong positioning within the AI market. Tesla vehicles collect a massive amount of data, and feed this data through a neural network, which is a deep learning (type of machine learning) algorithm that can process large volumes of data and improve its own accuracy over time. As new developments surface in the AI and ML space, TSLA will be uniquely positioned to take advantage of these developments to create tangible value. For example, their self-navigation and self-driving features in their cars heavily rely on algorithms and voluminous data in which AI and ML algorithms are foundational.
However, in early June TSLA was valued at a forward Price/Earnings ratio of 61, compared with Wall Street AI darling NVDA at 42 after they announced an earnings and revenue beat of 18% and 10%, respectively. TSLA was valued higher than the "only arms dealer" in the AI war, the chipmaker that most generative models are built on. Many believe the AI prospects for Tesla have already been priced into its shares, meaning any further extension are more likely a reflection of Keynes "Castles in the Air" theory of market psychology, or retail participants entering the bull market too close to expiration.
Tesla has a growing demand problem (or perhaps a lack thereof). In Q1 2022, the EV maker sold approx. 5,000 more vehicles than it produced. In Q1 2023, it built 18,000 more than it could sell. This could be added to the 56,000 unsold EVs reported at the end of 2022. 422,875 deliveries in Q1 of this year is an increase of about 36% YoY, but price cuts eating a portion of their margins are not producing the desired affect on demand. A model Y is ~ $11,000 cheaper today than at the start of the year.
DCF Valuation puts the company $73.7 USD, overvalued by 75%. Relative valuation against competitors such as Toyota, Porsche, BYD co., Mercedez-Benz, values Tesla at $47.41, with 80% downside. The Price to Free Cash Flow to Equity ratio (P/FCFE) rests at 136, compared with a historical average of 41 and an industry average of 1. The P/E is also above its historical and industry averages of 45 and 9, respectively.
Together, these fundamentals paint the picture of a company ripe for a correction of at least 10% due to faltering internal economics and the tendency of the current market to overvalue AI positioned stocks.
Macroeconomics:
Fed Chair Jerome Powell told the Senate Banking Committee last Thursday he expects one or two more rate hikes in the following 6 months to maintain the goal of 2% inflation (currently 4.05%). The yield curve is inverted, with 10y interest rates at 3.72 and 3m at 5.5, which has indicated recessions in the past. Total employment grew by a strong 339,000 jobs in May over diverse industries, but combined with the hawkish Fed, decreased government spending due to debt ceiling deal, and bearish trends in consumer spending and income, it is likely real GDP growth will slow to 1% in 2023. Tech-heavy Nasdaq closed on Thursday with a 40% yearly gain, while the broad S&P 500 logged a modest 16%. In light of the macroeconomic circumstances, TSLA's 130% gain is largely disproportional.
Technicals
Regarding chart patterns, TSLA has formed a clear head and shoulders pattern on the daily chart with a break in the neckline at about $248. As support and resistance goes, breaking the crucial level of $250 and closing below, as occurred on Monday, is a bearish signal.
As volume analysis goes, the prior two days have seen increasing sell orders and Friday's close saw the first red volume bar on the weekly since early May. A fixed range volume profile of 2023 shows an upper value area of $211, in confluence with the 0.382 Fibonacci retracement level. The point of control is at $198, in the range of confluence with the 200 & 100 EMAs and the .5 retracement level representing support / supply zone. These all represent areas price is likely to draw towards in accordance with mean reversion and liquidity analysis.
The MACD histogram flipped bearish and the slow and fast lines crossed over, also a bearish indicator, and the daily RSI crossed below 70 on Friday.
Shifting to intraday (1h) timeframe, the volume supported linear regression trend is strong bearish at -20, the Laguerre RSI is printing a decreasing trend continuation. The short term 3 period hourly non-repainting Nadaraya-Watson Rational Kernal Regression line is bearish and is acting as support for any bearish entry, while the envelope shows a lower bound estimate of $218 and the longer period 50 candle regression line on the daily is 20 points lower than price action, leaving plenty of room for a correction. A combination of 30 technical indicators used as inputs in a neural network algorithm show bearish trend continuation. The Lorentzian Distance Classification Machine Learning KNN algorithm, which compensates for the warping of price-time around news events, is indicating a strong bearish trend. The stochastic momentum index saw a bearish flip on Thursday and the money flow index of the stochastic momentum index is already in a strong bearish trend.
For fans of Tom DeMark, the TD Sequential / Countdown strategy saw a bearish signal printed on June 16th as the 13th day to close higher than 2 candles before (countdown), after the 9th candle in a row closed higher than 4 candles previous (sequential). This is an anti-momentum indicator used to predict explosive bearish corrections as a result of an overextended bull market.
Conclusion
It is likely based on the combination of fundamentals, technicals, and macroeconomic factors that TSLA will experience an additional correction of at least 12%, in addition to the 13% decrease it has experienced from the local high, for a total minimum 25% correction from the bull rally. I will be opening September puts with a stop loss above the recent swing high, and a profit target at the daily VPOC 0.382 retracement level (approx. $210) for a 2:1 RRR. I will adjust SL to B/E at 1:1 RRR, and dynamically adjust profit target if the neural network and Lorentzian classification both indicate a bullish reversal.
Sources
www.conference-board.org
www.alphaspread.com
www.bloomberg.com
www.bloomberg.com
www.bloomberg.com
ir.tesla.com
!! IMPORTANT DISCLAIMER !!
I am not a licensed financial advisor, and the trading ideas I provide do not constitute investment advice. Please exercise caution and consult with a qualified professional before making any investment decisions. Trading in financial markets involves substantial risks, and you should carefully consider your financial situation and risk tolerance before engaging in any trading activities.
Please note that any information or suggestions I offer are purely for educational and informational purposes. The financial markets are volatile and unpredictable, and past performance is not indicative of future results. It is essential to conduct thorough research, analyze market conditions, and seek guidance from licensed professionals who can provide personalized advice tailored to your specific circumstances.
I strongly recommend that you consult with a licensed financial advisor, accountant, or legal professional regarding your investment goals, strategies, and potential risks. They can provide expert guidance based on your individual financial situation, objectives, and risk tolerance.
Remember, you are solely responsible for your investment decisions, and any losses incurred are at your own risk. I disclaim any liability or responsibility for any direct or indirect damages or losses arising from your reliance on the information provided.
Always stay informed, exercise sound judgment, and consider multiple sources of information before making any financial decisions.

Concern about Tesla's recent Morgan Stanley downgrade I am writing to you today with a sense of concern about Tesla's recent Morgan Stanley downgrade ahead of their Q2 earnings report.
As you may have heard, Tesla has fallen from the downgrade, and this news is causing some uncertainty in the market. While we know that Tesla has been a popular stock for many traders, it's important to remember that the market can be unpredictable, and we must always be prepared for any changes.
With this in mind, I would like to encourage you to take profit from TSLA. We must be cautious as we approach the Q2 earnings report and consider taking some profits off the table. This will help protect your investments and ensure you are not caught off guard by any unexpected market movements.
In conclusion, I urge you to consider your options carefully and take action to protect your investments. While we cannot predict the future, we can take steps to prepare ourselves for any potential changes in the market.
thestreet.com/investing/stocks/tesla-stock-slides-after-morgan-stanley-downgrade-into-q2-earnings

TSLA Short: Wave C completion with Bearish Engulfing CandleAs can be seen in the chart, we noticed 3 items that could potentially spell the end of the up move for Tesla:
1. Bearish Engulfing Candle with high volume
2. RSI divergence with price (with RSI being too high in overbought area)
3. Elliott Wave C completion (potentially)
What this means is that the first target we will see is $220 and the ultimate target is a fall below $100.
Good luck!

TSLA: IS THIS A HEAD AND SHOULDERS?The absolute rip out of TSLA has been a good one. As they say, "what goes up must come down" though too.
If we are in need of a major pullback after this rip up, are we forming a head and shoulder pattern of
sorts? Hard to say but given how violent the move has been, that often is met with an equal and opposite
move and that puts the chart in a precarious position. If the pullback is not too extreme and we form a new
base around $200, then we could be looking for new All Time Highs, on the next move up. I feel that this
would most likely be the case because there is a lot of fundamental news to back up further growth in
TSLA stock. The federal tax credits are big windfall for TSLA and was much needed. Is it enough?
I think the TSLA bull case will require the mastery of hands free driving technology that has been
promised since the beginning and their robotic products to retail and have a positive public reception
of the technology.

TSLA: Can it get and stay above $221TSLA is sitting at very precarious area of price right now. This week should most likely give us the information we need to know
what the next few months will look like, if it can get above about $221 and stay there, the measured move bull flag pattern
should get us to somewhere between ~$294 to ~$313 and that would make sense in the macro formation of a head and shoulders
for TSLA because there are definitely some head winds for the the stock now that other car companies are finally catching up
with the technology and taking market share from TSLA. If the price cannot get above ~$221 and stay there, then we have a
measured move that would put us somewhere between ~$60 and ~$80. There is no way to know what will play out in this market,
although I still lean somewhat bearish due to the overall economic conditions worldwide. It just seems to me that we are still
due for a real "acknowledged" recession at some point. Once we get that I think we will then see the bull market of the
is century but I have a hard time believing we are there yet. I will be keeping my eyes on TSLA specifically, in order to
give me an idea of things going forward. It seems to be a good gauge for market sentiment.

TSLA Short - 919 fib reached againI sold half of my TSLA bag here and targeting 50% retracement again.

TSLA: At Critical Level That has Been Both Resistance & SupportTesla is at a critical level that has acted as both resistance and support in the past. At the moment it is straddling this price and it
has not made up its mind which it will be. Until it gets above its current level and tests it as clear support, I will be leaning bearish.
It does look like it could break out and flip the script though. It is definitely trying to do so. Not sure if the bulls have it in them though.
I will keep up on this chart and update as things move forward. I am very interested in going long on TSLA if it can up above this level.
Once it does that we can start looking out for levels, anywhere between ~$265 and ~$300. If price gets smacked down, then we are looking
for the ~$95 to ~$65 levels and a really nice short setup will present itself.

💥 TSLA 4H-TIMEFRAME ANALYSIS💥 TSLA 4H-TIMEFRAME ANALYSIS
💗Hello ladies and gentlemen
This is my new idea for 💥Tesla
I hope my idea is clear
Support me by like and share thank you
Stay Safe💯💲💲💲
Good luck💰😍

TSLA Downtrend and before and after earnings movesHello traders, in this chart I am sharing with you what I have been observing in moves of Tesla stock before and after earnings. As you can see Tesla stock is downtrending. You can see patterns of movement around earnings to forecast what is ahead. Considering what Elon said during annual shareholders’ meeting, Tesla is not immune in the 12 month from the market’s volatility due to economical, geopolitics and other external factors.
From Elon’s speech:
“This is going to be a challenging 12 months, I sort of want to be realistic about it that Tesla is not immune to the global economic environment. I expect things to be just at a macroeconomic level difficult for at least the next 12 months. Like, Tesla will get through it, and we'll do well and I think we'll see a lot of companies go bankrupt. I want to make sure this is not just the "good news parade." - Elon Musk

TSLA are you rdy for short after long?Tesla company, fraudster, man of history
A note for American shareholders, the stock of this company is on the rise, but it will see only two targets, then it will fall, and I will announce the targets.
The first target is $237.40 after the failure of this area, which will be broken because the crypto market will be bullish and Elon Musk's company's shares are in line with this market, he will see the next target and then the fall of $313.80.
After the second target, my suggestion to American shareholders is to sell Tesla shares because the price of this company is not the numbers you see.

Tesla (TSLA): Potential short swing tradeTesla's share price has made a mediocre attempt to rise above $180, yet Friday's bearish engulfing / outside day seems to have different plans. The fact the candle occurred on high volume following a bearish RSI divergence suggests it may have reached (or is close to) a swing high. Furthermore, the reversal candle has formed around the monthly pivot, 61.8% Fibonacci ratio and 50-day EMA and just beneath the 100-day EMA.
- Bears could fade into moves within Friday's rally to anticipate a break of last week's low
- Alternatively, wait for a break of last week's low to assume bearish continuation
- The lows just above 150 make a viable target for bears, with the potential for it to close the gap or test the monthly S1 pivot

TSLA Due for a pullback ?TSLA here in on a 30-minute chart. It is in a channel that has as its basis the 42 ( 7x6) EMA
with the upper and lower bands the 2.618 Fibonacci extensions of the basis value. Accordingly
when hitting the lower band, there is a high probability of reversal to trending up. Conversely,
when hitting the upper band, the price is highly probable to reverse into trending down. Here
TLSA is actually outside that Fibonacci band and getting closer to the absent 4.33 band
TSLA rose more than 5% in the last trading day. Reversion to the mean may apply.
The True Strength Index indicator shows a cross about to occur in the supply /resistance zone
a confirmation expectant for a reversal. Similarly, the Fisher transform shows the signal and
mean lines crossing and inflecting into a negative slope at the top red line. In the immediate
term history, TSLA ran up on Thursday 4/27 / Friday 4/28 hit the upper Fibonnaci band and
dropped after the weekend. I can see this as repeating
Aside from mathematics from the all-important trader psychology side of things, a large #
of traders are up on their position having made it through some downward price action
and then reaccumulation. It is now time to take full or partial profits and close some positions
In the meanwhile, short sellers can see the rise in the last trading
session as a pullback in the trend down and time being ripe to add to their position.
Other short sellers might liquidate and in doing so hold TSLA's price steady in buying to cover.
I can't see the psychology underway. I can however see the indicators and the mathematics
that is their foundation. I will take a trade of put options expiring 5/19 at a strike of
$175. I will watch for a reversal of the reversal mid to late week and upon seeing
it take a partial profit and hold the rest.

TSLA Support & Resistance Guide | Looking to gap fill |- TSLA looking to fill its upper gap
- if we do fill gap looking back to test 186 resistance level
- if QQQ can break to new recent highs than it TSLA will have a good chance to test 186

15 min timeframe short ideaAfter rejecting the over trend of TSLA it's formed a H&S that's text book. Clear h&s with bearish divergence on the MacD and in a downtrend. Pretty easy and self explanatory. As always there's two, or you can use three TP, the first TP is the completion area of the H&S, second would be the closest gap fill/support area, third you can hold until the overall .618 or .886 fib levels.

TSLA Weekly Outlook Which Gap to Fill | NASDAQ at Key Resistance- TSLA trading in between 2 large gaps
- which gap it will fill will likely be determine by which way NASDAQ will move to
- NASDAQ & SPX closed right under Key Resistance
- if we fill the above gap then we are looking back at 186 resistance

Lower prices ahead for TSLAYou can see the oscillators are wanting to reset and converge on the weekly as well as the daily after making yet another failed higher high. If we were treating this Elliot wave theory then we are in the B phase of the 3 count. This could make a same low as previous or go to the overall .886 fib level of the chart before making some kind of bullish divergence on the oscillators and finding bids at a more fair value received area. Watch the key levels and don't FOMO. We all know it won't be a straight line down and TSLA has wild swings. Good luck and be safe, lmk your thoughts below! All consecrative criticism is good criticism as long as it's backed with TA!

TSLA going to January Lows
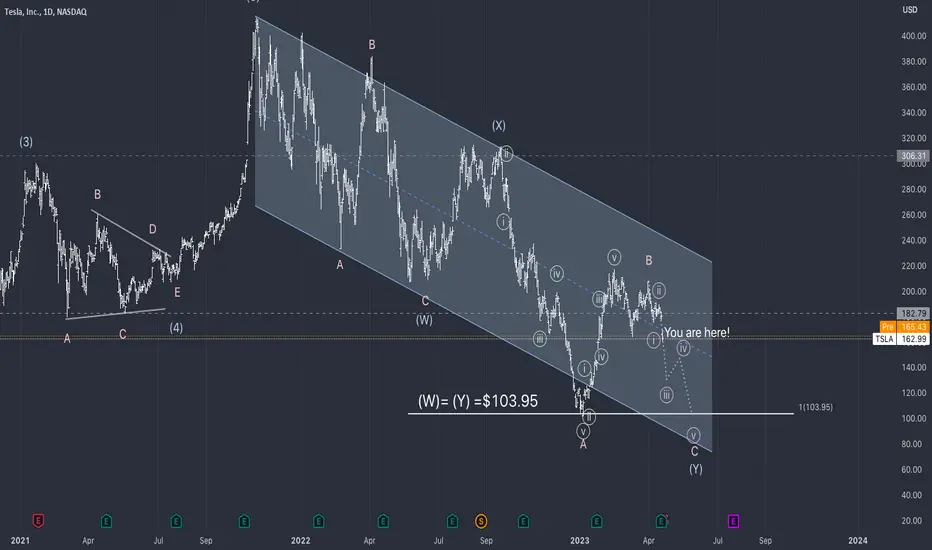
TSLA - Elliott Wave Analysis
There maybe more dramatic Waves out there for Tesla. But for me I had this count since April last year so I am gonna stick with it.
I see a WXY correction. And we are now in minute wave iii of minor wave C of intermediate wave (Y).
Foron this WXY pattern the most common Fibonacci ratio is equality between W= Y. In our case equality is around 103.95
We also have natural graph support around 103 from the previous low in January our wave A of (Y).
What are your thoughts on TSLA ?
Legal Disclaimer: The information presented in this analysis is solely for informational and educational purpose and does not serve as financial advice.
$TSLA Weekly Downtrend Confirmed, $QQQ S&R Analysis - NASDAQ:TSLA broke weekly support confirmed weekly downtrend
- TSLA gap could be filled if we broke todays low of support
- NASDAQ:QQQ bounced off of megaphone pattern support still trading within
- QQQ likely break out of the range next week Tuesday 25th after big tech & MSFT reports earnings.
- Still holding onto my SOXS position
- check out my video from yesterday for big tech analysis key resistance

TSLA Tesla Options Ahead of EarningsIf you haven`t bought TSLA here:
Then analyzing the options chain of TSLA Tesla prior to the earnings report this week, I would consider purchasing
Puts with a $183.33 strike price and an expiration date of 2023-4-21, for a premium of approximately $6.80.
If these options prove to be profitable prior to the earnings release, I would sell at least half of them.
I am interested to hear your thoughts on this strategy.

TSLA Post Earnings Risk Off Scenario TSLA 390m Short Setup: Risk off scenario challenging auction lower last seen EOY 2022: Using levels from December 14, 2022 published study: <165.63: 162.42, 157.67, < GAP Fill Watch: <155.95, 151.08, 147.41, 145.13//Invalidated if auction holds > 164.15// Beta: 2.01, ATR: 8.03, IV: 34/05%// Price at time of publish: 165.47

TSLA Earnings Report Price Action breakdown | Weekly Support |- NASDAQ:TSLA Weekly support $163.91
- currently a 15m bear flag after hours after earnings.
- now in a daily down trend
- next strong support zone in the $166s
- im currently not in the stock my after breaking out of the equilibrium (teal looking wedge) its favoring the bears at the moment.

TSLA Price Action Outlook into Earnings Wednesday AH- NASDAQ:TSLA likely trading sideways into earnings
- 186.19 area is key resistance, need to close above it.
- NASDAQ:QQQ also near resistance if it reject it will likely drag TSLA down and vice versa
