S&P/TSX Composite
KAT - did she finally land on her feet??It's not over. nor has it just begun. but it shows signs of promise.
TMD - good buy yet?I was asked to have a first impressions view of TMD. This is my unrehearsed ramblings of my process. It's always to look at the data and argue the case for both bullish and bearish cases. Feel free to comment on you opinions of TMD as well. Like it or dislike it???
NMX - bottom?NMX is showing signs of finally nearing a bottom. expect more sideways action with some attempted swing trading. but the bear market is not over yet
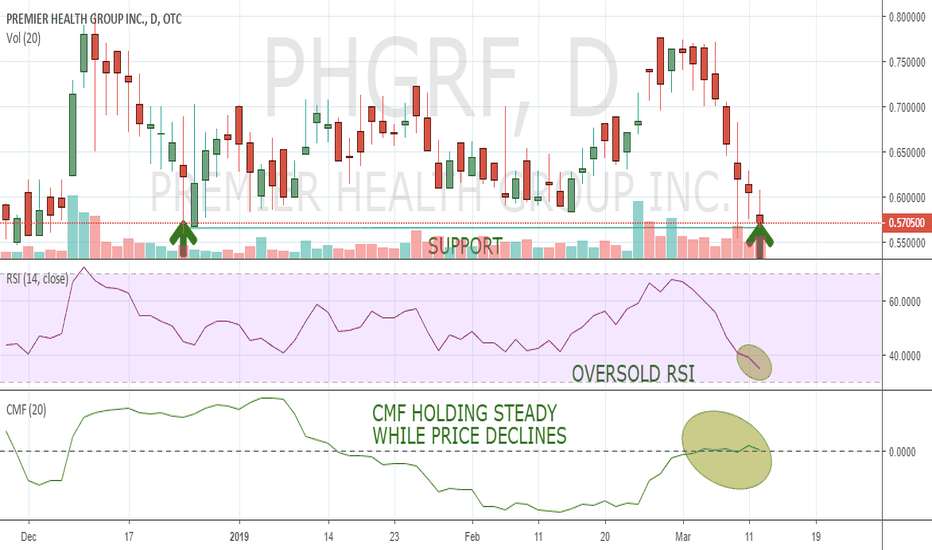
Possible Penny Stock Bounce Set Up(OTC:PHGRF) recently experienced a large sell off with the RSI moving into oversold territory. CMF has held steady during this price decline indicating that investors are not rushing for the exit during this pullback. As (OTC:PHGRF) reaches a support level in the mid .50s the RSI and CMF appear to be signaling a possible bounce from these oversold conditions.
S&P/ TSX Composite Index Intraday Analysis: Bulls in trouble…Price action closed on December 24, 2018 below major support between 14,947.58 and 14,330.16. Moreover same close on December 24, 2018 saw price action close below its bullish trendline that has lasted over a decade.
Both scenarios above do call for a huge caution and/or warning for the current uptrend in the TSX. The market condition for the TSX in this case is therefore a downtrend to a side trend at best.
Resistance or overhead supply lies between 16,586.46 and 16,299.69.
The sideways market condition for the TSX considered in this analysis is better referred to as a rectangle top formation (tentative) that exists mainly between the upper boundary of support i.e. 16,586.46 and lower boundary of resistance i.e. 16,299.69.
Price breaking out above the high made on July 13, 2018 of 16,586.46 marks the resumption of the uptrend in the TSX.
TXBA (Canadian Bank Index) - 60% Countercyclical Short Trade?Hey traders,
Similarly to the US and EU, the Canadian economy is now expressing signals of running into a brick wall.
Canada's yield curve sits on the cusp of inverting for the first time in a decade... banks will increasingly become reluctant to lend as Canada's term structure turns negative. This will impact credit creation, and thus slow down economic growth. The market will begin pricing this in now, and we'll likely have a period of 12-18 months to generate an economic contraction that will significantly influence the price of corporate paper.
Shorting Canadian banks could be a good USD denominated trade as its likely that the USDCAD pair will experience nice strength over the next 12-24 months:
***This is not investment advice and is simply an educational analysis of the market and/or pair. By reading this post you acknowledge that you will use the information here at YOUR OWN RISK
TD Possible Weekly EMA BounceTSX:TD Nearing the 200EMA on the weekly chart. Acted as a nice bounce spot every encounter in the last decade. Considering market environment I will be playing this very safe and waiting for some kind of confirmation before entering a long position. Any kind of daily closes under that range will be enough for me to pass on this trade.
Entry - $65.24
StopLoss - $63.95
Target - $68.95
CIBC Hitting Major Daily S/R LevelTaking a look at the daily chart CIBC TSX:CM to see that it could be at a very decisive point around the $104 area. Price hit a major horizontal that acted as a strong resistance turned strong support with price hitting that level on multiple occasions with subsequently massive price movement to follow.
* If price breaks this S/R level with conviction I will look to enter on a pullback to the S/R level
* If price bounces off this level this week I would cautiously enter a long position with a stop just below the S/R level
Considering the current market conditions and with this being the third retest of the S/R Level coupled with the 100EMA/200EMA bearish cross I'm inclined to favour the bearish scenario over the bullish in this case.
Trade Wisely,
Chloster
TSX:TD Potential downside break Looking at a daily close under $69.20 for a short opportunity. Price is testing a horizontal that acted as strong support twice recently. Coupled with a 100/200EMA cross and current market situation will lead to a break in my opinion.
Entry: Would like to see a strong break of support and take the first retest to the $69 area.
Stop-Loss: $70.10
Take-Profit: $67.66
Gold stocks showing strengthQuite a few gold stocks are showing strength.
All of them have seen-
1. A spike in volume
2. Greater price range for the day
3. New 3-month highs
These indicate a bullish run from Gold stocks, possibly testing previous highs.
Is the fact that gold is a safe haven in bearish markets causing this? Gold price going up, gold stocks going up.
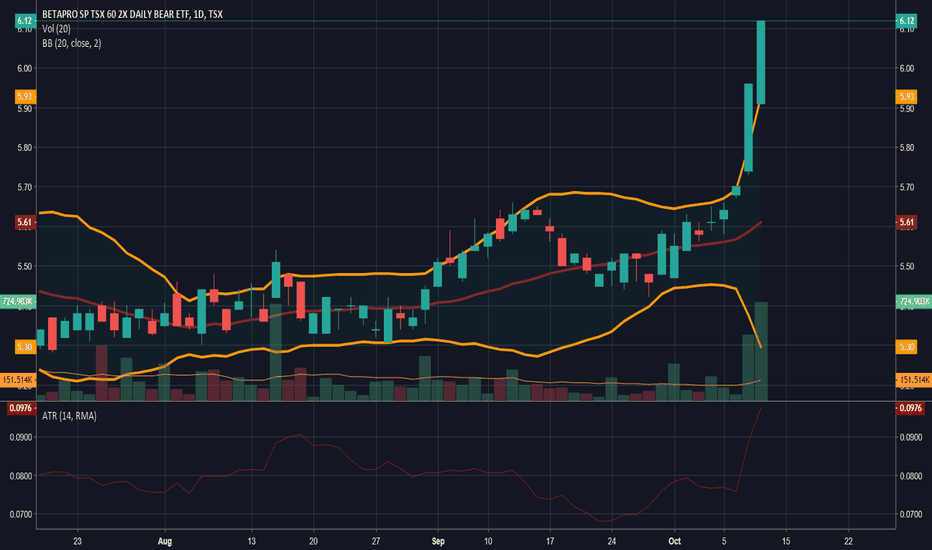
Time to buy inverse etfs? With stocks markets falling like crazy it may be time to hold more cash than equity.
Inverse etfs might be a good hedging idea or a replacement to shorts.
There have been big expansion the last two days. Volatility increase, range increase and strong green candles indicate a bearish tsx.


