MFI in the WAY oversold region , Major Andre trigger support#hive MFI has only ever been in these number two other times in the companies recent history and is quite over sold at least for the time being, the 0.46 level has held for the past few days with a static support of recent floor and also the Andrew fork trigger line support (im yet to see this trigger fail) , with last nights break out on #BTC and the company CEO being more and more vocal all over youtube, next few days may be interesting, however more risk averse play would be hold of till the main trend is reclaimed and prices solidify over the 0.6 marker.
Tsxv
MEDIPHARM - Looking Beatiful!Dear Traders,
Medipharm is looking like some sweet honey on a goat cheese cracker!
They announced some pretty nice things this month, they obtained their License and the day after they announce a Partnership with Supreme Cannabis! They will make sure Medipharm is equipped with the best High Grade Cannabis you can get to let medipharm create High Grade CBD Oils for the market!
Looking at the Daily Chart, We can see that Medipharms shows bullishness! Price action is now located above the main moving averages, so any entry around 1.50 is a pretty good one imo. With a stoploss under the 55 ma (blue line).
All Medipharm needs right now is some more vol! This stock could easily hit the million in volume, but it just needs more investors.
Let's see how this will playout on Monday. Will we get news again this week? Are more investor going to join?
Keep your eyes on the charts!
If you have any questions or any thoughts, feel free send me a PM or to comment on this TA!
If you'd like to join my Discord Channel to talk about stocks, share knowledge and have a laugh then please send me a PM so that I can link you to it!
Take care!
Phase 2 exploration October 1stPhase 2 exploration begins October 1st, and the speculative interest will be increasing.
After trading down on relatively unsurprising news about the drilling done on the western trend, we are setting up for a speculative rally for Phase 2 drilling at the eastern trend at Moosehead.
The 10,000m Phase 2 drilling program will test the area on the eastern trend, where MH18-01 gave the intercept of 11m of 44g/t gold and consequently gave Sokoman Iron Corp some TSXV:SIC ridiculous trading volume and a rapid 1000% increase in share price.
This is an easily accessible area in New Foundland, screaming for mining jobs. While we are far from delineating an actual mineable resource, we are also at a very small market cap where a lot of the hype investors have sold off, and more patient long-term investors have grabbed shares.
On the technicals, we seem to have touched a bottom twice at 0.15 and 0.145.
With an imminent catalyst coming up - 10,000 meters of drilling at the highly prospective eastern trend - there will be serious speculative interest the coming weeks.
Confirmation of the mineralization from MH18-01 meanwhile can take us far beyond what we have seen earlier.
Remeber this is exploration, results are not guaranteed, but speculative interest is definitely going to pick up.
Suggested trade before drill results:
0.15-0.23 BUY
0.25-0.40 SELL
And keep some shares for the assay results in October, that's where it can get really interesting for SIC.
Mean Reversion in FIRE?!FIRE has dropped down to the $1.60-1.70 range a few time in the couple months only to bounce back. This is probably a support level for FIRE.
Every time it hits its support level, a bullish candle is formed and it pushed towards $2+ in the next few days.
Basically, FIRE is shown movement that has been bullish historically.
The slow stochastic supports this oversold idea.
Short Term Trade, stop loss at 1.68.
Buy FCC now!A simple analysis of the uptrend shows the end of a pullback in the FCC uptrend.
FCC bounces back at 1.06-1.07. I see the next move up being up to 1.28-1.30.
Short term reversal in TSXV:EMC?The bullish hammers of the last few days indicate a trend reversal in TSXV:EMC.
Stochastic has been slowly climbing out of the oversold zone and it may just be the right time to buy in.
I am hoping to buy in around 1.44-1.45, and I will place a stop one ATR below at 1.31-1.32 which is below their 52week low (hopefully it holds).
Trend Reversal within trading range in NEPT!?We see a potential reversal in TSX:NEPT indicated by a bullish hammer at its lower bollinger band AND also at a long held support level!
I see TSX:NEPT working its way up to its resistance level at least. Hopefully it can break through the trading range.
TSX:NEPT can be a very volatile stock as indicated by the Average True Range, so buy in very carefully.
RTI Uptrend?1. Bullish hammer at lower bollinger band on 02/02/2018
2. Higher lows the following days.
3. Price closed strongly on 04/02/2018
4. Stochastic turning upwards from a near oversold zone
I identify this as a reversal point for RTI.
I expect it to at least reach $1.7 in the next few days possibly climb up to $1.85-2 level by next week.
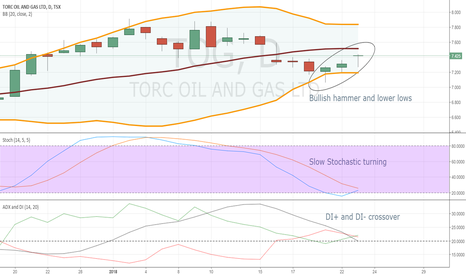
Strong Reversal in TOG?!We see bullish hammers and stochastic turning from its oversold zone.
The DI+ and DI- crossover tells us that the market might trend upwards in the short term!
10% move in THO?Trend reversal emphasized by a bullish hammer and higher lows in subsequent days.
Price is turning from an oversold zone according to stochastic.
I see it rising to a price of $6.4 in the short term.
OGC Reversal after a long downtrend, great buying opportunityThe last few trading days show that this is a good buying opportunity and stock has probably reversed.
Stochastic shows it climbing up from an oversold position and MACD histograms show that the market is trending positively.
I believe OGC could rise up to its previously long held position of $3.45-3.50.
I am placing a stop loss at $3.00, to give myself about 2% breathing space as the stock has been in a downtrend for a long time and the bulls may need some time to gain momentum.
HBM Bouncing off a support level-Target $10.40HBM has bounced off a long held support level. Last few trading days tested lower prices but the bulls won.
MACD and Stochastic show growing momentum and it returning from the oversold zone.
Even if HBM is simply in its trading range, we have an opportunity to buy in so that we can make a sweet 12% if it makes its way to its resistance level at $10.40.
In my opinion, it could possible break past its resistance level.
Trend Reversal in SMF, expecting it to rise at least 9%Bulls are taking over.
Indicated by the strong bullish hammer and stochastic turning from the oversold area.
Added in MACD to further enforce the arising bullish trend.
Shows signs of being a good growth stock but definitely worth swing trading over the next two weeks.
Reversal Trading Strategy, THCX:TSXV -minimum 7% growth expectedReversal Strategy Based on:
1. Price touches or goes below the bollinger band.
2. Stock is trading near or in the oversold region according to the stochastic oscillator.
3. Price formed a bullish hammer and on the following trading day, price did not reach that low.
To reaffirm my strategy, I put in RSI and ADX(with DI+ and DI-) to show that momentum is growing and will trend upwards.
I bought in at 2.50, however it isn't too late to buy. I expect the price to reach 2.84 (it might go even further).
Furthermore, the company is a big player in marijuana and an industry which has seen and will see more growth.
Potential of Breaking Resistance, should reach at least 3.30Kept it simple with this analysis.
Last few candles for AZ were bullish, and we saw it pop up on Friday.
I am confident it will at least get to 3.30, its resistance level. RSI indicates bulls gaining momentum.
However, I also feel like it might break past its resistance level this time as it has reversed at its lower bollinger band with a strong bullish signal twice now.
Emerald Health Therapeutics $EMH.V Emerald Health Therapeutics Inc through its wholly-owned subsidiary is engaged in cultivation and selling of medical cannabis out of its facility located in Victoria, British Columbia.
Looks really good on the Weekly Chart. Coming out of a squeeze. Watch for a close above $1.38 for trend confirmation. $1.80 is my target.
Trading with the Trend, $APH$APH, Aphria Inc. has been uptrending for months now. Using the lin reg lines you can see that it has bounced off of the top and has recovered using the mid line as a support. As stated on the chart there are several bullish indications and Im looking for a price target somewhere along the top lin reg line (green rectangle on chart).
Trade valid until price closes below mid lin reg line.


