TUSDT 1W AnalysisTUSDT ~ 1W Analysis
#TUSDT This trade is very high risk. Buy if you still have confidence in this coin with a short term target of at least 20%++
Tusd

TUSDT 1WT ~ 1W Analysis
#T This trade is very high risk. Buy from here with a short -term target of at least 20%+. This is the lowest support for now.
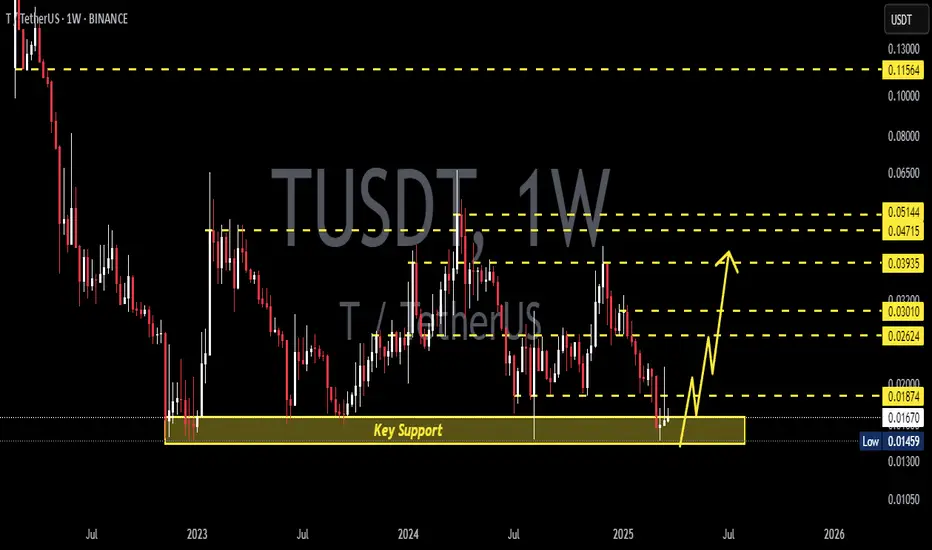
#T (SPOT) entry (0.026- 0.032) T.(0.13600) SL(0.02579)BINANCE:TUSDT
entry range (0.026- 0.032)
Targets ( .034 - .045 - .048 - .059 - 0.065 - 0.095 - 0.1149 - 0.136 )
SL .4H close below (0.02579)
______________________________________________________________
Golden Advices.
********************
* collect the coin slowly in the entry range.
* Please calculate your losses before the entry.
* Do not enter any trade you find it not suitable for you.
* No FOMO - No Rush , it is a long journey.
Useful Tags.
****************
My total posts
www.tradingview.com
1Million Journey
www.tradingview.com
www.tradingview.com
**********************************************************************************************
#Manta #OMNI #DYM #AI #IO #XAI #ACE #NFP #RAD #WLD #ORDI #BLUR #SUI #VOXEL #AEVO #VITE #APE #RDNT #FLUX #NMR #VANRY #TRB #HBAR #DGB #XEC #ERN #ALT #IO #ACA #HIVE #ASTR #ARDR #PIXEL #LTO #AERGO #SCRT #ATA #HOOK #FLOW #KSM #HFT #MINA #DATA #SC #JOE #RDNT #IQ #CFX #BICO #CTSI #KMD #FXS #DEGO #FORTH #AST #PORTAL #CYBER #RIF #ENJ #ZIL #APT #GALA #STEEM #ONE #LINK #NTRN #COTI #RENDER #ICX #IMX #ALICE #PYR #PORTAL #GRT #GMT #IDEX #NEAR #ICP #ETH #QTUM #VET #QNT #API3 #BURGER #MOVR #SKL #BAND #ETHFI #SAND #IOTX #T

Threshold token T / USDT
Breakout is done ✔️
retest is going on weekly time frame
Holding current support is very bullish

Thoughts on TruFi and the potential trend on RWA.Good deals, and may luck be on your side. Good day, dear readers. Today I suggest taking a look at the TruFi token. I'm not recommending buying it, but rather considering it from an investment perspective for the upcoming bull market.
In brief, TruFi is a lending protocol (lend/borrow) linked to RWA (real-world asset tokenization). The system even has its own not very successful stablecoin, which has recently been somewhat detached due to various events involving Binance, Justin Sun, etc., although as claimed by the teams and other people, this stablecoin was fully backed by dollars.
The token and platform's interest lies in its interaction with the real world. In my humble opinion, tokens from this sector will experience hype during market growth. Additionally, loan defaults lead to quite real legal consequences (with their pros and cons). As far as I understand, market participants (crypto enthusiasts, hodlers, coin holders, and ordinary people unrelated to institutional investments) can provide liquidity to the DeFi protocol. After that, a borrower who can borrow money, not in ethers or bitcoins, but in dollars, can be found.
Observing the perplexing movements of the stablecoin, I intentionally write this review to draw your attention to this asset. This is not a call to buy at current prices, as the price could very well break new lows before trending upward or stagnating. Nevertheless, this is a rather risky investment, suitable for a short-term peak and the first downturn of the bull market, but with the potential for decent returns. Since hitting bottom, the token has only risen by 120%, and the first subsequent minimal target would be beyond local highs, likely much higher. Even upon reaching this target, we could expect a 130% profit from this position. My motivation for investing in it (although I bought earlier and now hold about 40%) is the price bottom, token revival (albeit not very successful, as the daily candle was extinguished), prolonged accumulation, high previous highs, and potential hype associated with RWA.
The target on the chart is minimal and conditional, and cup-and-handle formations often do not play out and are frequently fictitious.
If you do seriously consider the possibility of acquiring the token, be sure to study it independently and at least read about it, as from the perspective of conservative investments, this is an extremely risky deal. I strongly advise against investing more than 0.5%-1% of your total portfolio.
This review is a work of fiction and is not an investment recommendation.

18% drop coming for THRESHOLD!Threshold | T | has been on a tear up until the past few days. Even though it has dropped dramatically, it looks like an additional 18% drop is on the horizon.

TUSDTBINANCE:TUSDT Long idea 10% potential
⛔"Daily crypto market analyses I provide are personal opinions & not financial advice. Trading carries risks, so do your own research & seek advisor's help.#DYOR"
Don't forget to like and comment

TUSD: Strong breakout confirmed. Rally just beginning.Threshold crossed over the LH trendline of 2023, turning bullish on the 1D timeframe (RSI = 67.372, MACD = 0.000, ADX = -21.212). This is a confirmation that a new rally has started, as it also closed over the 1D MA50. This has been done before on June 23rd but there was no RSI Bullish Divergence as it built up now.
Consequently, the short term target is the 1D MA200 (TP1 = 0.0240) and after a pullback rebuy and target the R1 level (TP2 = 0.02955). After that, the upper Fibonacci levels will play the Resistance part.
## If you like our free content follow our profile to get more daily ideas. ##
## Comments and likes are greatly appreciated. ##


TUSDTWe reached a relative support that can bring the price back up. Also, this support is located on the 0.786 Fibonacci line, which is being tested for the first time. 0.030 can be a strong resistance and I don't think it can be broken soon, so it is a suitable target.
⚠️ "Daily crypto market analyses I provide are personal opinions & not financial advice. Trading carries risks, so do your own research & seek advisor's help."

🔥 TRX Pumping On Zero Fee Bitcoin Trading: Great Long Term PlaySince the 22nd of March this year, the BTC/TUSD pair is tradable on Binance with zero fees. TUSD is the stable coin connected to TRX (Tron).
Ever since the zero fee trading went live, TRX has been outperforming Bitcoin by quite a margin. As seen on the chart below, the TRX/BTC pair has been pumping for weeks now, whilst the majority of tokens have been losing value against Bitcoin.
TRX is not some new hot token of the moment, so there's little reason for it to pump organically, so my assumption is that zero fee BTC/TUSD trading has increased demand for TUSD, and thus increased demand for TRX since it's an algorithmically pegged stablecoin (like LUNA and USTC).
As long as this zero fee trading is in effect, I'd wager that the demand for TRX will only increase from here, especially when the "real" bull-market will start and volume will increase next year or so.
Do you think TRX is a good long-term play, or is this pump temporary? Share your thoughts 🙏

TUSDT massive move in order...TUSD is bound for a massive reversal to the upside.
It has created daily higher lows. Accumulation for this is ON.
The chart is self explanatory. :)
SEEDED L 0.0360
TAYOR.

TUSD hit the Cycle's Golden Ratio. Expecting correction.Threshold (TUSD) just hit the 0.618 Fibonacci retracement level of the Bear Cycle just one day after breaking above its 1D MA200 (orange trend-line) for the first time in history. Needless to say this is a major bull target hit, the new Bull Cycle is already underway and as the 1D RSI almost reached 95.000, the overbought condition technically couldn't be higher.
Being the Golden Ratio, we expect a pull-back now on the 0.618, which can extend as low as the 0.382 Fib. Technically this is a major demand level as the zone within the 0.382 and 0.03200 was a strong Support level From May until August. An RSI around 50.000 with a price near the 1D MA50 (blue trend-line) would tick all the boxes for the next long-term buy. Our target is 0.1000 on a quarterly horizon.
-------------------------------------------------------------------------------
** Please LIKE 👍, FOLLOW ✅, SHARE 🙌 and COMMENT ✍ if you enjoy this idea! Also share your ideas and charts in the comments section below! **
-------------------------------------------------------------------------------
💸💸💸💸💸💸
👇 👇 👇 👇 👇 👇

Peg of Stable CoinsStablecoins are cryptocurrencies whose value is pegged, or tied, to that of another currency, commodity, or financial instrument.
Stablecoins aim to provide an alternative to the high volatility of the most popular cryptocurrencies, including Bitcoin (BTC), which has made crypto investments less suitable for common transactions.
(Investopedia)
This graph shows the pegged value of the main stable coins.
Ideally, the value should be 1:1.
In this crash scenario, I will stay alert on these values.

USDT warn! only the tokens on the PoS network will be redeemableGrayscale warning ahead of the Ethereum Merge: “issuers like Tether and CirclePay have stated that post-fork, only the tokens on the PoS (proof of stake) network will be redeemable”, so if the PoS-based Ethereum fork goes “live with a parallel DeFi ecosystem, collateralized with unredeemable stablecoins, users and smart contracts may attempt to liquidate positions on the new chain, contributing to sell pressure on the new token.”
The worst case scenario of the Merge is the collapse of Ethereum based stablecoins, so be careful with those.

T/usdt - Update 10/05/2022Observe the price reaction at the marked areas.
The Threshold network provides and maintains a suite of cryptographic primitives for several dApps. The network is the product of the protocol merger between the Keep Network and NuCypher, which was finalized on January 1, 2022 with the launch of the T token.

TUSDT - SETUPTUSDT price drop significantly and reached at a strong support zone. Now bulls can trigger themselves and make a good upside move. Let's see how the price action establishes in this area.

T/USDT - Buy Zone (0.14x)T/USDT - Buy Zone (0.14x)
Note:
The idea is based on the author's personal opinion.
Not investment advice.
Good luck!

XAUUSD !! Wolf's visionI offer you a different vision than everyone else has seen. Watch how the channels will work with the fibonacci levels I have been working on and developing for the last 1 year.
Please push **LIKE** to support idea , thanks
This post does not provide financial advice. It is for educational purposes only! You can use the information from the post to make your own trading plan for the market. But you must do your own research and use it as the priority. Trading is risky, and it is not suitable for everyone. Only you can be responsible for your trading.

Inner Circle BNB/TUSD #fibcircle #bnb #crypto #tusd $BNBBnb could be dropping down to support levels here . See our red candles now curving down along that blue fib circle line ? I expect that to continue . Also see that red arrow pointing down ? That shows our candles already wicking down into that green Ichimoku Cloud . We are almost certainly going to be crossing down through this cloud and closing underneath it at some point . There is a support level below us near $16 by that red dotted line . Below that is a .236 fibonacci level near $14 . If we dump below both of those it is very possible we revisit the $10 level again -perhaps even lower . See that red question mark ? That's sitting on the bottom edge of that purple Gann Fan line which we are also in right now . It's possible we touch down to this line at some point . How long will that take ? I have no idea . I'm sure there will be some up and down along the way but probably this will take months . Also notice this is the TUSD pair of BNB . That's True USD stablecoin on Binance . Apparently this is a stablecoin fully collateralized with multiple escrow accounts but I'm trying to limit my tether exposure to some extent when I can .

TUSDUSDT pair as a BTC top bottom indicatorI noticed a correlation of tops and bottom in TUSDUSDT pair with that of BTC. I use a regression channel to detrend TUSDUSDT and invert the price to match tops with BTC tops and Bottoms with BTC bottoms.
Currently it gives a bottom signal which means a long entry.

BTCUSD BEAR TRAP IN ASCENDING TRIANGLEWe have to take closer look on the momentum of price and look for confirmation after retracing back to test the trend line, if it will act as resistance or support. cheers.

USDT - Stablecoins, crypto, market cap growthWill these market caps ever stop going up? USDT, USDC, PAX, BUSD, TUSD, DAI . Maybe XUSD crypto coming
