TRADING RULES FROM REAL MARKET GURUSAll beginner traders, having received their first losses in the market, start to scramble in search of "golden rules" of trading or proven solutions from recognized gurus of financial markets. Basically, having received basic knowledge of trading and having traded for a few days on a demo account, they open a real account and deposit, sometimes, quite large sums of money into it. In most cases, the money is either partially or completely lost in a short period of time. It should be understood that trading is a serious work. It requires not only desire, but also free time and emotional expenditures.
As in any job, young specialists turn to the experience of their professional colleagues, studying their experience and various effective techniques. Trading is no exception, where there are also plenty of professionals and real gurus whose experience should be studied. We will look at rules from world-famous traders.
Rule #1 from Warren Buffett
"The market is a device for transferring money from the impatient to the patient"
Great words, aren't they? In the market with profit remains the one who knows how to wait patiently. Before you open a trade, you need to do a thorough analysis. Study all the factors that influence the trading instrument at the current moment of time, what will influence in the short and medium term. Calculate the support and resistance levels, etc. Only after that, start searching for the most promising point of entry into a trade. Do not rush to open a trade if there is no signal to open a trade. Patience is also necessary when fixing profits. "Let profits grow" thee say.
Wait until the dynamics of movement does not begin to decrease, and the strategy does not begin to signal a change of trend. Only in this way you will be able to earn the maximum on each price movement. After making a profitable trade, take a break for rest. Those who rush in the market, sooner or later lose their capital.
Rule #2 from Larry Connors
"I get real, real concerned when I see trading strategies with too many rules"
Everything brilliant is simple! Each of us is probably familiar with this expression. It is also applicable to trading on financial markets. If, again, we pay attention to trading gurus, we can see an interesting fact - all of them mostly use very simple trading systems (TS). Some of them use their own author's TS, some of them use existing ones that have been tested for years. Take Alexander Elder, who is the author of the "Three Screens" strategy. His system is as simple as possible and uses several standard technical indicators built into any trading platform. Anyone can master Alexander Elder's system, and due to its effectiveness, the TS is used by tens of thousands of traders around the world.
Do not try to find or independently develop a mega-complex trading system. The more "elements", indicators, etc. in it, the more false signals it will produce. It will be quite difficult to find the only true signal among them. Your system should produce one or more signals, when they coincide, you open a trade. It is very important, as we pointed out in the first rule, to be patient and wait.
Rule #3 from Peter Lynch
“In this business if you’re good, you’re right six times out of ten. You’re never going to be right nine times out of ten.”
Peter Lynch, a world-famous American investor, was also a follower of simple trading and market analysis techniques. What did the guru wanted to emphasize in his statement? First of all, a large number of beginner traders stay in a delusion for a long time. They think that it is possible to achieve such a level of analysis that will allow them to make 100% forecasts all the time. The market is volatile. Sometimes there are trading situations when the market goes against technical and fundamental analysis. It is impossible to predict such market behavior. Secondly, because of this misconception newbies try to achieve only profitable trades on the market. So that there was not a single losing one in their account history. As a result, they try different strategies, read tons of books on market analysis, but still lose money. As a result, someone "gets an idea" and starts to understand what Lynch was talking about, and someone just quits the market.
Rule #4 from Henrique M. Simoes
"In trading, the impossible happens about twice a year"
In the fourth rule, we will focus on market volatility. These market "impossible" situations do occur periodically. For example, a trading instrument has been growing for a long time, and analyses signal us about the trend reversal. However, the instrument is still growing, breaking all levels. It happens that even some fundamental event, which 100% should lead to a trend reversal, on the contrary, accelerates the current trend even more. There are also more unpredictable situations, when the currency can rise in price twice within a few seconds.
An example is the situation with the Swiss franc, which at the beginning of 2015 strengthened against the U.S. dollar by almost 3000 points. On that day, not only a large number of traders around the world went bankrupt, but also several large Western brokers. Yes, such situations are very rare, once in 5-10 years, but they happen. How to protect against them? If we consider the example with the Swiss franc, a stop-loss would not have saved you, because the price changed at once. The only thing that could really help is to open trades with a small volume that can withstand such a strong movement.
Rule #5 from Jesse Livermore
“There is time to go long, time to go short and time to go fishing”
If you don't enjoy fishing, play a sport or make a field trip outdoors. You should definitely take a break from the market. Especially if you have a series of losing trades. Beginners are not ready for such psychological pressure, so regular breaks should be mandatory. The market will not go anywhere and will not run away, you can always return to it and continue trading. Large and experienced investors are well aware of this, so they do not forget to allocate enough time for rest. The situation is completely different for beginner traders. These two categories of traders mainly trade intraday or use scalping, so they have to constantly monitor the market sitting behind the monitor. As a result, psychological fatigue accumulates, the trader's eye gets tired and he starts to make mistakes that lead to losses. Be sure to rest, it is a guarantee not only of your health, but also of potential profit in the future.
It is extremely important to study the experience of professional traders who have achieved outstanding success in the financial markets. As you can see, many quotes hide not only the entire trading experience collected in one phrase, but sometimes the entire life of the author.
Tutorial

📈Golden Cross and Death Cross: Decoding Forex Trading Signals📉
✅When it comes to analyzing the Forex market, traders often rely on various indicators and patterns to make informed decisions. Two popular patterns that can provide valuable insights are the golden cross and death cross. In this article, we will explore what these terms mean, how they can be identified, and how traders can use them to their advantage.
✅Golden Cross:
The golden cross is a bullish signal that indicates a potential uptrend in the market. It occurs when the shorter-term moving average, typically the 50-day moving average, crosses above the longer-term moving average, usually the 200-day moving average. This crossover suggests that the price is gaining momentum and that buyers are becoming more active.
Traders often interpret the golden cross as a confirmation of a strong market sentiment, leading them to open long positions or increase their current holdings. It is seen as a positive sign as it suggests that a positive trend is likely to continue.
✅Death Cross:
On the other hand, the death cross is a bearish signal indicating a possible downtrend. It occurs when the shorter-term moving average crosses below the longer-term moving average. Similar to the golden cross, the death cross is typically identified using the 50-day and 200-day moving averages.
The death cross can be interpreted as a confirmation of a negative market sentiment with increased selling pressure. Traders may consider opening short positions or reducing their existing long positions in anticipation of a downward trend.
✅Using Golden Cross and Death Cross in Forex Trading:
While the golden cross and death cross patterns can provide valuable insights, traders should not solely rely on them for making trading decisions. It is important to consider other indicators, fundamental analysis, and overall market conditions.
🟢Confirmation: Traders should look for additional confirmation, such as increased trading volume or other technical indicators aligning with the signal, before entering a trade.
🟢Timeframes: Different timeframes (hourly, daily, weekly, etc.) can produce different crossing signals. Traders should select the timeframe that suits their trading strategy and goals.
🟢False Signals: It is crucial to acknowledge that golden cross and death cross signals are not foolproof. In certain market conditions, they may generate false signals, leading to incorrect trading decisions. Thus, it is advisable to use them in conjunction with other technical analysis tools.
✅The golden cross and death cross are popular patterns used in Forex trading to identify potential bullish and bearish market conditions, respectively. These signals provide traders with valuable information about market sentiment, allowing them to make more informed trading decisions. However, it is important to use these patterns in conjunction with other indicators and analyses to increase the probability of success. Remember, understanding these patterns is just the beginning of the trading journey – continuous learning and adaptation are key to becoming a successful trader.
I hope this post was helpful to some of our beginner traders😊
Dear followers, let me know, what topic interests you for new educational posts?

🐼Mastering the Art of Forex Trading Strategies🐼
Key words:
,,,,, , ,,
🐼The world of forex trading is as fascinating as it is dynamic. To thrive in this fast-paced market, developing a robust trading strategy is paramount. In this article, we will explore the key points that can help you identify and refine your trading strategy, bringing you closer to success.
🐼Identifying Market Trends:
Understanding market trends is crucial in making informed trading decisions. By analyzing moving averages, trend lines, and price patterns, you can identify the prevailing market direction and potential opportunities.
🐼Implementing Effective Risk Management Strategies:
Mitigating risks is a vital aspect of any trading strategy. Set appropriate stop-loss orders, determine suitable position sizes, and manage leverage wisely to protect your capital and minimize exposure to potential losses.
🐼Incorporating Technical Analysis Tools:
Technical analysis tools provide valuable insights into market behavior. Use oscillators like the Relative Strength Index (RSI) to identify overbought or oversold conditions, Fibonacci retracement levels to pinpoint support and resistance levels, and Bollinger Bands to gauge market volatility.
🐼Staying Informed about Market News and Economic Calendar Events:
Keeping up with the latest news and economic events can provide valuable context for your trading strategy. Monitor economic indicators such as GDP releases, central bank meetings, and geopolitical events to understand potential impacts on currency movements.
🐼Conclusion:
Crafting a successful forex trading strategy requires a comprehensive approach that covers market trend identification, risk management, technical analysis, and staying informed about market news. By incorporating these key points into your strategy, you can enhance your trading skills and increase your chances of long-term success in the forex market. Remember, forex trading is a continuous learning journey, so adapt and evolve your strategy as the market evolves.
Please cheer me up with a like and a nice comment😸❤️
Please, support my work with like and comment!
Love you, my dear followers!👩💻🌸

❌Trading Mystery: Why 95% Of You Will Fail❓
🟥The world of forex trading holds immense allure - the promise of financial freedom and the opportunity to make money from the comfort of your own home. However, it is no secret that the path to success in forex trading is treacherous, with estimates suggesting that a staggering 95% of traders fail to achieve their desired outcomes. So, what exactly goes wrong for these aspiring traders? Let us unlock the creative narrative behind this apparent mystery and delve into the reasons that prevent them from cracking the code.
♦️Lack of Proper Education:
Just as successful carpentry requires the right tools, so does forex trading. Many traders dive into the financial ocean without a true understanding of its currents, waves, and hidden dangers. They overlook the importance of acquiring comprehensive knowledge about markets, technical indicators, risk management, and strategies. Without a firm grasp of these essentials, traders unwittingly chart a course for disaster.
♦️Emotional Tempests:
Imagine being a captain of a ship, navigating treacherous waters while being plagued by anxiety and fear. Forex trading is not for the faint of heart. As the markets fluctuate, traders battle their own emotions, succumbing to impulses that lead to impulsive trading decisions. Greed, fear, and overconfidence can cloud judgment, causing traders to buy or sell impulsively rather than relying on calculated analysis. Emotion-driven trading inevitably leaves traders shipwrecked amidst the unforgiving tides of the forex market.
♦️Unforeseen Volatility:
The forex market is a living organism that reacts to an array of factors, from economic data to geopolitical events. These dynamics can send currency values into a frenzy, defying logic and leaving traders bewildered. Sudden fluctuations, unpredictable trends, or unexpected policy decisions can capsize even the most astute trading strategies. By underestimating volatility, traders find themselves drowning rather than riding the waves.
♦️Inadequate Risk Management:
Imagine moving forward without a life jacket while navigating choppy waters. This risky endeavor can lead to dire consequences, just like trading without proper risk management. Successful traders understand the importance of setting stop-loss orders, managing trade sizes, and allocating a portion of their capital to each trade. Those who disregard risk management find themselves sinking beneath the weight of their poor decisions.
♦️Overreliance on Automation:
In recent years, the rise of automated trading systems has piqued the interest of aspiring traders. While these algorithms can streamline processes and enhance efficiency, they are not a guarantee of success. Blindly relying on automation without understanding how it works or constantly monitoring its performance may result in unexpected losses. It is essential to strike a balance between human insight and technological support.
🟥The realm of forex trading is a captivating one, tantalizing traders with elusive riches. However, becoming part of the 5% who succeed requires diligence, perseverance, and a deep understanding of the whimsical nature of the market. One must embark on this journey by arming themselves with knowledge, taming their emotions, embracing volatility, implementing effective risk management, and balancing human intuition with automation. Only then can traders hope to navigate the tempestuous seas and emerge victorious in their pursuit of forex trading success.
😸Thank you for reading buddy, hope you learned something new today😸
Do you like this post? Do you want more articles like that?

4 BUYING OPPORTUNITIES1. Impulse Move Buying Opportunity
Impulse move buying is a trading strategy that involves buying when the price makes an impulse move from the key level. Price makes a higher high, breaking through the previous high—a break of structure. The market pulls back to 1/3 of the impulse move, and then traders can look for signals. Usually, price action doesn't make a deep pullback after an impulsive movement. A stop-loss may be placed at the 61.8% Fibonacci level.
2. Golden Zone Buying Opportunity
Golden zone buying is a trading strategy that involves buying at a 61.8% Fibonacci level. The price pulls back to the key level and bounces off. Price action breaks the structure by making higher highs and higher closes above the previous high. The market can potentially cause a complex pullback towards the golden zone. The 61.8% golden zone must line up with a significant level, forming a confluence zone. The stop-loss may be placed at the 88.6% Fibonacci level, which is near the key level.
3. Institutional-Level Buying Opportunity
Institutional-level buying occurs when large market participants collect liquidity at the key structure level. The price movement of the institutions may be recognized when prices make large moves like engulfing candles or pinbars. This zone creates supply and demand levels. As a general rule, the market breaks through the structure and pullbacks to the 78.6% discount zone, and at this point we can look for buying opportunities. A stop loss can be placed at the 113% Fibonacci inversion level of the leg that breaks the structure, which is HH-HL.
4. Stop Hunt Level Buying Opportunity
Stop hunting level Buying is a trading strategy that involves buying a security at a price level that is attractive to large traders. This type of buying opportunity is typically used when a price reaches a level that is seen as attractive by large traders. The strategy is often used to capitalize on market inefficiencies and take advantage of the momentum created by large traders. The price action after the breaking structure usually returns to the key level by making a deep pullback. Many traders at this point have closed their positions, thinking the price might continue to move down. However, large institutions that pushed prices out of this zone protected the level, and prices continue to trend in the primary direction. The entry point is usually 88.6% Fibonacci, which gives the best R/R. A Stop loss below the level at the Fibonacci inversion level.

7 Expert Risk Management Techniques for TradingRisk management refers to the techniques used to identify, evaluate, and mitigate the potential risks associated with trading and investing. Whether you are a day trader, swing trader, or scalper, effective risk management can help you minimize losses and protect your hard earned money all while maximizing potential profits.
Let's take a look at the top 7 risk management techniques for trading! 👌
Have a Trading Plan
Many traders jump into the market without a thorough understanding of how it works and what it takes to be successful. You should have a detailed trading plan in place before making any trades. A well-designed trading plan is an essential tool for effective risk management.
A trading plan acts as a roadmap, laying out a set of guidelines/rules that can help traders avoid impulsive decisions. It is crucial because it requires you to think deeply about your approach before you begin risking real money. Having a plan can help you stay calm under stress as your plan will have specific steps to take for anything the market throws at you.
It is essential to clearly define your trading goals and objectives. Are you aiming for short-term gains or long-term wealth generation? Are you focused on a specific asset class or trading strategy? Setting specific and measurable goals helps you stay focused and evaluate your progress.
Another important part is to describe the trading strategy you will employ to enter and exit trades. This includes the types of analysis you will employ (technical, fundamental, or a combination), indicators or patterns you will rely on, and any specific rules for trade execution. Determine your risk tolerance, set appropriate position sizing rules, and establish stop-loss levels to limit potential losses.
The Risk/reward ratio
When you are planning to open a trade, you should analyze beforehand how much money you are risking in that particular trade and what the expected positive outcome is. Here is a useful chart with some examples to understand this concept:
As you can see from the data above, a trader with a higher RR (risk-reward ratio) and a low win rate can still be profitable.
Let’s examine this a little more by looking at a profitable example with a 20% success rate, a RR ratio of 1:5, and capital of $500. In this example, you would have 1 winning trade with a profit of $500. The losses on the other 4 trades would be a total of $400. So the profit would be $100.
An unprofitable RR ratio would be to risk, for example, $500 with a success rate of 20% and a risk/reward ratio of 1:1. That is, only 1 out of 5 trades would be successful. So you would make $100 in 1 winning trade but in the other 4 you would have lost a total of -$400.
As a trader, you need to find the perfect balance between how much money you’re willing to risk, the profits you’ll attempt to make, and the losses you’ll accept. This is not an easy task, but it is the foundation of risk management and the Long & Short Position Tools are essential.
You can use our 'Long Position' and 'Short Position' drawing tools in the Forecasting and measurement tools to determine this ratio.
Stop Loss/Take Profit orders
Stop Loss and Take Profit work differently depending on whether you are a day trader, swing trader or long term trader and the type of asset. The most important thing is not to deviate from your strategy as long as you have a good trading strategy. For example, one of the biggest mistakes here is to change your stop loss thinking that the losses will recover... and often they never do. The same thing happens with take profits, you may see that the asset is "going to the moon" and you decide to modify your take profit, but the thing about markets is that there are moments of overvaluation and then the price moves sharply against the last trend.
There is an alternative strategy to this, which is to use exit partials, that is closing half of your position in order to reduce the risk of your losses, or to take some profits during an outstanding run. Also remember that each asset has a different volatility, so while a stop loss of -3% is normal for a swing trading move in one asset, in other more volatile assets the stop loss would be -10%. You do not want to get caught in the middle of a regular price movement.
Finally, you can use a trailing stop, which essentially secures some profits while still having the potential to capture better performance.
Trade with TP, SL and Trailing Stop
Selection of Assets and Time intervals
Choosing the right assets involves careful consideration of various factors such as accessibility, liquidity, volatility, correlation, and your preference in terms of time zones and expertise. Each asset possesses distinct characteristics and behaviors, and understanding these nuances is vital. It is essential to conduct thorough research and analysis to identify assets that align with your trading strategy and risk appetite.
Equally important is selecting the appropriate time intervals for your trading. Time intervals refer to the duration of your trades, which can span from short-term intraday trades to long-term investments. Each time interval has its own advantages and disadvantages, depending on your trading style and objectives.
Shorter time intervals, such as minutes or hours, are often associated with more frequent trades and higher volatility. Traders who prefer these intervals are typically looking to capitalize on short-term price fluctuations and execute quick trades. Conversely, longer time intervals, such as days, weeks, or months, prove more suitable for investors and swing traders aiming to capture broader market trends and significant price movements.
Take into account factors such as your time availability for trading, risk tolerance, and preferred analysis methods. Technical traders often utilize shorter time intervals, focusing on charts, indicators, and patterns, while fundamental investors may opt for longer intervals to account for macroeconomic trends and company fundamentals.
For example, If you are a swing trader with a low knack for volatility, then you can trade in assets such as stocks or Gold and ditch highly volatile assets such as crypto.
Remember that there is no one-size-fits-all approach, and your choices should align with your trading style, goals, and risk management strategy.
Here is a chart of Tesla from the perspective of a day trader, a swing trader, and an investor:
Backtesting
Backtesting plays a crucial role in risk management by enabling traders to assess the effectiveness of their trading strategies using historical market data. It involves the application of predefined rules and indicators to past price data, allowing traders to simulate how their trading strategies would have performed in the past.
During the backtesting process, traders analyze various performance metrics of their strategies, such as profitability, risk-adjusted returns, drawdowns, and win rates. This analysis helps identify the strengths and weaknesses of the strategies, allowing traders to refine them and make necessary adjustments based on the insights gained from the backtesting results.
The primary objective of backtesting is to evaluate the profitability and feasibility of a trading strategy before implementing it in live market conditions. By utilizing historical data, traders can gain valuable insights into the potential risks and rewards associated with their strategies, enabling them to manage their risk accordingly.
However, it's important to note the limitations of backtesting. While historical data provides valuable information, it cannot guarantee future performance, as market conditions are subject to change. Market dynamics, liquidity, and unforeseen events can significantly impact the actual performance of a strategy.
There are plenty of ways to backtest a strategy. You can run a manual test using Bar Replay to trade historical market events or Paper Trading to trade real examples. Those with coding skills can create a strategy using Pine Script and run automated tests on TradingView.
Here is an example of the Moving Averages Crossover strategy using Pine Script:
Margin allocation
We are not fortune tellers, so we cannot predict how assets will be affected by sudden major events. If the worst happens to us and we have all of our capital in a particular trade, the game is over. There are classic rules such as the maximum allocation percentage of 1% per trade (e.g. in a $20,000 portfolio this means that it cannot be risked +$200 per trade). This can vary depending on your trading strategy, but it will definitely help you manage the risk in your portfolio.
Diversification and hedging
It is very important not to put all your eggs in one basket. Something you learn over the years in the financial markets is that the unexpected can always happen. Yes, you can make +1000% in one particular trade, but then you can lose everything in the next trade. One way to avoid the cold sweats of panic is to diversify and hedge. Some stock traders buy commodities that are negatively correlated with stocks, others have a portfolio of +30 stocks from different sectors with bonds and hedge their stocks during downtrends, others buy an ETF of the S&P 500 and the top 10 market cap cryptos... There are unlimited possible combinations when diversifying your portfolio. At the end of the day, the most important thing to understand is that you need to protect your capital and using the assets available to you a trader can hedge and/or diversify to avoid letting one trade ruin an entire portfolio.
Thank you for reading this idea on risk management! We hope it helps new traders plan and prepare for the long run. If you're an expert trader, we hope this was a reminder about the basics. Join the conversation and leave your comments below with your favorite risk management technique! 🙌
- TradingView Team

Understanding the Elliott Waves The market always moves in waves. It is not surprising that for decades traders have been trying to find special market patterns that would help to predict the development of the wave structure of the market. Various systems were created, where the waves were based on theoretical and practical basis. Perhaps the most popular theory on this subject is called Elliott Waves.
Ralph Nelson Elliott was actually a professional accountant. He obviously had a lot of time to analyze charts for several decades, so he put all his observations in a tiny book "The Wave Principle", which was published in 1938. According to Elliot, everything in human civilization is in some rhythmic order, so this rhythm, these wave amplitudes can be " drawn" into the future, which allows you to predict the financial markets.
Elliot's theory seemed interesting to few people during his lifetime. Elliott passed away in 1948 and was immediately forgotten. His theory was used by just a few stock experts. Only thanks to Chalz Collins these waves were remembered on Wall Street. Then they were popularized by Hamilton Bolton in 1950-1960, publishing a book with a detailed description and practice of use.
Certainly, Robert Prechter also has done the most job here. It was thanks to him, that Elliott waves became universally popular, almost 50 years after the accountant Elliott wrote a book on them. Many technical systems have a similar fate. They are forgotten, the authors are not appreciated during their lifetime, and then suddenly they become popular when they are promoted by a fanatical follower. Preckter is still considered the main expert on Elliott waves, and his site elliottwave.com is the world's main resource on the subject. There are a lot of cool forecasts there, for example, Prekter's experts predicted the 2008 crisis several years before it occurred. In fact, the modern Elliott is Prechter and his school.
Elliott Waves, in their essence, have a fractal basis, and the goal of practice is to break down the waves into understandable elements. It is them that we will try to explore now.
Fractals or Impulse Waves ✳️
The basic principle of Elliott Waves is that any wave consists of 2 parts; impulse and correction. Each of them, in turn, is made up of several elements, which also resemble waves, only smaller in size. Such a property, when a part resembles the whole object as a whole, is called fractality. For example, the ocean is made up of countless drops, and yet each drop is a "mini-ocean" because it repeats its properties and composition. Similarly, all living organisms are made up of cells.
The concept is based on the Elliott Wave Law, according to which market movement can be described by a simple and visual model as shown above. It reflects the main principle of market behavior: the price does not move in a straight line, but in a wave-like manner. An asset starts moving (for example, price growth), after which a correction (downward pullback) is observed. Any wave consists of 2 parts:
Correction is a pullback in the opposite direction. Each wave has an amplitude (difference between the 2 most distant points - upper and lower). At the same time, the impulse amplitude is always larger than the correction amplitude. To put it simply, the impulse is the main movement, while the correction is only a pullback in the opposite direction, which is always smaller in amplitude. That is why it is easy to distinguish them visually.
Both parts make up a cycle, after completion of which the market can go sideways (flat) or go in the opposite direction. The ability to see an organized wave in the "disorderly" movement of the chart allows us to correctly determine the current location and make a correct forecast for the near future. After the correction is over, we can re-enter the market (BUY trade) and profit again on the price increase. Since each moving wave is accompanied by a pullback in the opposite direction, the concept is sometimes also called the Elliott Wave Correction Theory.
Correction ✳️
The Elliott Wave Correction Theory predicts the end of the impulse after the formation of the last (fifth) wave. And after that there are 3 possible alternatives. The trend is reversed (a new fifth wave will follow). There comes a moment of uncertainty in the market, when the price will move in a narrow corridor for a long time (flat). The trend is maintained, but a short-term pullback occurs. This is a smaller in amplitude wave, consisting of 3 sections (so it is also called a triple). Elliott labeled each of them with the letters A, B and C: The A and B-C sections show a counter-trend correction as shown above.
Now, if we combine all the elements into one picture, we can make a simplified wave analysis on the example of an uptrend. So we can see 2 large sections the impulse 1-5 and the correction A-C. The five consists of 5 sections with 3 trend movements and 2 small pullbacks. A 3 consists of 3 plots with 1 trend movement and 2 pullbacks.
Example of Impulse and Correction ✳️

Smart Money Liquidity Grab Or Shift In Market Structure?Look at the Us30, and GBPUSD charts attached to this post, what do you see????
OANDA:GBPUSD
OANDA:US30USD
GBPUSD
Do you see a shift in market structure or Liquidity grab by smart money algorithm?
In financial market trading, one key to determine where the liquidity that the market will run next is located is to ask yourself who are those making money from the current move....
Where are they likely to trail their stops to.
Whatever your answer is, that is the liquidity the algorithm will most likely run first to continue in the intended direction...
In the charts examples attached to this post, market was bullish, then the smart money algorithm drive price lower to break the recent and obvious recent swing low to take out all the sell stops below that low, and induce new traders to go short thinking that the market is now bearish.
But price rebalance in imbalance below the lows and then push higher.
That is a smart money liquidity grab not shift in market structure.
With this understanding, you should now be able to understand that not all structure shift in a bullish or bearish market is a shift in market structure.
The majority are liquidity grabs by smart money algorithm.
Like my idea? Give a like to this post and drop your comment.
For more updates, give me a follow, you can also Dm for further enquiries.

Shift In Market Structure Or Liquidity Grab By Smart Money????Look at the Us30, GBPUSD and EURUSD charts attached to this post, what do you see????
GBPUSD
Do you see a shift in market structure or Liquidity grab by smart money algorithm?
In financial market trading, one key to determine where the liquidity that the market will run next is located is to ask yourself who are those making money from the current move....
Where are they likely to trail their stops to.
Whatever your answer is, that is the liquidity the algorithm will most likely run first to continue in the intended direction...
With this understanding, you should now be able to understand that not all structure shift in a bullish or bearish market is a shift in market structure.
The majority are liquidity grabs by smart money algorithm.
US30

WHAT IS IMBALANCE AND HOW TO USE IT?Imbalance is a market phenomenon that can lead a trader to significant profits or losses. Imbalance (IMB) is a gap in fair value during moments of inefficient pricing. The trading volume is tilted towards the bid or ask side, but too quickly, so there are still unexecuted orders in the market.
Simply put, imbalance occurs when there are many orders of the same type (buy, sell, limit) and a lack of liquidity (counter orders) in the market. For example, if there are many more buyers of a currency or stock than sellers, the balance tilts in favor of buyers. On the chart, imbalance looks like a price gap, within which only a part of the volume has been traded. The flow of new orders can be seen by the directional movement of long candles of the same color.
Imbalance is indicated on a long candlestick as a gap between the wicks of neighboring candlesticks. Very often the gap occurs on the candlestick pattern "Marubozu" candlestick with a long body, without shadows or with short wicks.
The IMB gap between the wicks of neighboring candles acts as a price magnet. It means that as liquidity fills, the price will close the imbalance. The speed of gap filling depends on the market makers, large traders and market factors. Market makers are organizations that maintain market liquidity by buying and selling currencies, securities.
There is partial and full IMB fill in the market. A partial fill of up to 50% means that interested bidders were unable to push the price to fill.
Full IMB fill is a rebalancing to 100%. Full filling indicates that buyers and sellers are ready to trade actively at an effective price.
✴️ Why do market imbalances occur?
The emergence of persistent imbalances after long periods of stable pricing in one direction indicates that institutions are accumulating a position. These institutions can be funds, banks and other financial institutions (so-called "smart money").
The market is influenced not only by institutions, but also by market makers, investors, and traders with large capitals. For example, market makers place many orders and then modify or cancel them to bring the market back to equilibrium. Market makers, smart money and investors can both oppose each other and act in the same direction.
Imbalance in Forex can occur after the release of economic and geopolitical news. Imbalances are seen when some countries run surpluses in their trade accounts while others run large external deficits. Imbalance in a security's exchange rate usually follows a dramatic event or publication. The news changes the market perception of the stock and causes a shift in the equilibrium price. This can be news affecting a single company or the economy as a whole.
• Publication of financial statements. For example, a positive quarterly report can lead to an imbalance toward buyers.
• Corporate announcements of bankruptcy, management changes, takeovers, business purchases, etc.
• Government and regulatory actions. U.S. Federal Reserve rate hike contributes to the fall of indices and securities.
• Geopolitical problems, natural disasters, etc.
As the price moves from the old equilibrium level to the new equilibrium level, order imbalances can occur.
✴️ How to use imbalance to make trading decisions?
Imbalance is a type of trading opportunity for intraday and swing traders. In trading, Imbalance is used to identify zones of interest. The zone from which the imbalance originated is characterized by a higher level of probability. The zone is suitable for analyzing and identifying entry points. Entry points are selected with the help of technical analysis within the selected trading methodology. In this case IMB acts as an additional factor.
Most imbalances represent price inefficiencies. Therefore, there is a high probability that the market will come back to fill the IMB. For example, if a large bidder manipulated the market, a correction occurs afterward. Typically, price tends to mitigate the imbalance or the area from which it originated. Therefore, traders trade in the direction of the imbalance to profit from the price movement. However, sometimes price continues to push back against IMBs that are forming in the market. Here recent example of using imbalance on EURUSD
✴️ Conclusion
Imbalances create "fuel" for trend price movement. However, you should not mindlessly enter a trade in any imbalance zone. It is necessary to monitor the context (economic news, indicators, patterns) and make decisions based on it.

📈 Unleash the Power of the Node Squeeze IndicatorThe Node Squeeze Indicator is a robust tool designed to help traders identify significant market moves in advance. By leveraging a combination of Bollinger Bands, Keltner Channels, and the Squeeze Momentum Indicator (SMI), this indicator effectively highlights periods of low volatility followed by high volatility expansion. In this post, we'll explore the key features of the Node Squeeze Indicator and how it can enhance your trading decisions across various styles and timeframes. #TradingView #NodeSqueezeIndicator #MarketInsights
Identifying Low Volatility and Anticipating Breakouts:
During the consolidation phase, the Node Squeeze Indicator plots a narrow band, indicating reduced price volatility. This period often acts as a precursor to a breakout or a major move in the market. By recognizing these moments of low volatility, traders can position themselves ahead of the crowd and anticipate potential explosive price action. 💥📉📈 #Volatility #Breakouts
Versatility and Customization:
One of the strengths of the Node Squeeze Indicator lies in its versatility and customizable parameters. Traders can tailor the indicator's settings to suit their preferred analysis approach and trading style. Whether you're a swing trader, day trader, or long-term investor, the Node Squeeze Indicator can adapt to your needs and provide valuable insights into market turning points and potential trend reversals. 🔄✏️ #Customization #TradingStyles
Enhancing Trading Decisions:
With its clear visual cues and combination of powerful indicators, the Node Squeeze Indicator equips traders with a comprehensive tool for making informed trading decisions. By using this indicator alongside other technical analysis techniques, you can validate signals and improve the accuracy of your predictions. However, it's important to remember that the Node Squeeze Indicator is not a standalone strategy or financial advice. 📊🔍✅ #TechnicalAnalysis #TradingDecisions
Risk Management and Analysis:
While the Node Squeeze Indicator can offer valuable insights, it's crucial to combine it with other indicators, analysis techniques, and risk management strategies. It's recommended to perform your own analysis and consider other factors, such as fundamental analysis, market sentiment, and economic news, to make well-rounded trading decisions. 📝💼🔒 #RiskManagement #Analysis
The Node Squeeze Indicator is a powerful tool that empowers traders to identify major market moves before they happen. By combining Bollinger Bands, Keltner Channels, and the Squeeze Momentum Indicator (SMI), it effectively highlights periods of low volatility and subsequent high volatility expansion. Regardless of your preferred trading style or timeframe, the Node Squeeze Indicator can enhance your trading decisions and improve overall performance. However, it should always be used in conjunction with other indicators and analysis techniques, and traders must exercise proper risk management. Unlock the power of the Node Squeeze Indicator and stay ahead of the markets with this comprehensive and intuitive trading tool. 🚀💪📈 #TradingTool #NodeSqueeze #MarketPerformance #TradingView

🛎Mastering Key Forex Fundamentals🛎
♦️Navigating the world of forex trading can be both thrilling and challenging. While it may seem overwhelming to keep track of all the complex factors that affect currency movements, some key fundamentals can significantly impact forex markets. In this article, we will discuss three essential forex fundamentals: non-farm payrolls, interest rates, and central bank policies, offering you a straightforward understanding of their significance and effects.
♦️Non-farm Payrolls:
One of the most influential economic indicators in forex trading is the non-farm payrolls (NFP) report. Published monthly by the U.S. Bureau of Labor Statistics, the NFP report reveals the number of jobs added or lost (excluding the farming sector) in the United States during the previous month.
▪️Why it matters:
The NFP report provides traders valuable insights into the strength of the U.S. economy. A higher-than-expected NFP figure indicates an expanding job market, economic growth, and potential currency strength. Conversely, if the NFP data disappoints, it suggests a weaker economy and can lead to currency depreciation.
♦️Interest Rates:
Interest rates play a crucial role in forex trading. They reflect the cost of borrowing in a particular country and influence investor behavior and currency values.
▪️Why it matters:
Changes in interest rates impact currency demand. When a central bank hikes interest rates, it attracts foreign investors seeking higher returns, leading to increased demand for the currency and potentially strengthening its value. Conversely, when rates are lowered, it may spur borrowing and economic growth, but can also result in currency devaluation due to decreased attractiveness for investors.
♦️Central Bank Policies:
Central banks are instrumental in forex markets due to the control they exert over monetary policies.
▪️Why it matters:
By adjusting interest rates, implementing quantitative easing measures, or intervening in currency markets, central banks can directly influence their nation's
currency value. Statements and speeches made by central bank officials can provide insight into their future monetary policy decisions, guiding forex traders' expectations.
♦️To master forex trading, a solid understanding of key fundamentals is essential. Factors such as non-farm payrolls, interest rates, and central bank policies carry significant weight and can lead to substantial currency movements. Familiarize yourself with economic indicators, monitor central bank actions and announcements, and always exercise caution and risk management when trading forex.
♦️Remember, successful trading requires continuous education, practice, and experience. Stay informed, adapt your strategies accordingly, and remain patient as you navigate the dynamic and exciting world of forex trading.
😸Thank you for reading buddy, hope you learned something new today😸
Do you like this post? Do you want more articles like that?

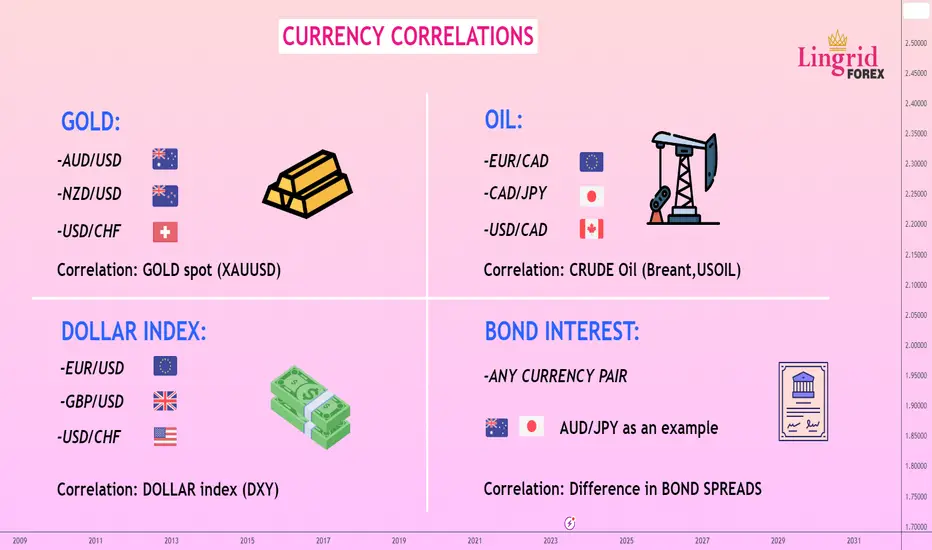
CURRENCY CORRELATIONSCorrelation is a popular method for using one asset as a beacon for predicting another. Virtually all assets are influenced in one way or another by commodities. You can see it yourself right now, when a stunning increase in the price of gold led to the growth of the AUD. Thereby demonstrating an almost 100% correlation between gold and the AUD.
Examples of Correlations ❇️
We'll look at some examples, which will help you better understand the influence of different assets on each other. Australia (AUD = Australian dollar) is the third largest gold producer in the world by volume. Australia sells several billion dollars’ worth of gold every year. As a result, gold and AUD/USD have a positive correlation. Gold appreciates, but the Australian dollar strengthens against the U.S. dollar. Gold falls, so does the AUD. According to statistics, the correlation between these two assets is over 80%.
Gold and AUD/USD
Let's talk now about the black gold a.k.a oil. This is nothing else than the blood of the economy, which flows through the veins of the world industry, being the main source of energy. One of the largest oil exporters in the world is Canada. Canada sells more than 4 million barrels per day only to the U.S. as its main supplier. As a result, if the U.S. increases its demand for Canadian oil, so does the demand for the Canadian dollar.
Canada is an export-oriented economy, where 85% of exports go to the US as a major trading partner. The USD/CAD is therefore entirely dependent on how consumers in the US respond to changes in oil prices. If the demand for goods in the U.S. rises, industrialists need more oil to ride on economic growth. If oil prices rise in the meantime, the USD/CAD exchange rate begins to fall (because the CAD is strengthening).
Conversely, if oil is not needed and the U.S. economy is slowing, demand for the CAD falls. In other words, oil has a negative correlation to USD/CAD, an appreciation of one asset causes the other asset to fall and vice versa.
UKOIL and USDCAD
Bond Spread ❇️
The bond spread is the difference between the interest rates on the bonds of two countries. It is on a similar spread that the carry trade strategy is based, which strongly influences many currencies. By tracking bond spreads and expectations of how key rates will change, you can get key fundamental signs that affect the exchange rate. As the interest spread between the currencies in a currency pair widens, the currency of the country that has the higher interest on government bonds strengthens against the one that has the lower interest.
BONDS and AUDJPY
The chart above on AUD/JPY shows us this perfectly. It shows the spread between 10-year U.S. and Australian government bonds from start of 2023. When the spread rose the AUD/JPY exchange rate rose nearly 12% from the low.
When the bond spread between Australian and Japanese bonds widens, institutional traders bet on the AUD/JPY going higher, why? Because that's how a carry trade works. But when the Reserve Bank of Australia began to increase key rates and the spread sharply widened, traders began to go "long" positions on AUD/JPY and the price, logically, began to rise.
Dollar Index ❇️
The dollar index gives a general idea about the strength or weakness of the dollar, for it can be regarded as a universal indicator. It's important to remember that the euro makes up more than 50% of the index, so EUR/USD is the main subject here. If you need to assess the dollar's condition in all dollar pairs the index is the best for that. How similar are they really? EURUSD up and DXY down. Many traders continually check the DXY, not only for its correlations but also for its divergence with the EUR/USD.
DXY and EURUSD
If the dollar is the base currency (first in a currency pair, say, USD/*), then the dollar index and the currency pair will go in the same direction;
If the dollar is the quoted currency (*/USD), then the index and the currency pair will go in different directions.
Correlation analysis is fascinating. Everything in the world is correlated, so currencies, various economic indicators, government bonds and commodities. The essence of bonds is simple: everyone needs money, the government constantly borrows against its securities, and the greater the demand for those securities, the more desirable the national currency. However, if this pattern shows a negative correlation, and the increased demand for bonds does not lead to an increase in the currency, then other factors come into play, such as the state of the global and national economies, the discrepancy in key rates between countries .
FIBONACCI CLUSTER IN TRADINGHello traders! Today, we'll look at the basic application of Fibonacci levels to build cluster. Even a new trader will be able to fully understand this approach because of how simple it is. We will discuss Fibonacci clusters, including their definition and trading implications. We'll make use of the common Fibonacci retracement tool which reactions frequently occur at 38.2%, 50%, 61.8%, or 78.6%.
✴️ Bottom line
A collection of Fibonacci lines that are relatively near to one another is referred to as a cluster. We compile all traders' estimates by drawing Fibonacci lines relative to various market swing highs and lows. As a result, the concentration of lines in one area indicates the most likely position of a key level or, more accurately, a critical zone.
✴️ What Is Fibonacci Confluence?
Fibonacci confluence is a method that uses Fibonacci retracement and extension levels to identify potential areas where the price may find support or resistance (Or entry and exit points). To use Fibonacci confluence, traders take Fibonacci retracement and extension levels from multiple time frames and look for areas where two or more Fibonacci levels line up, which is called “confluence”. Then we can look for trade setups in these converged levels like engulfing candle or pinbar.
✴️ Fibonacci Retracements Cluster
Fibonacci clusters can be an incredibly useful tool to identifying significant zones. Fibonacci clusters are a type of technical indicator that provides us with a way to identify potential support and resistance levels in the market. By applying these clusters, we can identify entry and exit points which can help them to maximize mathematical expectancy of the trades.
Once you understand how Fibonacci clusters work, you can then begin to apply them to your trading. The first step is to identify a chart with a clear trend. Look at the chart and identify the market structure. Next, draw a series of Fibonacci retracement levels on the chart. These levels will help you identify potential support and resistance levels in the market. Generally, we can look for entry signal at 38.2%, 50.0% and 61.8% levels. If the price rejects either of these lines, then it may be a sign that the price is about to move in that direction.
✴️ How to Apply Them in Trading
It is easier to trade levels if there is a clear unidirectional movement. This way we will know where the price is likely to go and we will be able to enter the "stream" at the most profitable opportunity. So, first of all, we determine the direction of the main trend. In this case, the AUD/JPY uptrend is obvious.
Next, we use fibo on the chart. Our task is to find the nearest strong support level and set a buy pending order slightly above it. That is, we assume that the correction will end near this level and the price will then continue its upward movement.
Stop loss is set slightly below the next Fibonacci cluster. This way we secure ourselves in case of incorrect forecasts. Take Profit is set equal to the stop or more.
There are situations when one supercluster is formed on the chart. In such case, if the price is above the cluster zone, we set an order to buy just above the strongest level. We place Stop Loss after the supercluster, through which the price will almost certainly not return. Take profit is equal to the stop or more.
✴️ A quick and efficient technique to use Fibonacci in trading is through clusters. The key benefit of the strategy is that the clusters speak for themselves; you don't need to know which Fibonacci level the price should rise from. Additionally, clusters can reveal entire zones of resistance and support, or zones of uncertainty, where it is better to avoid entering the market.

Making Sense of the Market (Educational Post) 📑3rd Week May 23'Hello Traders. Today I have created a summary of this previous week's price action on a Session-Session basis. I explain in detail each of the 15 Sessions and how they relate to the overarching destination for the weekly candle. I hope you enjoy and please leave some feedback in you found this either useful or interesting. Best, Shrewdcatfx 🐱👓
Key for Chart
1 = Asian Session
2 = London Session
3 = New York Session
Monday - Black Numbers
Tuesday - White Numbers
Wednesday - Purple Numbers
Thursday - Red Numbers
Friday - Blue Numbers
Important Level's
Weekly Level - 1.0866
Daily Level - 1.08739 ( Created after Tuesday's Daily Candle Closure)
Daily Level - 1.08532
Daily Level - 1.08401
Daily Level - 1.07597
15 Sessions Breakdown
Monday - ( Black Numbers )
1 First Asian session begins by going up and
rejecting (1.08537) Daily Level. Buyers are
stepping in early in the week and the new
weekly candle is pulling up.
2 The First London session of the week is a catalyst to create a Higher High in market structure on the Intraday timeframes. However with the new 4hr candle price pulls back down and drops before seeing once again another opportunity for Buys
3 The first New york session of the week combined with manufacturing data saw one more push to the upside which turned out to be the High of the day. As NY session progressed price pulled back and found support at the 1.0866 weekly level before bouncing once again.
Tuesday - ( White Numbers)
1- 2nd Asian session of the week price consolidates inside of the previous NY session range, not much occurs
2- London session pulls back and retests 1.0866 weekly level where price finds support once again
Price consequrntly bounces and creates a new weekly High above the Monday NY session manufacturing data highs.
This london session Bullish push turns out to be the high of the week
3- New York Session price eases off the high prices created during London session. Retail sales data is released and volatility
and volume shakes up price in the short term but continues to ease off the highs from london session. Price drops further adn london
close prints the low of the day. The daily candle closes below our 1.0866 weekly level
after attempting to push up with manufacturing data and retail sales data
Wednesday - (Purple Numbers) (The close of the Tuesday daily candle creates our 1.08754 Daily Level)
1. Asian Session - Pulls up to retest our new formed Daily level 1.08754.
As we move through Asian Open and the 4hr candle associated with it price appears
to be backing off and rejecting the new formed Daily level 1.08754.
2. At this point we have 2 Daily Candle closures above 1.08537 Daily Level, however as we move into the third
london session of the week price is beginning to crease below this daily level 1.08537. Price is also continuing to reject our
new formed 1.08754 Daily level from Asian session. Price effortlessly drops through 1.08537 and quickly reaches our next
potential support at Daily level 1.08393 . Price keeps pushing down and it is clear that the weekly candle has flipped bearish,
dropping below our Monday Asian session prices and creating a fresh low on the week.
3. NY session sees a short lived continuation but quickly reverses pulling back up and clearing out
fomo sellers . Price pulls back and does a textbook break and retest at the price where the weekly candle opened on Monday Asian
price consolidates at the break and retest area 1.085
Thursday - ( Red numbers)
1. Asian session completes the break and retest at 1.085 and prices begins to head back towards the low created during the previous NY session
2. London Open provides a catalyst for a continuation of momentum to the dowside as we head back towards the previous NY session Low.
We touch the NY session low and create a new low price on the week.
3. New York Session Open and Unemployment data is due to release. Yes, Unemployment data is the catalyst to punch out even more lows on the week
Price make a very nice and lenngthy push from here on this thursday.
Friday - (Blue Numbers)
1. The Thursday daily candle closes bearish but above our 1.07597 Daily Level.
Asian session attempts multiple times to keep dropping below 1.07597 but buyers hold firm here.
2. As the final London session of the week approaches prices begins to bounce off 1.07597 and
creates a High on Intraday timeframes. Then comes london open and price continues to pull back to the upside
Simultaneusly we can observe that as the weekly candle comes to a close, the candle is pulling back up and
creating a bottom wick.
3. New York Session provides a catalyst to continue pulling back up before violently whipsawing and ranging to end off the week

📉Mastering the Art of Control: Stop and Limit Orders Unveiled📈
📌In the thrilling world of forex trading, where fortunes rise and fall in the blink of an eye, having the ability to control your trades is paramount. Among the arsenal of tools at your disposal, stop and limit orders reign supreme. These magnificent creations empower traders to set their own boundaries and ensure that the roller coaster ride of forex trading remains under their command. So, buckle up and embark on this exciting journey of understanding stop and limit orders!
📌Understanding Stop Orders:
Stop orders are like steadfast guardians, appointed to protect your hard-earned profits or minimize potential losses. Imagine them as your personal bodyguards ready to leap into action at the first sign of trouble. When you place a stop order, you determine a specific price at which your trade should be closed automatically if the market moves against you. This mighty order helps you sidestep the risk of your entire trade being wiped out by sudden market swings or unexpected news events.
📌Shining a Light on Limit Orders:
Limit orders are akin to skillful negotiators, tirelessly working to secure the best possible price for your trades. Picture them as your savvy diplomats, taking charge of your trades and ensuring you reap maximum rewards. With a limit order, you specify a particular price at which you want to enter or exit the market. It’s like having an invisible hand that waits patiently until your desired price is met before executing your trade. This remarkable order empowers you to seize opportunities and helps lock in your well-deserved profits.
📌The Dance of Stop and Limit Orders:
Now that we understand each order's unique strengths, let's witness the masterful coordination between stop and limit orders, as they work together seamlessly to protect and maximize your forex trading outcomes. By using stop and limit orders in tandem, you can create a framework that balances risk and reward, empowering you to navigate the treacherous waters of the forex market.
📌Example Scenario:
Imagine you're trading EUR/USD, and you've just entered a long position at 1.2000. You're optimistic about the pair's potential, but you don't want your gains to vanish overnight. In this case, you place a stop order at 1.1950. This ensures that if the market takes a nosedive and reaches 1.1950, your trade will be automatically closed, safeguarding your hard-earned capital.
Simultaneously, you set a limit order at 1.2100, securing your target profit level. It's like having a guardian angel watching over your trade, ensuring that once your desired profit is reached, your trade is closed automatically, guaranteeing you a win.
📌Conclusion:
Stop and limit orders are the under-appreciated heroes of forex trading, granting you the power to control and protect your trades. With stop orders acting as your shield and limit orders as your sword, you can set your boundaries and seize opportunities with confidence. Harnessing the potential of these remarkable orders will elevate your trading game by ensuring you stay in charge, even when the markets are at their most unpredictable. So go forth, brave traders, and let your stop and limit orders pave the way to victory in the thrilling realm of forex trading!
I hope this post was helpful to some of our beginner traders😊
Dear followers, let me know, what topic interests you for new educational posts?

✅The DO’S And DON’TS Of Risk Management❌
❤️Risk management is a crucial component of forex trading to help minimize potential losses. In this article, we’ll explore the do’s and don’ts of risk management in forex trading.
🧡DO’S
💁🏼♀️Set a stop-loss order: A stop-loss order is a pre-set level at which a trade will automatically close, thus limiting the loss on an open position.
💁🏼♀️Diversify your portfolio: Spread your investments across multiple currency pairs to avoid exposure to a single currency’s risks.
💁🏼♀️Use leverage wisely: Leverage allows traders to invest more than their account balance. However, it also increases the potential risk. Only trade with leverage if you fully understand how it works.
💁🏼♀️Keep an eye on economic events: Economic events can impact forex markets. Keeping a close eye on them can help you adjust your trading strategy accordingly and avoid unexpected losses.
💁🏼♀️Use risk-reward ratio: It is essential to have a clear risk-reward ratio in mind before entering a trade. This ratio should be based on your established trading strategy and the probability of success.
💙DON’TS
🙅🏼♀️Don’t invest more than you can afford to lose: This is a fundamental rule of investing in any financial market. Never invest more than you can afford to lose.
🙅🏼♀️Don’t let emotions drive your trading: Emotions such as fear, greed, and hope can lead to impulsive decisions and cause significant losses.
🙅🏼♀️Don’t ignore fundamental analysis: Fundamental analysis helps traders understand a country’s economic and political situation, which can significantly impact forex markets.
🙅🏼♀️Don’t follow the herd: It is essential to have your own trading strategy and stick to it. Following others' trades blindly can lead to significant losses.
🙅🏼♀️Don’t trade without a strategy: A trading strategy helps you make informed decisions and minimize the risks of trading. Not having a strategy can lead to impulsive decisions and significant losses.
🖤 In conclusion , risk management is a crucial component of forex trading. It is essential to follow the do’s and don’ts mentioned above to minimize potential losses and make informed decisions. Remember, successful trading comes with experience, discipline, and patience. Happy trading!
Please cheer me up with a like and a nice comment😸❤️
Please, support my work with like and comment!
Love you, my dear followers!👩💻🌸

Stock Heatmap: The Ultimate Guide for Beginners (2023)How to use the Stock Heatmap on TradingView to find new investment opportunities across global equity markets including US stocks, European stocks, and more.
Step 1 - Open the Stock Heatmap
Click on the "Products" section, located at the top center when you open the platform. Then click on "Screeners" and “Stock” under the Heatmap section. Members who use the TradingView app on PC or Mac can also click on the "+" symbol at the top of the screen and then on "Heatmap - stocks".
Step 2 - Create a Heatmap with specific stocks
Once the Heatmap is open, you have the capabilities to create a Heatmap based on a number of different global equity markets including S&P 500, Nasdaq 100, European Union stocks, and more. To load these indices, you must click on the name of the current selected index, located at the top left corner of the screen. In this example, we have the S&P 500 heatmap loaded, but you can load any index of your choice by opening the search menu and looking for the index of your choice.
Step 3 - Customize the Stock Heatmap
Traders can configure their Heatmap to create highly custom visualizations that’ll help discover new stocks, insights, and data. In this section, we’ll show you how to do that. Keep on reading!
The SIZE BY: Button changes the way companies are sized on the chart. If we click on "Market Cap" in the top left corner of the Heatmap, we can see the different ways to configure the heatmap and how the stocks are sized. By default, "Market Cap" is selected with the companies, which means a company with a larger market capitalization will appear bigger than companies with smaller market capitalizations. Let’s look into the other options available!
Number of employees: It measures the size of the squares based on the number of employees in the company. The larger the square size, the more employees it has relative to the rest of the companies. For example, in the S&P 500, Walmart has the largest size with 2.3 million employees. If we compare it to McDonalds, which has 200,000 employees, we can see that Walmart's square size is 11 times larger than McDonalds. This data is usually updated on an annual basis.
Dividend Yield, %: If you choose this option, you will have the size of the squares arranged according to the annual percentage dividend offered by the companies. The higher the dividend, the larger the size of the square. It is important to note that companies with no dividend will not appear in the heatmap when you have chosen to arrange the size by Dividend Yield, %.
Price to earnings ratio (P/E): It is a calculation that divides the share price with the net profit divided by the number of shares of the company. Normally the P/E of a company is compared with others in its own sector, i.e. its competitors, and is used to find undervalued investment opportunities or, on the contrary, to see companies that are overvalued in the market. Oftentimes a high P/E ratios indicate that the market reflects good future expectations for these companies and, conversely, low P/E ratios indicate low growth expectations. Going back to heatmaps, it will give a larger square size to those companies with higher P/E ratio over the last 12 months. Companies that are in losses will not appear in the heatmap as they have an undetermined P/E.
Price to sale ratio: The P/S compares the price of a company's shares with its revenue. It is an indicator of the value that the financial markets have placed on a company's earnings. It is calculated by dividing the share price by sales per share. A low ratio usually indicates that the company is undervalued, while a high ratio indicates that it is overvalued. This indicator is compared, like the P/E ratio, to companies in the same sector and is also measured over the most recent fiscal year. A high P/S indicates higher earnings expectations for the company and therefore could also be considered overvalued, and vice versa, companies with a lower P/S than their competitors could be considered undervalued.
Price to book ratio: The P/B value measures the stock price divided by the book value of its assets, although it does not count elements such as intellectual property, brand value or patents. A value of 1 indicates that the share price is in line with the value of the company. High values indicate an overvaluation of the company and below, oversold. Again, as in the P/E and P/S Ratio, it is recommended to compare them with companies of the same sector. Regarding the heatmaps, organizing the size of the squares by P/B gives greater size to companies with high values and it is measured by the most recent fiscal year.
Volume (1h, 4h, D, S, M): This measures the number of shares traded according to the chosen time interval. Within the heatmaps comes by default the daily volume, but you can choose another one depending on whether your strategy is intraday, swing trading or long term. It is important to note that companies with a large number of shares outstanding will get a higher trading volume on a regular basis.
Volume*Price (1h, 4h, D, S, M): Volume by price adjusts the volume to the share price, i.e. multiplying its volume by the current share price. It is a more reliable indicator than volume as some small-cap stocks or penny stocks with a large number of shares would not appear in the list among those with the highest traded volume. Also available in 1-hour, 4-hour, daily, weekly and monthly time intervals.
COLOR BY:
In this area we will be able to configure how individual stocks are colored on the Heatmap. If you’re wondering why some stocks are more red or green than others, don’t fret, as we’ll show you how it works. For example, click on the top left of the Heatmap where it says "Performance D, %" and you’ll see the following options:
Performance 1h/4h/D/S/M/3M/6M/YTD/Year (Y), %: This option is the most commonly used, where we choose the intensity of the colors based on the performance change per hour, 4 hours, daily, weekly, monthly, in 3 or 6 months, in the current year, and in the last 12 months (Y). Tip: this feature works in unison with the heat multiplier located at the top right of the Heatmap. By default, x1 comes with 3 intensity levels for both stocks in positive and negative, as well as one in gray for stocks that do not show a significant change in price. This takes as a reference values below -3%/-2%/-1% for stocks in negative or above +1%/+2%/+3% for stocks in positive and each of the levels can be turned on or off independently.
As for how to configure this parameter, you can use the following settings according to the chosen intervals. For 1h/4h intervals, multipliers of: x0.1/x0.2/x0.25/x0.5 are recommended.
For daily heat maps, the default multiplier would be x1. And finally, for weekly, monthly, 3 or 6 months and yearly intervals, it is recommended to increase the multiplier to x2/x3/x5/x10.
Pre-market/post-market change, %: When this option is selected, you can monitor the changes before the market opens and the after hours trading (this feature is not available in all countries). For example, if we select the Nasdaq 100 pre-market session change, we will see the day's movements between 4 a.m. and 9:30 a.m. (EST time zone). Or, if we prefer to analyze the Nasdaq 100 post-market, we will have to choose that option; this would cover the 4 p.m. to 8 p.m. time zone. For heatmaps in after-hours trading we recommend using very low heat multipliers (x0.1; x0.2; x0.25; x0.5).
Relative volume: This indicator measures the current trading volume compared to the trading volume in the past during a given period and it measures the level of activity of a stock. When a stock is traded more than usual, its relative volume increases. Consequently, liquidity increases, spreads are usually reduced, there are usually levels where buyers and sellers are fighting intensely and where an important trend can occur. The possible strategies are diverse. There are traders who prefer to enter the stock at very high relative volume peaks, and others who prefer to enter at low peaks, where movements tend to be less parabolic in the short term. In the stock heatmap, relative volume is identified in blue colors. Heat multipliers of x1, x2 or x3 are usually the most common for analyzing the relative volume of stocks. Let's do an example: Imagine that we want to see the most unusual movements in today's Nasdaq 100 after the market close. We select the color by Relative Volume and apply a default heat multiplier of x1. Then, in order to be able to see only those stocks that stand out the most, we uncheck the numbers 0; 0.5; 1 at the top right of the screen. After this, we will have reduced the number of stocks to a smaller group, where we will be able to see chart by chart what has happened in them and if there is an interesting opportunity for trading.
Volatility D, %: It measures the amount of uncertainty, risk and fluctuation of changes during the day, i.e., the frequency and intensity with which the price of an asset changes. A stock is usually referred to as volatile when it represents a very high volatility compared to the rest of the chosen index. Volatility is usually synonymous with risk, since the price fluctuation is greater. For example, we want to invest in a stock with dividends on the US market, but we are somewhat averse to risk. To do so, we decide to look for a stock with a high dividend yield with low volatility. We select the index source "S&P 500 Index", then size by "Dividend yield, %" and color by "Volatility D, %". Now, we deactivate the heat intensity levels higher than 2%, but higher than 0% (those that do not suffer movement, usually have low liquidity). From the list obtained, we would analyze the charts of the 10 companies that offer us the best dividend.
Gap, %: This option measures the percentage gap between the previous day's closing candle and the current day's opening candle, i.e. the difference in percentage from when the market closes to when it opens again.
GROUP BY:
Here you can enable or disable the group mode. By default all stocks are grouped by sector, but if you select ‘No group’, you will see the whole list of companies in the selected index as if it were a single sector. It is ideal for viewing opportunities at a general level, you can sort directly by dividend percentage and see the companies in the index with the best dividend from highest to lowest or, for example, the best yielding stocks by market capitalization size.
Another important note is that when you have chosen to group stocks by sector, you can zoom in on a specific sector by clicking on the sector name. Doing so, you will be able to analyze the assets of that sector in more depth.
TOGGLE MONO SIZE:
Here you can split all the stocks in the selected index completely equally in size, while still respecting the order of the chosen configuration. That is, if we have toggled the mono size by market cap, all the stocks will have the same square size with the first ones being the ones with the largest capitalization, from largest to smallest.
FILTERS:
One of the most interesting settings, where it allows you to filter certain data to eliminate "noise" and have a selection of interesting stocks according to the chosen criteria. It is important to note that in filters we can see in each of the parameters where most of the stocks are located by vertical lines of blue color. It is especially useful in indexes where all stocks of a certain country are included, for example, the index of all US companies. Making a good filter will help you find companies in a heatmap with very specific criteria. The parameters are the same as those found in the SIZE BY section, i.e. market cap, number of employees, dividend yield, price to earnings ratio, price to sales ratio, price to book ratio, and volume (1h/4h/D/W/M).
Primary listing: When you work on an index with stocks that may be, for example, from another country or not traded within the main market, they will be categorized outside the primary listing.
STYLE SETTINGS:
Here you can change the content of the inner part of the heatmap squares:
Title: The company symbol or ticker (e.g., AAPL - Apple Inc.).
Logo: The company logo.
First value: Shows you the value you have chosen in the COLOR BY section (performance 1h/4h/D/S/3M/6M/YTD/Y, pre-market and post-market change, relative volume, volatility D, and gap).
Second value: You can choose between the current price of the asset or its market cap.
These values are also available when you hover your mouse over one of the stocks and hold it over its square for a few seconds.
SHARE:
On TradingView, we can easily share our trading analysis and our heatmaps! You can download your Heatmap as images or you can copy the link to share it across social networks like Facebook,Twitter, and more.
If you made it this far, thanks for reading! We look forward to seeing how you master the Heatmap and all it has to offer. We also want to hear your feedback!
Leave us your comments below! 👇
- TradingView Team

How to Trade Wolfe Wave PatternI will try to explain to you about the Wolf pattern. I myself prefer to call this formation a Wolf pattern rather than a wave, because it will not always remind of a wave and has nothing to do with the Elliott Wave Analysis.
Before I get to the practical part, I want to note that this pattern is very easy to learn and often allows you to get a fantastic ratio (R:R). The flip side of the pattern is the art of determining its completion.
Bill Wolf is the discoverer of this formation. He likes to call his trading a wave trading and for some reason explains the work of the pattern as a demonstration of Newton's law. His real achievement is the numerous study of the well-known wedge pattern, which he was so fond of, and the finding of patterns in it.
All we have from the author is a little book. And the website wolfewave.com, the design of which has been preserved since '98. Bill's friendship with trader Linda Raschke is well known. In her book, Linda describes the Wolf wave as a quite profitable formation.
It should be noted that especially skillful traders can detect Wolf waves practically in all price movements. Indeed, this characteristic formation of "spreading" can be found constantly, even if it does not have all the expressed qualities that are characteristic of an ideal wave. In traditional trading, the Wolf will often look like the famous and beloved wedge, but our task will be to enter and exit the trade more precisely.
Formation
1. We determine point 2 as the top of the uptrend (a significant top).
2. Point 3 is the next minimum after point 2.
3. Point 4 is the next high after point 3 and is located below point 2.
4. Point 1 is insignificant, ideally it is the minimum before point 2, but sometimes point 1 is very weakly expressed. In this case, Bill Wolf himself recommends to draw a horizontal line to the left of point 3 and take the first bar opposite it as point 1.
5. The point 5 is on the line 1-3, or it often breaks through it, going to the sweet zone. The sweet zone is constructed by parallel transferring the line 2-4 to point 3.
6. Point 6 (target) is on the line 1-4 (EPA - Estimate Price at Arrival) and is determined by the vertical from the point of intersection 2-4 and 1-3 (ETA - Estimate Time on Arrival).
How to Trade the Wolf with Trend
For the purposes of this article, we will be looking at Wolf waves primarily on trend. I strongly recommend trading them this way. In this way, the pattern will be a correction, the end of which we are trading. In addition, a couple of alternative examples will be given (Wolf as a trend reversal, Wolf in a sideways trend).
Let's take a good trend, in this case the uptrend on CADJPY, and highlight the correction. Then let's move to H1 and see if there are any Wolf waves among these corrections:
Example 1
In the first case we have a great Wolf wave. I pay attention to the clear arrival time of the target (ETA). R:R = 3.0.
Example 2.
In the second case, we don't have the prettiest formation. Many would argue that it is a Wolf wave, but I assure you that it is.
The ETA also clearly worked and we got R:R = 3.5.
Note
Wolf waves are quite frequent formation. Their best working out is trend trading, there are plenty of them. Even more of them are in the sideways. It can be said that a sidewall is a constant succession of Woolf waves in different directions. Perhaps, someone may apply this style to a flat, but a sideways trend can be traded more traditionally. An ideal wave is not always found. There are traders who prefer to wait for them without considering other Woolf waves as such.
Practice
Perhaps, we have come to the most interesting part of the article. Here I will just try to outline the best possible way to enter a trade and the best way to get out of it. The advice given in this section is a subjective result of trading and is provided for general guidance. I am convinced that a practicing trader will find the optimal TS settings by himself.
Examples
Any TS has its disadvantages and if the speculator gets along with them, he makes the TS "his", otherwise he has to look for another instrument, picking it up like a puzzle that suits him psychologically. The problem of the Wolf wave, on the other hand, is the search for the point 5.
Recent example
We use Fibonacci extension tool to identify optimal entry point. Fibonacci extension level such as 1.13, 1.272, 1.141 and 1.618.
Conclusion
In this article I have tried to set forth my view of the Wolf wave. As I see it, this pattern is well underestimated by the mass of suffering traders.

Key Supports and Resistance Levels of BTC/USDGood Afternoon traders.
As many of you already know, Bitcoin has been rising rapidly throughout Q2 2023. The point of this post is to entice those who don't to look at the bigger picture. Perspective is everything, and whether you're trading crypto spot or futures, stock or derivatives, be sure to identify key support and resistance trading channels to look for breakouts.
A breakout above the key resistance channel trending along
I drew my first trendline (support) on the bottom of the chart from the lowermost point on an hourly chart starting at the bottom of the candle of Thursday June 22nd at 10am and ending with a second point on Wednesday June 28th at 3pm, extended right, creating a trendline among the bottom channel.
I drew my second trendine (resistance) on the uppermost point of the candle of Friday June 23rd at 12:00pm, to the uppermost point of Tuesday June 27th at 10am, extending right, creating a trendline among the top channel.
You can expect BTC to trade within the trends, and look for major moves for when it breaks out. Being able to identify trends and chart channels should be a practice in every trader's knowledge inventory, and applied throughout their trading career on most charts, if not all.
*Remember to always apply alarms to these critical lines of support and resistance to help you identify breakouts.*
Thanks for reading, and happy trading / success!

Sideways Trend Example:
❗️Unleashing the Secrets of the Forex Market: Identifying Trends Made Easy❗️
💲As traders, one of the most essential skills is the ability to identify trends. In this article, we will embark on a journey to unravel the mysteries of the forex market trends like never before. So, fasten your seatbelts, get ready for an adventure, and let's dive in!
↗️The Smooth Sailing - Uptrends:
Picture yourself in a sailboat on a calm, sunny day, with the wind gently pushing you forward. This pleasant scenario beautifully represents an uptrend in the forex market. Uptrends occur when the price of a currency pair consistently increases over time. To identify an uptrend, keep an eye out for higher highs and higher lows on your price charts.
Uptrend Example:
↘️Rough Waters - Downtrends:
Now, let's transform our tranquil sailboat into a powerful vessel battling against fierce waves and gusty winds. Similar to this scenario, a downtrend indicates a series of declining prices in the forex market. To recognize a downtrend, look for lower lows and lower highs on your price charts.
Downtrend Example:
🔄The Eye of the Storm - Sideways Trends:
Imagine yourself caught in the eye of a storm, where the winds calm down, and the waves become gentle ripples. This serene moment perfectly mimics a sideways trend in the forex market. Sideways trends occur when the price moves within a relatively tight range, lacking a clear direction. To spot a sideways trend, locate horizontal support and resistance levels, and observe price movements bouncing between them.
Sideways Trend Example:
📊Interpreting the Elements - Indicators:
Just as sailors use compasses and maps to navigate the open seas, traders have powerful tools at their disposal to identify trends in the forex market. Technical indicators, such as Moving Averages, MACD, and RSI, provide valuable insights by analyzing past price data. These indicators can help confirm and strengthen your trend analysis.
📈The Art of Patience - Confirming Trends:
Sometimes, identifying trends in the forex market can feel like searching for a needle in a haystack. Therefore, it is crucial to exercise patience before jumping into trades. Waiting for confirmation is vital to avoid false signals. Look for multiple indicators aligning with your identified trend before making any decisions.
💹Riding the Waves - Trend Trading Strategies:
Once you've identified a trend in the forex market, it's time to ride the waves and potentially profit from it. Trend trading strategies involve jumping on board during an established trend and holding positions until signs of a reversal appear. By keeping emotions in check and adhering to risk management principles, you can increase your chances of success in trend trading.
🧠Conclusion:
Navigating the vast and ever-changing forex market can seem like an exhilarating adventure. By mastering the art of trend identification, you hold the key to unlocking potential profits. Remember, whether you're sailing through uptrends, weathering downtrends, or calmly cruising sideways trends, a combination of technical indicators, confirmation, and patience should guide your decision-making. So embrace the wonder of the forex market, and may your trend-spotting skills be forever sharp!
😸Thank you for reading buddy, hope you learned something new today😸
Do you like this post? Do you want more articles like that?

How I trade the candles. $XOM exampleHow I trade the candles. There is more not mentioned in the video but for the most part these are the basic steps I take 1st before diving into look for more confluences to help me decide during a trade.

TREND CONTINUATION PATTERNSChart pattern construction is an important part of any market analysis. Charting patterns are powerful indicators of potential market movements. These patterns appear on a chart and are used to predict when a trend is likely to continue or reverse. The three most common patterns are triangles, wedges, and flags. They are all typically seen as signs of a trend continuing, but their specific meaning varies depending on the trend they are associated with. For example, a triangle can signal a continuation of a trend, while a flag can signal a potential reversal.
✴️ Triangles
Triangles are formed when two trend lines converge, forming a pattern that resembles a triangle. These can be either symmetrical or asymmetrical, and are usually seen as a sign of a bullish or bearish trend continuing. Symmetrical triangles can be seen as a sign of consolidation before a breakout in either direction. Asymmetrical triangles are usually seen as a sign of a continuation of the existing trend.
✴️ How to trade triangles
Trading triangles can be a very profitable endeavor, but it can also be risky. There are three main types of triangles: ascending, descending, and symmetrical. Ascending and descending triangles are bullish or bearish, while symmetrical triangles can be bullish or bearish, depending on the trend.
Once you have identified a triangle pattern, you need to wait for a breakout. A breakout is when the price breaks out of the triangle pattern and continues in the direction of the trend. When trading triangles, it is important to wait for a confirmed breakout. A confirmed breakout is when there is a clear break of the triangle pattern and the price has moved in the desired direction.
There are a number of different signals you can look for to help you determine when a breakout is happening. These include candlestick patterns, moving averages, and volume.
✴️ Wedges
Wedges are similar to triangles in that they are formed by two converging trend lines. However, the difference is that wedges form a pattern that resembles a wedge shape. Wedges can be either rising or falling, and are usually seen as a sign of continuation for the existing trend. Rising wedges are generally seen as bearish, while falling wedges are seen as bullish. Wedges can be a useful signal if used correctly, but they are not always clear-cut. It is important to understand whether a wedge is rising or falling, and whether it is being viewed as bearish or bullish, in order to get the most out of this pattern.
✴️ How to Trade wedges
When trading wedges in the forex market, there are two main approaches – the breakout approach and the reversal approach.
The breakout approach involves trading the breakout of a falling wedge pattern. This type of pattern is typically seen during an uptrend and is seen as a potential sign of a reversal. When trading a falling wedge, traders will look for prices to break out of the wedge by either going above the resistance trend line or below the support trend line. If prices break out above the resistance trend line, it is seen as a sign that the uptrend will continue and traders can look to buy. On the other hand, if prices break out below the support trend line, it is seen as a sign that the uptrend is over and traders can look to sell.
The reversal approach involves trading the reversal of a rising wedge pattern. This type of pattern is typically seen during a downtrend and is seen as a potential sign of a reversal. When trading a rising wedge, traders will look for prices to break out of the wedge by either going above the resistance trend line or below the support trend line. If prices break out above the resistance trend line, it is seen as a sign that the downtrend is over and traders can look to buy. On the other hand, if prices break out below the support trend line, it is seen as a sign that the downtrend will continue and traders can look to sell.
✴️ Flags
Flags are formed when two parallel trend lines form a pattern that resembles a flag. They are usually seen as a sign of a continuation of the existing trend, although they can also signal a reversal. Bullish flags are typically seen as a sign that the trend will continue higher, while bearish flags are seen as a sign that the trend will continue lower.
In light of the recent market volatility, it is important to remember that chart continuation patterns such as triangles, wedges and flags can be a powerful tool for predicting potential market movements. They are usually seen as a sign of a trend continuing, although their individual meaning can depend on the trend they are associated with. As such, it is important to be familiar with these patterns to be able to accurately predict potential market movements.
✴️ How to trade flags
When looking for a flag pattern to trade, you should be on the lookout for two distinct highs or lows that form a trend line. The trend line should then be connected to a parallel line that is a few pips below the lower peak. If you identify a valid flag pattern, then you can move on to the next step. Once you have identified a valid flag pattern, you should then calculate your risk and reward. Your stop loss should be placed just below the lower parallel line of the flag pattern, and your target price should be placed at the upper parallel line.
Good luck, and happy trading!
