Emirates REIT Bullish DivergenceEmirates REIT is bouncing off from a 2H demand zone and broke the downward trendline, with Bullish RSI Divergence.
The stock had a sharp correction >30% and likely to start a new impulsive wave.
Good time to enter the market or add to your position.
Entry: 0.434
TP : 0.577 (4:1 RRR)
SL: 0.396
Trade Safe!!
Uaestockmarket

SALIK (DFM) BOS confirmed the bulls are back in charge### 🌀 **Elliott Wave Structure**
* The stock completed a textbook 5-wave impulse (1 → 5).
* Followed by a complex **ABCDE correction**, ending with a liquidity sweep on Wave (E).
* Current price action is a **bullish breakout** — likely the start of a **new impulsive cycle**.
### 📐 **Fibonacci Extension Target**
* **7.35 = 100% Fib extension** of previous impulse (Wave 1–5), projected from Wave (E).
## 🎯 **Trading Setup**
| **Entry** | Market @ 5.90 |
| **Stop Loss** | Below 4.75 (beneath main OB) |
| **Take Profit** | 7.35 (100% Fib extension ) |
| **R/R Ratio** | \~1:3.6 |
---
> “SALIK finally ripped through resistance like butter. BOS confirmed the bulls are back in charge. That 7.35 target? It’s not just a guess — it’s fib math.”
> *“Fibonacci is the map. Price is the vehicle. Volume is the fuel.”*
---
### ⚠️ **Disclaimer**
> This is not financial advice. For educational purposes only. Always manage risk and use stop losses. Past performance doesn’t guarantee future results.

DUBAI TAXI COMPANY (DTC) Riding The Ascending ChannelDTC’s bouncing clean off the old resistance, now strong demand. Classic flip. Riding within an ascending channel, eyeing 2.75+ — just needs volume to push through
### 🟢 **Support Turned Demand Zone**
* The **previous resistance zone** around **2.33 – 2.42** has flipped into a **strong support/demand zone**.
* Price dipped into this zone and sharply bounced, confirming **buy-side absorption** at that level.
* Classic **S/R Flip** behavior – ideal for long setups.
* **Ascending channel** is developing — price respecting both upper and lower trendlines.
* Higher highs and higher lows = bullish structure in play.
* Channel is guiding price towards **next resistance/supply levels**.
### 🟡 **Supply Zones**
* **2.75 – 2.85**: Marked supply zone with heavy volume profile clusters — likely profit-taking or institutional selling pressure.
* Expect some turbulence or partial TP in that area.
---
### 📉 **RSI Perspective**
* The bounce from demand zone came with **low RSI** — signaling **bullish divergence** or **oversold** conditions
* Another bullish technical confirmation for current long bias
---
## 🎯 **Trading Plan**
| **Entry** | 2.54 – 2.56 (channel support retest) |
| **Stop Loss** | Below 2.42 (under demand zone) |
| **Take Profit ** | 2.85 (major supply zone) |
| **R/R Ratio** | Approx **1:2.8** |
---
> *“Every resistance broken becomes a soldier in the support army.”*
---
### ⚠️ **Disclaimer**
> This analysis is for educational purposes only and not financial advice. Always do your own research and use stop losses.

$NVDA In, $AAPL Out – AI Supercycle May Be Just Starting🚨 JUST IN: NASDAQ:NVDA surpasses NASDAQ:AAPL to become the second-largest company in the world, right behind $MSFT.
And if that wasn’t enough:
Trump calls Nvidia’s Huang "my friend"
Hints that Nvidia replaces Apple as his go-to tech ally
Meanwhile, Bloomberg reports Nvidia could ship 500,000 AI chips yearly to the UAE until 2027 under revised export rules.
Jensen Huang also confirmed Saudi Arabia is building massive GPU factories, describing them as “energy in, intelligence out” systems.
⚠️ The market may be waking up to the reality that AI is not as cyclical as many feared.
🔍 On the chart:
NASDAQ:NVDA broke to a higher high (HH)
NASDAQ:AMD testing lower high (LH) breakdown resistance
Could AMD follow Nvidia’s breakout? The setup is there.

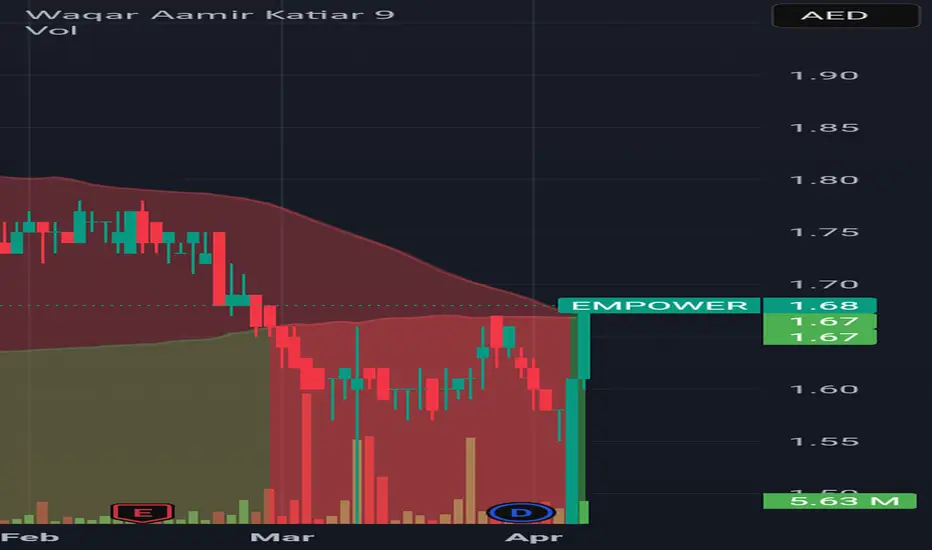
Empower is ready to fly Empower is entered into bullish zone and it will rise again.
Note: this is not a buy sell call. Use stop loss too.
SIB (Sharjah Islamic Bank) ADXSIB have been in uptrend from November till now with outstanding financial performance ~26%, RSI is now below 50 so it is a good time to jump and hold the stock looking for further growth.

Al Salam (SALAM) DFM Buy Opportunity"SALAM " (Al Salam Bank) Recently bounced from a Daily Demand Zone, and breaking the downward correction trend line.
Buying Opportunity: The stock is currently at a discounted level and likely to resume the up trend again.
Trade safe.. :)

Dubai Financial Market (DFM) – A New Bull Cycle Emerging?# **Dubai Financial Market (DFM) – A New Bull Cycle Emerging? 🚀📈**
If you think that Dubai Stock Market has already had hits moment, think again - the real party is just about to begin!
The Dubai Financial Market (DFM) has historically followed a **clear cyclical pattern**, with **three major market cycles** observed over the past two decades.
- **Cycle 1 (2005-2009)**: A strong bull rally followed by a deep correction.
- **Cycle 2 (2013-2015)**: Another rally that led to a sharp decline.
- **Cycle 3 (2021-2022)**: A similar structure, with a bullish phase and subsequent retracement.
## **Are We Entering Cycle 4? 🔥**
Recent price action suggests a potential **breakout above the long-term downward trendline**, a signal that a new bull cycle **could be starting.**
🚀 **This could be the start of a multi-year bull cycle!** this could signal an excellent buying opportunity.
📊 **What do you think? Are we ready for another Dubai bull market? Let me know in the comments!** 🔥📢
#DFM #DubaiStocks #StockMarket #Trading #Breakout #BullCycle #Investment 🚀

ADCB Long setup
ADCB (Abu Dhabi Commercial Bank) – 30-Minute Chart Analysis
- The price is currently in an overall uptrend forming higher highs (HH) and higher lows (HL).
- After a possible short-term correction
- The price is recently tested a key demand zone around 11.58 - 11.44 and touching the upward trend line which acts as a resistance level.
Trade Setup
- **Entry:** at **11.82 - 11.92**.
- **Stop Loss:** (Below 11.40)
- **Target:** 12.60 (next supply zone )
- **Risk-Reward Ratio:** ~1:3

TALABAT - (DFM) Potential Reversal from Demand Zone📉 TALABAT Potential Reversal from Demand Zone 🚀
The stock has been in a downtrend since its IPO, establishing an uptrend around January 5th, followed by a corrective wave starting January 21st after the previous impulsive move.
Currently, the price is testing a key demand zone (1.42 - 1.39), which was formed earlier in January. Signs of a potential trend reversal are emerging, including a break of the downward trendline.
A strong supply zone at (1.59 - 1.62) could serve as a profit target for an upward move.
This could mark the completion of Wave 2 correction within a larger uptrend. A breakout above 1.46 may signal the start of Wave 3, leading to a powerful bullish move.
Setup:
Entry: 1.42 - 1.45 (demand zone confirmation)
Stop Loss: Below 1.39 (invalidates the demand zone)
Take Profit: 1.59 - 1.62 (supply zone)
Risk-Reward Ratio: ~1:3 (ideal for a high-probability setup)
"The market is a device for transferring money from the impatient to the patient." – Warren Buffett
🚨 Disclaimer: This is not financial advice. Always do your own research and manage your risk accordingly. 🚨

Julphar (ADX) Long SetupJulphar has been in up trend since 18th Dec with a lovely 33% profit so far. The stock is making a correction now touched the upward trend line which coincides with a a 1H demand zone. this DZ has been holding for the third time, the price expected to shoot higher whenever we have 3 touch points.
Good time to enter or add to your position.
Entry ~ 1.48
Target ~ 1.63
SL ~ 1.40
Remember,
“The trend is your friend until it bends at the end.”
________________________________________
Disclaimer:
This analysis is for educational purposes only and does not constitute financial advice. Trading involves significant risk of loss. Always perform your own analysis and consult a financial advisor before making trading decisions.

ADNOC Drilling Potential Reversal from Demand ZoneADNOC Drilling bouncing from a 1H DZ, and rejected the Daily trend line, this is a good indication for upward momentum, after disappointing Earnings but positive 11% revenue higher than estimates.
Enter around 5.58 with potential target at 6 (Supply Zone)
SL 5.44 (base of the 1H demand zone and under the trend line)
Good time to jump in or add to your position.
Trade safe !
🚨 Disclaimer: This is not financial advice. Always do your own research and manage your risk accordingly. 🚨

SALIK (DFM) Wave 5 in playSALIK has undergone a significant correction of 18%, marking the conclusion of wave 4. There is now potential for wave 5 to commence, following a bounce from the Daily Demand Zone (DZ).
The 1.68 Fibonacci level indicates a target price of approximately 7.8, suggesting a potential increase of around 60%.
This could be a good opportunity to enter the market or add to your position

Alpha Dhabi ADX - Bullish RSI DivergenceAlpha Dhabi is signaling a strong bullish continuation backed by RSI divergence and Elliott Wave structure. Enter near the 12.30–12.36 zone, manage risks with stops below 11.70, and take partial profits at each TP level.
The RSI formed higher lows, while the price made lower lows, indicating momentum is shifting to the upside.
Trade Setup:
Entry: 12.36 (Bullish RSI divergence confirmation above demand zone)
Stop Loss: 11.70 (Below key demand zone, invalidates Wave 2 structure)
Take Profit Levels:
TP1: 13.00 (RRR ~1.5:1, first supply zone)
TP2: 13.50 (RRR ~2:1, strong resistance near Wave 3 target)
Stretch Target: 14.56 (RRR ~3:1, possible Wave 5 completion)
"Be fearful when others are greedy and greedy when others are fearful." — Warren Buffett
"Stick to your risk management plan and trust the structure as long as the pattern holds."
Disclaimer: This analysis is for educational purposes only and not financial advice. Always perform your own due diligence and trade responsibly. Past performance is not indicative of future results.

Dubai Taxi Company (DTC) - Possible Bullish BreakoutDubai Taxi Company (DTC) - Possible Bullish Breakout Setup 🚀
📈 Chart Pattern:
Symmetrical Triangle + Flag Formation
📢 Revenue Estimate:$626M vs $507M** (🔥 +23% QoQ Growth)
Strong earnings growth supports the bullish breakout scenario.
RSI Divergence: bullish RSI divergence supporting an upside breakout.
Flag Pattern: A bullish flag suggests a continuation toward new highs.
Trade Setup:
🟢 **Entry:** **$2.73 - $2.75** (On breakout with volume confirmation)
🎯 **Take Profit:** **$3.15** (measured move target)
❌ A **break below $2.65** invalidates the setup.
*"Markets are never wrong, only opinions are."* – Jesse Livermore
⚠️ **Disclaimer:**
This is **not financial advice.** Always conduct your own research and manage risk accordingly. Trade at your own discretion.

BILDCO 1H - RSI Divergence, ABC Correction Ending? Time to Buy?📈 BILDCO 1H - ABC Correction Ending? Time to Buy? 🚀
Market Overview
Abu Dhabi National Co. for Building Materials (BILDCO) has experienced a strong rally since Mid 2024, reaching a high of 1.34, before correcting sharply.
- The stock has now completed an ABC corrective pattern, with Wave C touching a major demand zone around 0.9546 - 0.9906.
- RSI bullish divergence detected, signaling potential exhaustion of selling pressure.
This could be the right time to accumulate positions as a new impulsive wave may be starting.
- A breakout above 1.12 could confirm a new bullish impulsive wave.
📉 RSI Divergence & Momentum Shift
-Bullish RSI Divergence formed at demand zone, indicating potential trend reversal.
- The RSI has crossed above 30 and is testing the 40 level, signaling that momentum may be shifting bullish.
- If RSI moves above 50, expect strong buying pressure.
📌 Trade Setup:
✅ Entry:1.12 (BOS)
🔻 Stop Loss: Below 0.95(invalidation of demand zone)
⚖️ **Risk-Reward Ratio: 1:4+ (solid trade setup)
⚡ Key Levels to Watch:
✅ Bullish Confirmation:
- Break above 1.12 = Trend reversal confirmed
🚨 Bearish Risks:
- Rejection at 1.10 could cause a pullback.
- A drop below 0.95invalidates the bullish setup.
"Opportunities come infrequently. When it rains gold, put out the bucket, not the thimble." – Warren Buffett
🚨 Disclaimer: This is not financial advice. Always do your own research and manage risk accordingly. 🚨

AMR (ADX) Potential Trend Reversal After a Long Downtrend📉 AMR 4H - Potential Trend Reversal After Downtrend 🚀
AMR has been in a strong downtrend (-47% decline) since October 17, mainly due to the Palestinian-Israeli war and subsequent boycott effects.
- With a ceasefire in place, market sentiment may shift, creating a potential recovery.
- A Break of Structure (BOS) has been confirmed, signaling a possible trend reversal.
- Current wave analysis suggests the stock has completed Wave 1, and short wave 2 correction, and we are likely at early Wave3.
- Bullish RSI Divergence detected, indicating seller exhaustion and a potential reversal.
- If the price stays above the 2.17 - 2.33 demand zone, it could trigger a rally toward higher levels.
📌 Trade Setup:
✅ Entry: around 2.47
🔻 Stop Loss: Below 2.30 (invalidates the up trend)
🎯 Take Profit Levels:
- TP1:2.67 (first supply zone)
- TP2:2.91 (major breakout resistance)
- TP3:3.16+ (wave 3 target)
⚖️ Risk-Reward Ratio:1:3+ (solid trade setup)
"The stock market is a device for transferring money from the impatient to the patient." – Warren Buffett_
🚨 **Disclaimer:** This is not financial advice. Always do your own research and manage risk accordingly. 🚨

Dubai Islamic Bank - 30% potential profitDubai Islamic Bank has a potential profit of 30%.
Overall, the real estate, banking, and investment sectors in the UAE are gaining Momentum.

FAB - Gaining Momentum hereIf we break through the red area, the next price targets are set.
Overall, the real estate, banking, and investment sectors in the UAE are gaining Momentum.

BHM Capital 1H-DFM - Potential Wave 3 in ProgressUsing a combination of Supply and Demand Zones and Elliott Wave Theory, the stock appears to be in the early stages of a potential Wave 3. Wave 3 is typically the strongest impulsive wave, offering high momentum and significant profit margin.
Key Levels:
1. Supply Zones (Resistance):
o Zone 1: 2.88–3.01 (Conservative TP1 area)
o Zone 2: 3.43–3.55 (TP3, next potential major reversal)
o Zone 3: 4.22–4.56 (Stretch target for extended Wave 3)
2. Demand Zones (Support):
o Zone 1: 2.10–2.16 (Current bullish accumulation zone)
o Zone 2: 1.87–1.97 (Stop loss buffer area)
3. Break of Structure (BOS):
o A key BOS has formed at 2.18, confirming a potential trend reversal to the upside.
Trade Setup:
• Entry: 2.21 (Aligns with the breakout and consolidation phase above the demand zone)
• Stop Loss: 1.87 (Just below the demand zone for safe risk management)
• Take Profit Levels:
o TP1: 2.70 (RRR ~1:1)
o TP2: 3.21 (RRR ~2:1)
o TP3: 3.55 (RRR ~4:1)
o Stretch Target: 4.56 (For aggressive traders aiming for an extended Wave 3)
Trading Idea (Summary): The setup aligns with the early stages of an impulsive bullish move (Wave 3). Entry near the 2.21 breakout offers a favorable risk-reward ratio. Manage positions closely at each TP level, especially near supply zones.
"The trend is your friend until it bends at the end."
Stick to the plan and adjust stops to lock in profits as price moves toward TPs.
Monitor volume"Strong volume through supply zones indicates wave continuation"
________________________________________
Disclaimer: This analysis is for educational purposes only and not financial advice. Always perform your due diligence and manage risks according to your trading plan.

IS EMAAR GOING DOWN ? Emaar's stock is targeting the levels of 12.20 - 12.05, presenting a good buying opportunity for short-term traders with targets of 12.65 - 12.75. It’s important to adhere to the stop-loss level, which is indicated by a daily close below these levels. Although there’s still a risk of the stock dropping back to previous levels around 11, the current movement needs to be monitored to determine its future direction.

ADNOC Gas (ADX) – Riding Wave 5
Analysis:
The stock appears to be in Wave 4 completion, and Wave 5 seems to be forming as per Elliott Wave Theory. The recent pullback aligns well with a key demand zone around 3.39, which has been respected, indicating strong buying interest.
Wave Analysis:
- Wave (1): Impulsive move from a prior consolidation range.
- Wave (2): Corrective pullback, respecting prior demand.
- Wave (3): Strong impulsive move higher with increased momentum.
- Wave (4): A corrective pullback to a demand zone near 3.39, forming a higher low.
- Wave (5): Targeting 3.97-4.00 levels, aligning with a Fibonacci 1.618 extension of Wave 3.
Supply/Demand Zones:
- Demand Zone: 3.39-3.14 (validated as price has reversed strongly).
- Supply Zone: 3.97-4.00 (potential resistance as Wave 5 completes).
RSI Confirmation:
- RSI on lower timeframes (e.g., 4H and 1D) shows no bearish divergence, which supports continued bullish momentum for Wave 5.
Trade Setup:
- Entry: around 3.52.
- Stop Loss: Below the wave 4 low at 3.39 to minimize risk.
- Take Profit: Target Wav 5 completion at 3.97-4.00.
- Risk-Reward Ratio: Approx. 1:3
“Trade what you see, not what you feel.”
Stick to your analysis and avoid chasing the market if the price fails to confirm Wave 5.
Always use proper risk management. Allocate no more than 1-2% of your account balance to this trade to ensure sustainability.
Patience is a trader's greatest asset!
Happy trading! 🚀
Disclaimer:
This idea is for educational purposes only and not financial advice. Always do your due diligence and consult a professional before making any trading decisions. Trading involves significant risk, and past performance is not indicative of future results.

BILDCO – UAE Stock Market (ADX) Bullish Reversal in Play BILDCO – Bullish Reversal in Play 🚀
Ticker: BILDCO (ADX)
Timeframe: H1
Setup: Elliott Wave + Demand Zone Strategy
Trading Idea:
1. The corrective Elliot Wave (c) ready to wrap up as price dips into a strong Daily Demand Zone between (0.620 - 0.600), right in line with the Fibonacci extensions 1.382 (0.5810) and 1.618 (0.5429).
- If this level holds, we’re looking at the start of a fresh Wave (3) in a new impulse cycle – and Wave (3) doesn’t play small.
2. Demand Zone Confluence:
- Heavy buy-side interest here; volume profile confirms it. This zone is loaded with potential.
3. Bullish Momentum Ahead?
- Price action in this area will tell the story. Watch for confirmation with strong bullish candles (engulfing, hammer, or similar).
Game Plan
1. Entry:
- Long from 0.620 - 0.600,
2. Stop Loss:
- Below the Demand Zone at 0.5712. Keep it tight, protect your capital.
3. Take Profits:
- TP1: 0.7066 – First supply zone.
- TP2: 0.7540 – Next major resistance.
- TP3: 0.8711 – Targeting Wave (5) extension.
4. Risk-Reward:
- Insane RRR of 1:8.59! Small risk, big potential move.
Why This Setup Rocks
- Demand Zone Holds Weight: Fibonacci + price action + volume = solid entry zone.
- Wave (3) Firepower: It’s typically the biggest, most explosive wave – perfect for riding the trend.
- Volume Backing It: Buyers are already lining up, which is what we want to see at key levels.
---
### Disclaimer
Not financial advice – trade at your own risk. Always use proper risk management and evaluate your own strategy before entering a position.
---
### Follow for More Setups
"Missed opportunities are a trader's biggest regret. Stay sharp, stick to the plan, and make the most of every move!"
Hit Follow for more insights and ideas like this one. Let’s crush the markets together! 🚀💹
