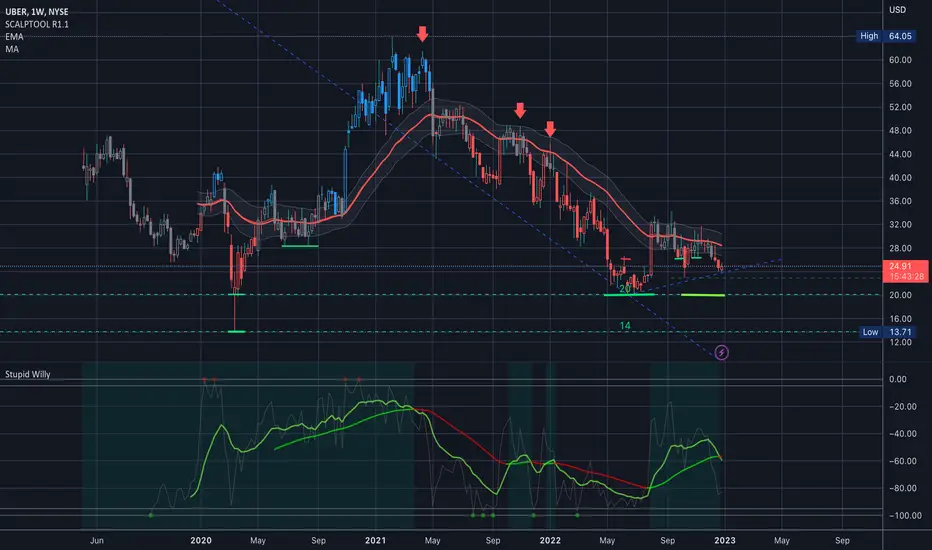
$UBER - WEEKLY BREAK-OUT$UBER - WEEKLY BREAK-OUT
Stocks are breaking out of year-long down-trends everywhere.
I'm loaded 💪🏻
Even our old friend Uber is leading the way, as covid is behind us!
Do you hold any stocks?
#Uber
Uber

UBER LONG IDEA!Uber has been pushing to the upside with thanks fundamentally after the rideshare platform was upgraded to overweight from neutral by Piper Sandler. The bank said increased car prices will push consumers to Uber and other rideshare platforms.
Technically, price action via the weekly has broken out of a flag pattern, eying a possible inverse head and shoulders pattern.

Uber (UBER) Long Idea!Uber possible long play (UBER)
Uber is trading higher today up over 5% after the rideshare platform was upgraded to overweight from neutral by Piper Sandler. The bank said increased car prices will push consumers to Uber and other rideshare platforms.
Technically, price action via the weekly has broken out of a flag pattern, eying a possible inverse head and shoulders pattern.

UBER, 10d+/-32.23%falling cycle -32.23% more than 10 days.
==================================================================================================================================================================
This data is analyzed by robots. Analyze historical trends based on The Adam Theory of Markets (20 moving averages/60 moving averages/120 moving averages/240 moving averages) and estimate the trend in the next 10 days. The white line is the robot's expected price, and the upper and lower horizontal line stop loss and stop profit prices have no financial basis. The results are for reference only.

$UBER Analysis, Key levels, and Targets $UBER Analysis, Key levels, and Targets
I made a funny joke when UBER IPO’d… I said… I’d buy at 25… well, here we are and from here on out I’m collecting…
I think UBER will be an S&P company for sure….
$UBER - MOST LIKELY SCENARIOUber Seems to have no real future as a stock. Just hanging around IPO price forever.
I expect it to drop to $20 and go back to $40 after that.

UBER IDEAHELLO GUYS THIS MY IDEA 💡ABOUT UBER is nice to see strong volume area....
Where is lot of contract accumulated..
I thing that the buyers from this area will be defend this LONG position..
and when the price come back to this area, strong buyers will be push up the market again..
UP TREND + Resistance from the past + Strong volume area is my mainly reason for this long trade..
IF you like my work please like and follow thanks


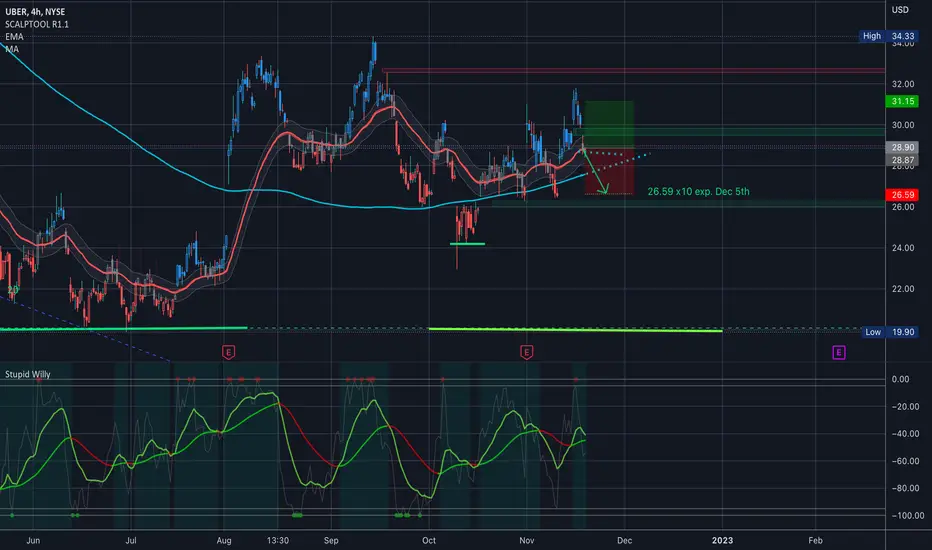
$UBER Analysis, Key levels, and Targets $UBER Analysis, Key levels, and Targets
SO yesterday when I gave my UBER target I calculated it on the wrong timeframe… ooopsie… so the 28.02 I just cancelled… sorry about that, y’all… 😬 I actually make more mistakes than I care to admit...
I just now put in a buy order at 26.59 in it’s place….
Something did feel off last night and if i had just lined it up with the option chain I would have noticed right away... but I was working so fast….
——————
If you used the strategy I did a bunch last year and the year before that then this will look similar…
Basically every night I will be updating the new buy order for the next day… each day I will be adding 10 shares at the buy level (please modify this to your account size if you want to play, there is nothing wrong with trading one at a time until you see how the strategy works)
I will be using options at levels where I see fit but right now I’m losing out on some really great opportunities by not having these orders in place like I used to…
And if you guys haven’t seen this strategy before… you’re in for a treat… it might take a few weeks for you to see what I’m doing but once you see you’ll see how easy it is…
Always make sure to select GTC (good till cancelled) on your buy orders, and you might have to select advanced order to add an expiration date to your order.
And have fun, y’all…

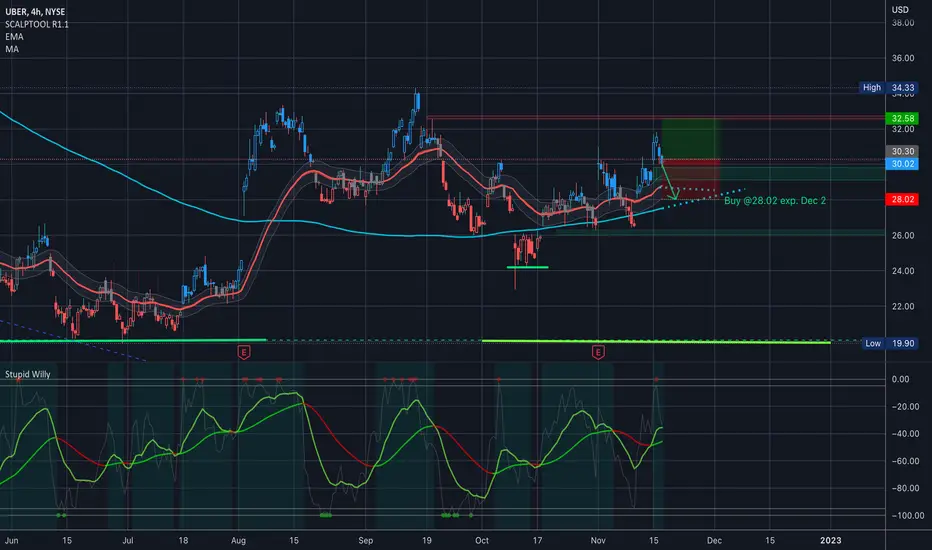
$UBER Analysis, Key levels, and Targets $UBER Analysis, Key levels, and Targets
I really like UBER. For many reasons. I really like how it’s been kind of respecting that 200MA 🤓… I have been selling UBER puts lately… and in general I want to be long here long term… so, I don’t know what I’m getting at but I’m buying shares here tonight… LOL… without a doubt I’ll be selling options at some point again here just not tonight, and not here…
Tonights buy order at 28.02 (x10) locked and loaded…
——————
Super excited to get back to one of my old strategies, but slightly modified… If you used the strategy I did a bunch last year and the year before that then this will look similar…
Basically every night I will be updating the new buy order for the next day… each day I will be adding 10 shares at the buy level (please modify this to your account size if you want to play, there is nothing wrong with trading one at a time until you see how the strategy works)
I will be using options at levels where I see fit but right now I’m losing out on some really great opportunities by not having these orders in place like I used to…
And if you guys haven’t seen this strategy before… you’re in for a treat… it might take a few weeks for you to see what I’m doing but once you see you’ll see how easy it is…
Always make sure to select GTC (good till cancelled) on your buy orders, and you might have to select advanced order to add an expiration date to your order.
And have fun, y’all… 💃🏻
Uber Share is Testing Its Major Support LevelUBER share price is going in an unclear trend in general, with many bullish and bearish price gaps, which it is soon to fill quickly, and it is currently trading at the bottom of a narrow and sharp descending channel extended since the beginning of November. On the other hand, UBER share is trading below the short and long-term exponential moving averages, in a severe bearish sign at the moment.
As for now, and on the daily chart, we keep an eye on the support level of $26.30, in case the UBER share price fails to stabilize above this level, we may witness another pullback towards the level of 24.66.
On the flip side, if the UBER share price was able to recover the EMA-25, then we target the return of the UBER share price to levels of $28.83-29.73 (the shaded area in yellow). If UBER share price manages to recover the EMA-200, we may also witness a recovery of 33.13 level in the coming weeks or months.

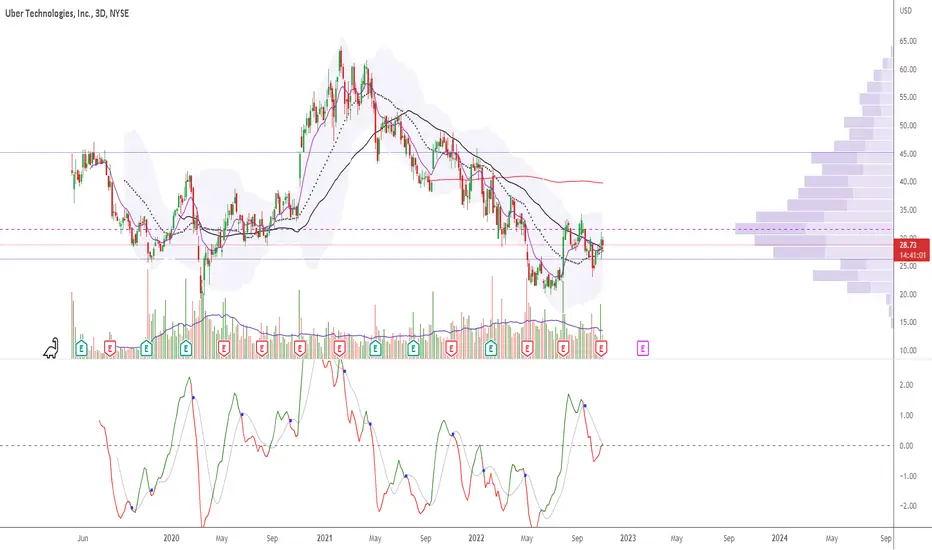
Uber - Showing signs of leader
Claimed VMA on 3D chart +++
Hanging below confluence of 200DMA and VMA. Any futher tightening at these levels would set this up perfectly for breakout. ++
volume shelf 30 is already tested. Above, 45 will come fast. Still early, but showing great strength over the last few months in a terrible market condition. Must watch for next few months.
UBER Break-out above the Bull Flag. $34.20 and $38.00 eyed.Uber Technologies (UBER) broke today above the Bull Flag pattern os September and at the same time the 1D MA50 (blue trend-line) and 1D MA200 (orange trend-line). By doing so it reached the 1W MA50 (red trend-line) for the first time since September 15 where it had an emphatic rejection.
Today's break-out is major as the 1D RSI also broke above its Lower Highs trend-line, so we turn bullish again on Uber, targeting the $34.20 Resistance and if we close above it, then the 1W MA100 (green trend-line) in extension around $38.00.
Our long-term target for this stock is $48.50, which is the -1.0 Fibonacci extension and interestingly enough, happens to be below the October 2021 Resistance.
-------------------------------------------------------------------------------
** Please LIKE 👍, SUBSCRIBE ✅, SHARE 🙌 and COMMENT ✍ if you enjoy this idea! Also share your ideas and charts in the comments section below! This is best way to keep it relevant, support me, keep the content here free and allow the idea to reach as many people as possible. **
-------------------------------------------------------------------------------
You may also TELL ME 🙋♀️🙋♂️ in the comments section which symbol you want me to analyze next and on which time-frame. The one with the most posts will be published tomorrow! 👏🎁
-------------------------------------------------------------------------------
👇 👇 👇 👇 👇 👇
💸💸💸💸💸💸
👇 👇 👇 👇 👇 👇

UBER: A top signal under a resistance? Post-Earnings analysis.• UBER is doing some interesting technical movements, even with the increased volatility after earnings;
• UBER went up just to hit the previous resistance at $30.24, a previous support from Oct 06;
• While I’m writing this, UBER is trying to do a Shooting Star candlestick pattern, a top sign;
• If UBER confirms a top sign, just under a resistance area, then we might expect a correction;
• Therefore, if UBER corrects to its 21 ema around $27 - $28, it won’t be a huge surprise;
• In order to avoid this, UBER has to react as soon as possible and break the $30.24;
• If UBER breaks its resistance, the next target would be at $33.38 (green line).
Remember to follow me to keep in touch with my analyses!

UBER Uber Technologies Options Ahead of EarningsLooking at the UBER Uber Technologies options chain, i would buy the $31 strike price Calls with
2022-11-18 expiration date for about
$0.63 premium.
If the options turn out to be profitable Before the earnings release, i would sell at least 50%.
Looking forward to read your opinion about it.

UBER Earnings Week.Uber is currently creating a Bullish Flag Price Action Formation. If Uber exceeds and/or meets expectations, there is a good chance of bullish momentum after the $28.29 price point is broken.

$UBER is this shorting into the hole?Even in good times for $UBER it has not been a money making venture. Private taxies could make money but UBER cannot. Drivers after costs and wear tare on their own vehicles do not make money. Will this taxi company in technology clothing find its way to profitability. I think not. What do you think?

UBER, Long-term investmentGood part of the day, people. That's my view on UBER stock price. According to technical indicators, price movement and my instinct I have come to this conclusion: UBER is going to roar the next two years.
Disclaimer: It's not a financial advise and do your own research.

UBER: A bullish reversal pattern! Will it REVERSE?• UBER is reacting today, however, this reaction alone is not good enough to characterize a true bullish reversal;
• Today it is doing a Piercing Line candlestick pattern just above the previous support at $27.10 (black line) – a bullish reversal structure;
• Although this is a decent reaction, it seems it is too soon to tell if this reaction will last long enough. As far as I know, the trend is still bearish, and UBER is heading to fill the last gap at $24.62;
• In addition, UBER did a Double Top chart pattern at $33.78, which indicates more sell-off in the mid-term;
• Could UBER perform a better reversal sign? Yes, but it must not frustrate this Piercing Line candlestick pattern (meaning, it must not lose yesterday’s low at $26), and it must close above the $27.69 (dotted line);
• Why above the $27.69? By doing this, it’ll frustrate the Double Top chart pattern I mentioned above. This point is the previous bottom seen on September/August and the trigger point of this Double Top;
• Only if UBER does both things I’ll see a recover to the $33 again (mid-term). The volume must increase as well, as it has been quite low recently.
I’ll keep you guys updated on this. Remember to follow me for more analysis like this! Keep in touch.

Selling Uber Swing low.Uber Technologies - Short Term - We look to Sell a break of 27.59 (stop at 29.51)
Daily signals are bearish.
A Doji style candle has been posted from the high.
The primary trend remains bearish.
The previous swing low is located at 27.69.
Daily pivot is at 27.69.
A break of 27.69 is needed to confirm follow through negative momentum.
Buying at the start of the week has stalled and prices are reversing.
Our profit targets will be 23.11 and 21.11
Resistance: 33.00 / 35.00 / 37.00
Support: 30.00 / 28.00 / 25.00
Disclaimer – Saxo Bank Group. Please be reminded – you alone are responsible for your trading – both gains and losses. There is a very high degree of risk involved in trading. The technical analysis , like any and all indicators, strategies, columns, articles and other features accessible on/though this site (including those from Signal Centre) are for informational purposes only and should not be construed as investment advice by you. Such technical analysis are believed to be obtained from sources believed to be reliable, but not warrant their respective completeness or accuracy, or warrant any results from the use of the information. Your use of the technical analysis , as would also your use of any and all mentioned indicators, strategies, columns, articles and all other features, is entirely at your own risk and it is your sole responsibility to evaluate the accuracy, completeness and usefulness (including suitability) of the information. You should assess the risk of any trade with your financial adviser and make your own independent decision(s) regarding any tradable products which may be the subject matter of the technical analysis or any of the said indicators, strategies, columns, articles and all other features.
Please also be reminded that if despite the above, any of the said technical analysis (or any of the said indicators, strategies, columns, articles and other features accessible on/through this site) is found to be advisory or a recommendation; and not merely informational in nature, the same is in any event provided with the intention of being for general circulation and availability only. As such it is not intended to and does not form part of any offer or recommendation directed at you specifically, or have any regard to the investment objectives, financial situation or needs of yourself or any other specific person. Before committing to a trade or investment therefore, please seek advice from a financial or other professional adviser regarding the suitability of the product for you and (where available) read the relevant product offer/description documents, including the risk disclosures. If you do not wish to seek such financial advice, please still exercise your mind and consider carefully whether the product is suitable for you because you alone remain responsible for your trading – both gains and losses

UBER is going to FLY!UBER has broken the trend line resistance and is moving up. Formation of CUP & Handle on daily supports the long case for Uber.
Entry - 32.50
SL - 27.60
TP - 41
Disclaimer: Not a financial advise. Do your own due diligence.

$UBER GAP FILL INCOMING?UBER rejected at the 200MA and continues to fall. With the FED meeting Friday I expected a GAP fill coming to the downside. Target 24.75
