Uber: View chart linked in descriptionView chart linked below. I don’t know how to force all days of the week on time scale so I charted Uber on a cryptocurrency chart.
Target price ranges between $63 and $90, but $66 is highly probable based on Wedge, EW, and Fib.
Uberlong

Uber: Trick or TreatDon’t fall for Uber’s trick, instead play nice and wait for it’s Treat. Yesterday, Uber didn’t gain like most of the market did. Instead, Uber faked a close under 20 DMA but bounced upwards right at close. That bounce coincides with a long term trend line that had been acting as resistance but now appears to act as support.
The pink vertical lines indicate bounces off the trend line by a high, low, open, or close price. If the trend line is valid support, then price could rally, slowly or quickly, to an ideal technical target price of $66. However, a more practical target price is closer to $54.
Like, follow, and let’s see what happens.

Uber centerfold: Doesn’t get sexier than this
10 20 50 and 100 DMAs
BB
macd
gaps
volume
... all confirming a possible breakout above the long-term wedge pattern.
Please wine and dine her first, gentlemen.

Uber: Be long not wrongAny chart that isn’t tracking this is wrong. Breakout confirmation can be closer to 36.65 but ~$37 is sufficient. Price will target 1.618 fib level if valid.

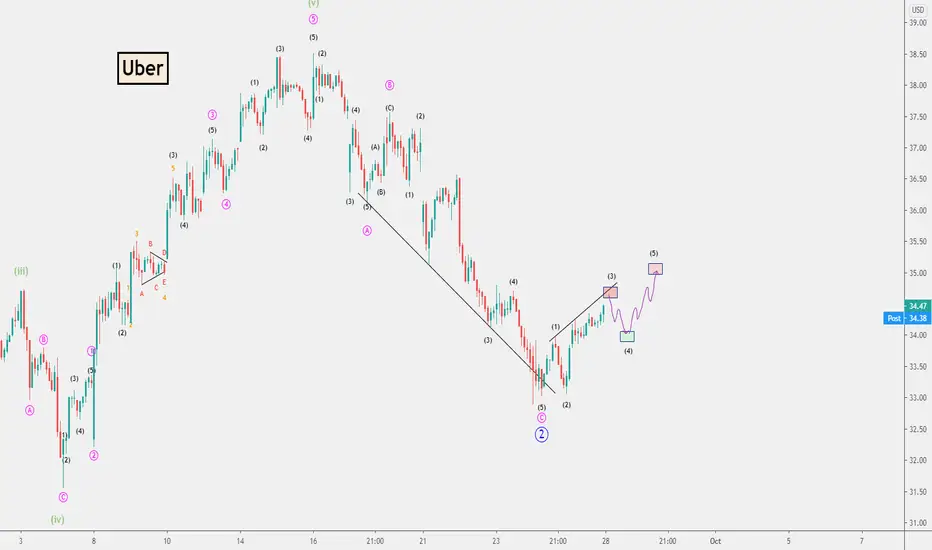
Uber: Correction is OverNYSE:UBER seems bullish after finishing its correction wave ( wave 2 blue ).
Here is a Buy Setup in Uber $UBERUber forming a nice wedge on the weekly.
I'll look to buy on a breakout to the upside.

UBER possible Positive DivergenceThere is a possible positive divergence on the 15 Mins chart for UBER, we need the confirmation of the resistance line on the RSI indicator. If the stock is able to break this resistance we can go LONG

Uber to Spike past $35 on Earnings Revenue Beat - Bullish $UBERTechnicals on all time frames look good to spike up post earnings. Bears that don't know about $UBER eats are going to get crushed. Profit miss and revenue beat will take this back up to $38 by September.

Uber Positive DivergenceThere is valid Positive Divergence in the 15 mins Chart for Uber.
Stop Loss at 29.72
Take Profit at 34.26
Be cautious because Uber is still on downtrend.


UBER LONG OR BUY , TARGET UP TO $40Uber confirmed pattern as "Flag" price increase, I bought here.
Uber buy : $32.50
Uber Target : $40 +-1
Uber Stop loss : 8%
Wish you good deals!

Uber 4hr outlookPT $34.80. We're making our way up to that trendline. it's a very key region. could also be a nice short if we reject the trendline.


😭 Sorry Guys... Kind Of Late On (UBER)💰 LET'S GET INTO SOME UBER ANALYSIS!💰
1️⃣ First off SMASH that LIKE BUTTON & Give us a FOLLOW for DAILY ANALYSIS! ❤❤❤
(Overall Market Sentiment) 🐻 Bearish
- Man I wish I would of had checked this one on the daily chart about a week ago. Beautiful crossover Crossover ema dots played out. No worries, let's catch the new wave!
- We are getting a red Crossover with an engulfing candle, this would good be a good short but we need to consider how close we are to support. I would rather look for the breakout on the 31.50 support to go short for most likely a 10-13% play to the next low.
- We so have one previous touch at 31.50 and rebounded but not by much! Let's see how it holds up. If it did hold and compressing with a green Crossover we will go long based off of the fact we did have that recent support.
- All 3 ema dots are firing red.
Drop your chart below in the comments section and share with us what you think will happen next! ❤❤❤
Thanks for checking out our analysis! ✌😁✌
🥇MLT | MAJOR LEAGUE TRADER


#NYSE #UBER The Bright Future Long Position Before my explanations and forecasts, why do I call Uber shares as a "Bright Future" on NYSE, let us remember some data about them!
Well!
Uber went public on May 10 with an $82.4 billion valuation, and it happened only the last year (2019), do you remember this?
Their start wasn't so impressive...
"Uber raised $8.1 billion in its offering at an IPO price of $45 a share. At a recent stock price of $41.57, the company had a market capitalization of almost $70 billion, based on the 1.677 million shares it had outstanding after completion of the offering."
If you check their just two years graph, you will see their vast loss!
BUT!!!
Here we are in 2020!
Uber is one of the promising company, because of the virus! They are recovering very fast and from the lowest price of their history (March 20 stock price 21.33 USD). Their share price is 36.59 USD, and it has powerful potential to close this massive gap at the 40.72 USD and to continue an excellent long position.
Interest regard of the company is increasing very fast, and it's a perfect chance to buy some shares and to keep them for a long term position.
I used several precise trading instruments, where you can see Fibonacci retracement and their percentage positions. As you recognize, it has already passed 35% of uptrend and will be closer to 50% and more soon.
Overall, most of the technology companies have perfect perspectives, and one of them is UBER, a very fresh and right choice for trading.
Don't hesitate to like and leave your comments below! Thanks

Uber Stock will keep going up Uber Stock will keep going up
**Disclaimer** the content on this analysis is subject to change at any time without notice, and is provided for the sole purpose of assisting traders to make independent investment decisions.

UBER BreakoutChart is self-explanatory. Basically follows roadmap from my MRNA idea up to the resistance drawn.

Uber strong potential for a bullish trend to reach 32.26$The next potential target for Uber is at 32.26$ when the price crosses 29.52$ resistance with a strong volume. Stop loss at 21.65$.

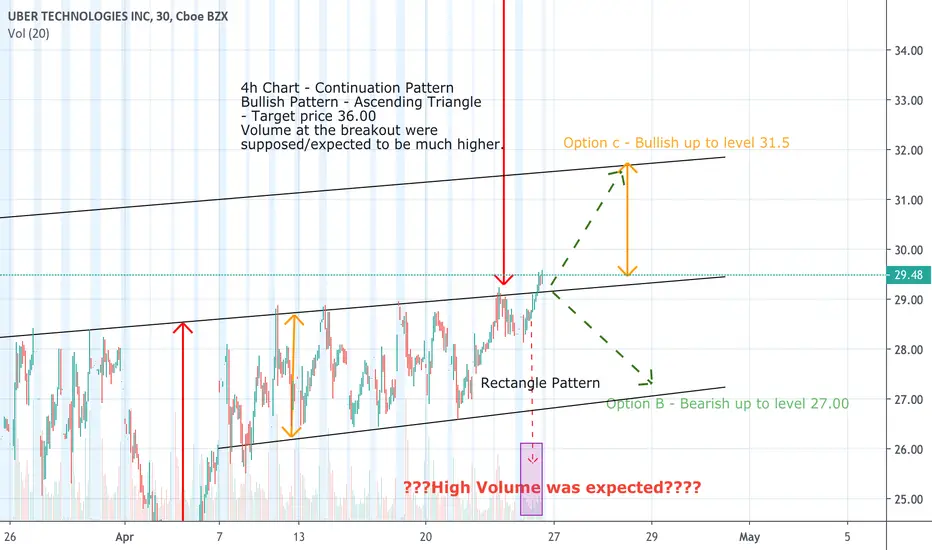
Uber Stocks against the Odds keeps going Up but "Stay aside"Against the Odds and Fundamental Uber seems to go up. Volume does not support the breakout so option B could be still Open
Possible options are:
Long Term Analysis
4h Chart there is Continuation Pattern and Bullish Pattern: Ascending Triangle - Target price 36.00
Volume at the breakout were supposed/expected to be much higher.
Short Term Analysis
30 Minutes Chart Rectangle Bullish Pattern. Two possible options: Option c - Bullish up to level 31.5, Option B- Bearish up to level 27.00
$UBER Breakout Eminent Too many positives going on for it not to break out, resistance level is a tough one, tested many times - Has to be weak by now and with more support behind the rise this time.

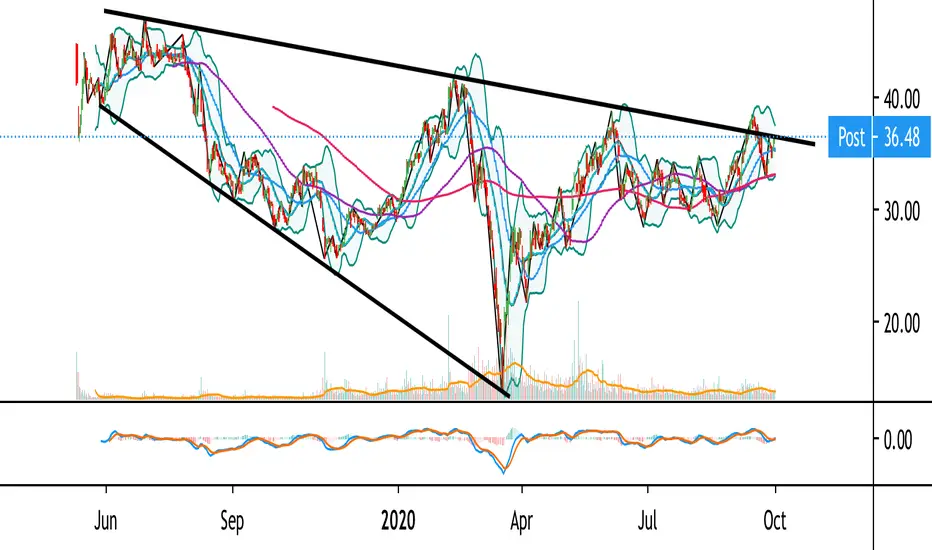
UBER Falling Broadening WedgeSupport/resistance lines
1. $41.95
2. $33.96
Trend lines
1. The first main trend line begin with the IPO lunch and forms the support line for the falling wedge.
2.The second main trend line begin with the initial structure high at $47.16 and forms the resistance line for the falling wedge.
Falling Broadening Wedge
We can see the Falling Broadening Wedge forming slow with the Highest point at $47.17 and the lowest point at around $15. The resistance trend line has been touched 2 times and the support trend line has been touched 3 (4) times since the form.
In the falling broadening wedges the most usual scenario is the the price consolidation when falling in that two trend lines and in some point the price to break the resistance trend line and form a breakout.
RSI
1. 5-Period Rsi
In that period i used it to define the main swings/waves of the charts.Based on oversold-overbought areas.
2. 14-Period Rsi
In that period i used to define possible divergences.
Scenario
