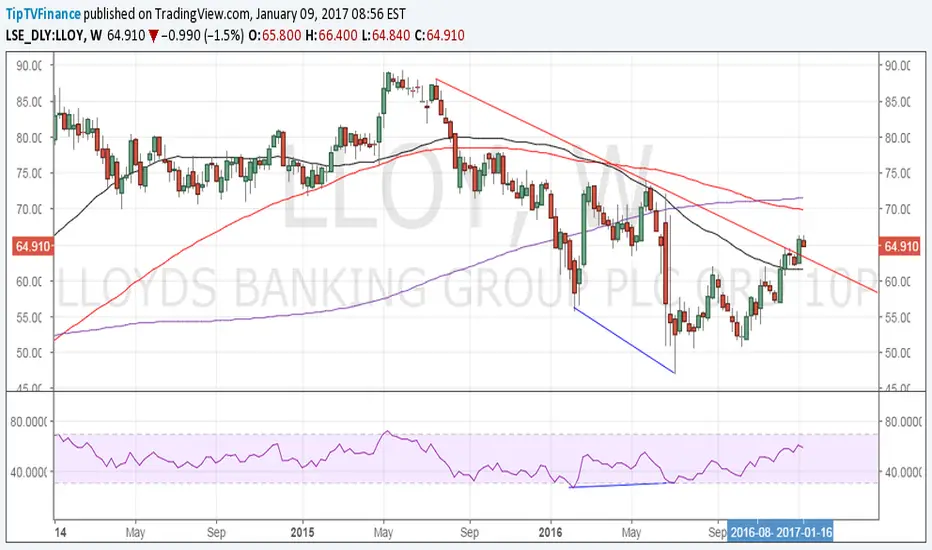
Lloyds Bank – Bulls score another brownie pointFirst it was the bullish price RSI divergence and now we have a confirmation of the breach of the falling trend line on the weekly chart. The weekly 50-MA is bottoming out as well.
The stock appears on track to test 70.00 levels. Bullish invalidation is seen only if the stock closes on Friday below the weekly 50-MA level of 61.53.
UK
RBS potential to reach 99$ price areaFor your long swing account. You will have many opportunities to add more to the trade so still once reaching 1:1-or-more ratio remember to consider taking profits to remove your risk.

FTSE gains to prove progressively more difficult to maintainFTSE continues to strengthen, with the bounce from the 6676.56 monthly low of 4 November posting new highs above the psychological 7200 level at 7211.96.
Continuation to the 7236.25 projection is highlighted, but further gains are expected to prove progressively more difficult to maintain, as studies begin to mature. In the coming weeks, profit-taking risks are highlighted, but improving background studies should limit downside tests, as investors maintain a buy-into-weakness strategy.
Support is at congestion around 7000 with any break turning investors cautious once again as subsequent focus turns to the 6875.40 low of 12 December. Further slippage below 6800 will add further weight to sentiment as critical support at 6655/75 then comes into view.

AUDUSD SKACAPITALIm already short on this, however, as seen on the chart I believe the outlook is still short. Only longs would be analysed on the break above the trend line. Our longer term target would be 0.7000-06900. However, as you could see we have multi trade setups. They are just their to remind me of potential entries (adding on to my trades). Once each target has been met price action must be analysed. The longer term trade setup, ideal stop would be 0.74300 to cut out fundamental manipulation. However, i would like to be out of the trade if the trend line is breached, ill look for a re entry if my trade is stopped out by a false movement. Please remember, this is just a forecast and money management is key.

United Utilities – Bears reinforced?Thursday’s Bullish outside/bullish engulfing candle lacks follow through given the prices have dropped today.
A weak closing today would mark the failure of the Thursday’s bullish candle and open doors for a sell-off to 860 levels over the next week.

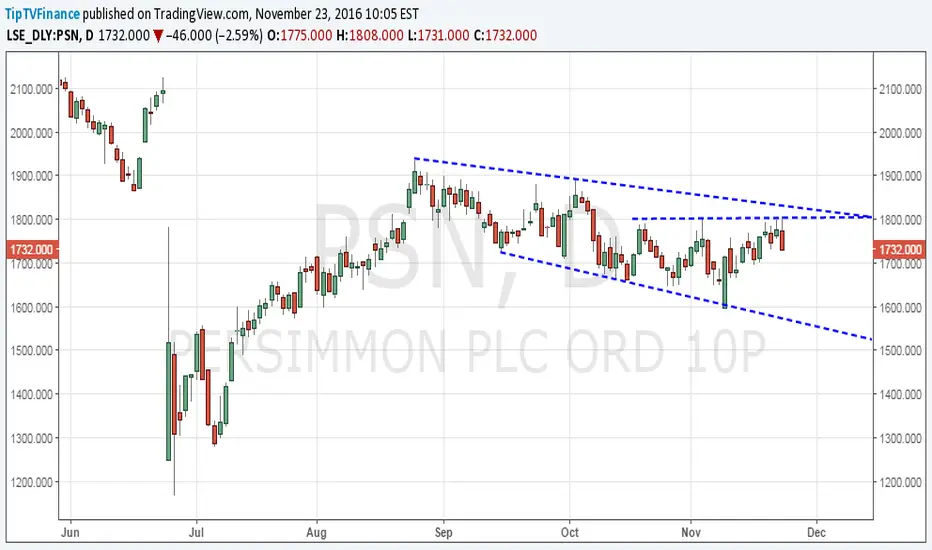
Persimmon - Bullish breakBullish from the downward channel marks the continuation of the rally from the Brexit day low. On the higher side, major resistance is seen around 1900-1910 levels (falling trend line resistance).
On the downside, only a daily close below 1800 would signal bullish invalidation.

GBP/NZD SHORT Price printed a spinning top on yesterdays daily close suggesting the bulls have run out of steam. If price moves to my entry it could mean the bears are back in play for a short move below.

UK FTSE to find difficulty maintaining higher levelsUK equities are consolidating the steep rally from the June lows, as prices turn choppy below congestion around 7000. A push above here cannot be ruled out, as the Tension Indicator continues to advance, but falling stochastics are expected to limit scope, with the critical 7122~ contract high of April 2015 to provide a barrier.
In the coming months, downside risks are expected to increase, as investors maintain a cautious stance, with a close below the 6654.48 low of September opening up lows down to congestion support at the 6500 retracement. Further slippage towards 6300 cannot be ruled out, however, as longer-term studies show fresh downside development.
An unexpected close above 7122~ will open up the 7325, (50%) projection of the 2009-2015 rally, before fresh selling pressure appears.

FTSE to find difficulty maintaining levels above 7000FTSE has bounced smartly from above the 6676.56 monthly low of 4 November, with prices now pressuring the 6956.70 retracement.
Extension to congestion around 7000 is highlighted from rising momentum studies, but any further gains are expected to prove difficult to maintain, as the Tension Indicator, (not shown), continues to weaken and investors maintain a cautious stance. A close above 7000, however, would improve sentiment and open up highs towards the critical 7129.83 high of October.
Support is raised to congestion around 6800, but a close below the 6615/76~ lows is needed to confirm continuation of the October bear trend and turn investors bearish once again.

GBP/SGD great opportunity to get into long term tradeThis is one of my main themes for my macro portfolio. I am looking to see more buyers for GBP and also we see same weaknees in Asia region which I express with this trade idea.

FTSE 100 awaits breakoutOn the daily chart, the head and shoulder neckline is seen at 6685 levels.
A rising bottom formation has been seen since November 9.
Still, the bulls are likely to remain on the sidelines so long as the descending trend line drawn from Oct 11 high and Nov 10 high is intact.
Meanwhile, the bears await a breach of the head and shoulder neckline.

HSBA – Bearish divergence intactThe daily RSI is in a falling channel even though the prices are moving higher, suggesting a bearish price RSI divergence and a potential for a correction.
However, the stock found buyers at the session low of 629.60. Nevertheless, a potential for a sell-off remains intact till the stock does not close above 645 levels.
On the lower side, major support is seen around 600 levels.

easyJet eyes 50-DMA supportRepeated failure around 1080 area if followed by a daily close below 50-DMA of 1038 would confirm the bearish MACD crossover and open doors for a sell-off to 200-DMA level of 987.60.
Only a daily close above 1100 would open doors for a fresh rally to 200-DMA seen today at 1247.

Supergroup PLC – Awaits Symmetrical triangle breakoutOn the daily chart, we see a larger symmetrical triangle formation. Off late, the stock has been restricted to a narrow range of 1520 to 1580.
The daily RSI has turned flat, however, the daily MACD shows loss of bullish momentum following a sharp rally from late Oct to mid November.
Hence, a bearish break from the narrow range of 1520-1580 appears likely. Prices could extend losses to 1427 (Sep 15 low) in this case.
On the higher side, it is advisable to wait for a bullish break above the triangle resistance.


Persimmon – Bearish outside day candle at critical resistanceThe stock retreated from the critical resistance around the psychological figure of 1800 and was last seen trading around 1732.
The daily candle is now a bearish outside day.
A break below 1700 would open doors for a test of the falling channel floor seen today around 1573.
Taylor Wimpey – More losses below 148.50UK House builders have faded post budget spike. The daily candle is now a inverted bearish hammer.
That has ensured the falling channel is intact.
Prices currently trade around 149.40. A daily close below 148.58 (38.2% Fibo) would add credence to the failure at the channel resistance and open doors for a sell-off to 140.00 levels.

Tesco looks set to test monthly 50-MA hurdleTesco looks set to rally further. In the short-run the psychological figure of 200 is likely to act as a base.
Bullish price RSI divergence
Bullish break from the triangle pattern
Bullish crossover on the Monthly chart
Thus, the stock appears on track to test the monthly 50-MA seen today at 255.51 levels. The moving average is seen sliding lower to 245-247 by year end.

HSBC Holdings - Time for a healthy correctionRight hand side - Daily chart
Left hand side- Weekly chart
The bearish divergence is quite clear. The price is sliding higher against the trend line, while the RSI is moving in a downward channel. Unless, the RSI breaks higher, there is little reason to believe the stock could rise further.
Over here, the RSI is sowing a bearish divergence...while the MACD is showing the loss of bullish momentum.
Overall, it appears the stock is poised for a much needed healthy correction to 600-580 levels.

Faith in GBP restoredLast week Supreme Court ruled that UK needs to have a parliamentary vote for Brexit
REFERENDUM NOT BINDING
Fundamentals give reasons to have faith in GBP again; strong yen hurting Japanese economy
Close above Fib on daily and strong BULL till the end of the week, even in a longer term.

Sainsbury - A bottom may be in placeThe daily, weekly and monthly chart do not show any clear trend. Hence, we swtiched quarterly chart, which shows multiple 3-month candles with long tails.
Since October 2013, sellers have repeatedly run out of steam in the range of 210-230. The MACD also shows the loss of bearish momentum.
If charts are anything to go by... this could be the ideal time to enter into Sainsbury/UK retailers

Barclays – Poised for correctionBarclays is one of the volume leaders today. The stock appears priced for a correction –
Bearish price RSI divergence on the 4-hour chart
Overbought on the daily chart
Stuck at weekly 100-MA
Thus, a minor pull back to 200 from the current price of 2111 appears likely.

Burberry at 5-month rising trend lineMACD, though below zero, shows the momentum has stalled. A day end close below the rising trend line would open doors for a further sell-off to 1277 (August lows).
It is advisable to be on a 'wait and watch' mode.
On the higher side, only a daily close above 1450 would signal a possible revisit to recent highs around 1550.
