GBPUSD zone: Time for buyers to reach 1.30388 before next FEDThe GBPUSD is in a support base that has not been broken, the market waiting for the economic datas from USA.
Weird attitude as the UK entrepreneurs are confident about their capacity to expand their business according to a recent analysis (investing.com)
GBPUSD might fall more if US numbers are pretty good but 2017 will see it rise back to 1.34.
The perfect timing to buy might be now on a weekly timing according to me.
UK

UK manufacturing PMI preview: What to expect of GBP/USD?UK manufacturing PMI for August is due for release today is expected to show the pace of contraction in the activity moderated somewhat. The index is seen coming-in at 49.00 compared to July’s 48.2 figure.
No signs of post Brexit gloom and doom
So far we have not seen any sign of post Brexit gloom and doom. It was just the July manufacturing PMI figure that triggered that matched the fear mongering spread by Anti Brexiteers. A positive manufacturing PMI figure; above 50.00; would put to rest whatever little speculation of post Brexit gloom and doom exists out there. Hence, we could see the bird revisit 1.32+ levels. The initial spike could take the pair even higher, although what matters is if the spot manages to hold above 1.32 levels on larger time frame charts.
On the other hand, a weaker-than-expected figure could yield a fresh slide to 1.3065 (previous day’s low). Moreover, a weak figure ahead of payrolls release and after hawkish Yellen would only underscore the growing monetary policy divergence between the Fed and the BOE.
Technicals – Stuck at 50-DMA
Pair’s failure to take out symmetrical triangle resistance on last Friday followed by a drop to 1.3059 and a recovery above 1.31 if followed by a failure at 50-DMA and a break below 1.3059 levels would open doors for a revisit to 1.29-1.2865 levels.
On the higher side, a convincing day end close above 1.3315 (23.6% of 1.5019-1.2789) would suggest trend reversal.

FTSE 100 6780 -> 6570Daily close below support level 6780 confirms short opportunity on FTSE 100 targeting 38.2% Fib retracement level at 6570.

FTSE 100 6860 -> 6570FTSE 100 is retracing from the 6780 support zone.
Consider reentering short from 6860 targeting channel breakout and further decline down to 6570.


FTSE100 – Daily Money flow indicator suggests cautionThe daily money flow indicator suggests bulls need to observe caution. If we look back into history, each time the indicator neared 67-70 levels, there was a notable pullback in the index.
The view gains further credence when we consider the fact that FTSE100 is hovering around key resistance zone of 6850-6900.
If indeed the historical pattern unfold (which seems likely) the first stop could be at 6775 followed by 6600.

More dropping then buying, I want 300 pips profit (at least)Have you traded GBPAUD much? It's a pair that will do whatever it wants whenever it wants, and I love that... it makes me feel alive, kind of like "today might be the last day I ever trade!" Anyway, the money to make on this pair is outrageous, IF you are patient.
Here's what I want to see:
1. more more big move lower into the mid 1.60's (1.65 ideally) then i'm going to draw a short term trend line probably on the 15 minute chart and I'm going to buy every break up until I can get back up to the lower 1.70's (weekly pivot etc). At the time of this posting the pair is bounding around 1.6900's, 100-200 pip move up first will invalidate my trade.
2. I will start small on this trade, scale in with a bigger position a few times and target the low 1.70's
3. I will then run to the bank laughing all the way!
Check out more of this at www.daytradersfx.com

Standard life PLC – Rally has legs, eyes 200-DMAStandard Life PLC is among the top 5 FTSE100 risers; trading 4.4% higher on the day at 332.50.
Volumes have held around 20-day moving average, while there are no signs of topping out on the daily MACD.
The only sign of worry if any is the possible divergence on the Money Flow indicator.
Overall, the stock appears on track to test 345 (38.2% of 2015 high – 2016 low + 200-DMA). Further gains appear unlikely as major averages are still trending lower, so a rise to 345 could be followed by sideways action.

Easy Jet - Should we trust the rally?Easy Jet shares have finally witnessed a relief rally of sorts. Prices clocked a low of 973 on July 26 before jumping to a high of 1080 today.
The question now is should we trust the corrective rally in the shares. Fundamentals do not support the rally in prices… travel stocks are anyways under pressure, furthermore strengthening of oil prices further is an addition to the bearish news.
On the technical front, the news is not good either-
The volumes have stayed below 20-day average through the current technical recovery.
The money flow index also suggests the corrective rally is more due to profit taking/unwinding of shorts.
Hence, the current rally may not be sustained. Moreover, gains have come after last Thursday’s BOE stimulus, which have triggered broad based gains. After the effect of stimulus wanes off the stock may resume the downtrend.
On the higher side, we keep an eye on 1177 levels, while fresh sell-off is seen once the recent low of 973 is breached.

FTSE 100 ABCD + Bat Pattern => Strong short opportunityChart speaks for itself no extra information needed


FTSE SHORTAn overbought ftse is due to fall, i am short at 6700 and todays strong test and pull back from the 3/1 level further confirms bearish sentiment, first tp is at 6400 and the second set just above major support zone 6200..

Sunoco Short SetupAs with all the other us energy stocks we have been following they're all in a corrective structure.
Like all the others Sunoco is currently in a corrective structure. One option is to sell off the bounce of the top of the triangle. Alternatively we will be waiting for a break of the lower trend line. Once it breaks we will be watching on a lower time frame for a failed retest or consolidation and then take the sell.

EURGBP SKACAPITAL Looking short to downside targets of 0.82950 then ideally 0.81250. However, if price breaks above 0.86500 then the trade setup will no longer be valid with possible upside targets of 0.87950. Price can retest 0.86250; hence the reason our stop loss being places above.

Short FTSE100Declining RSI (14). Strong resistance. MacD and K.S.T. (Know Sure Thing) about to cross. Weak fundamentals

$TALKTALK SHORTS/R DRAWN FROM WEEKLY CHART. POTENTIAL H&S FORMING ON TALKTALK CHART. BEARISH DOWN TO THE NECKLINE @ 196.65


GBPUSD SKA CAPITAL Looking short on this pair, firstly looking at an upside move to potential levels 1.31650-1.31850 (Trend line bounce).From this level we would await key bearish PA to develop; we would then seek entry to downside targets of 1.3070 then our ideal target 1.29750. The ideal target would be valid on the basis of a bearish breakout below 1.30750. Our management target being 1.3070.
We harve a possible bullish harmonic pattern in play which provides us with the confluence of an upside move from current support. As you could see we have further confluence with Senkou Span A (Green Cloud) acting as Resistance. We then have a Kumo Down Twist forming and price being below the clouds and the 200 EMA demontrates bearish momentum and a possible continuation to the downside. We have lower highs which is demonstrated in the defending channel.
Furthermore, we can possibly see a bearish ABCD formation to our downside targets.
TRADE SETUP
We would wait for price to reach the trend line and target of the Harmonic pattern before looking for the short (sell) trade setup, you can set up a sell limit order however we prefer to wait to setup a sell stop order to endure we enter on the basis of bearish PA. (Shorter term traders can look to buy to levels 1.31550).
As you could see our stops are placed at 1.32300, stops could also be placed at 1.3300. However, we would prefer to have our stops just above the Senkou Span A & B and above the trend line as a break above would demonstrate further bullish momentum.
Therefore a possible strong setup would be as follows:
SELL STOP/LIMIT ORDER: 1.31550
TAKE PROFIT (Management): 1.30850
TAKE PROFIT (Ideal): 1.29750
STOP LOSS (ideal): 1.3200
STOP LOSS (Possible) 1.3300
***TRADE AT OWN RISK***

Glencore in a corrective structureHi Everyone, hope you are all doing well. Glencore (GLEN) appears to be in a corrective structure so we are waiting for the sell setup. Stay tuned for updates as the trade become active.

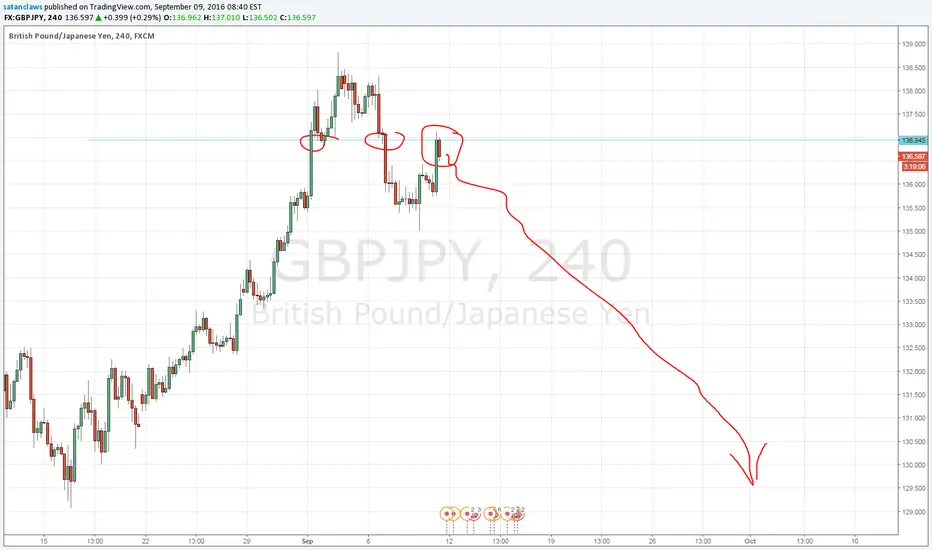
Is the GBPJPY in a downtrend and should I short?With the Japanese Yen looking very strong right now and the GBP looking bearish you can see a downtrend has formed in the GBPJPY weekly chart. Right now it seems as if it is in phase two of the downtrend cycle.
I personally would be wary about the fundamentals, as some news are to be released related to JPY and GBP throughout this week. I would look to short GBPJPY following the trend on phase 1.

GBPJPY SKA CAPITAL OUTLOOKAs you could see outlined on the chart we believe this pair is looking bearish to possible targets of 136.500 then possibly 134.00. There are several ways this trade setup could be undertaken. You can either wait for a breakout and retest of the lower trend line with bearish candlestick confirmation. However, we would be entering this trade around 140.30. Stops could be placed just above the upper descending trend line or above the previous highest high (Above 143.500). If price breaks above the pattern then this trade setup is no longer valid.

Sell GBPUSD 1.3100 targeting new lows below 1.28Sterling remains weak and has just broken the neckline of a bearish head & shoulders formation on the 4 hour chart.
Caution is advised (see my linked post) with regards to the risk of a short squeeze perpetuated by UK labour and retail sales data this week.
It would be prudent to operate a stop on-close rather than at-level given the likely volatility around data releases. Aiming for approximately 1.28 (-300 away) with a stop no higher than 1.32 (+100 away)
A negative weekly/daily bias remains below 1.3317, with this short term formation on a 4 hour interval also negative.
