Have the bulls given up there gains As u can see UK 100 is in a uptrend this looks like it is now exhausted and looking to reverse back down.
we have been in a rising wedge from 17 march and looking to complete on 3 may where we could see a potential short position play out target is on chart
UK100 CFD

ftse q2 prediction Personal analysis
ftse 100 - Volatile movements uptrend potential to reverse.
short at 6900
tp 1 - 6810
tp2 - 6650
tp3 - 6480
swing - Q2 Analysis
Willows

SHORT FTSE (UK100) 1-2 DAYS - 1hr chart - zoom out for contextThe chart speaks for itself. Nice top, but I'd like to see it go down again to retest level underneath and rise again - as scenario 1 follows.
Might be a few days to do so, but considering movements the last two months, where I have been following FTSE closely,
it does not have the strength to keep going as is right now.
It might also happen that it loses a lot of strength and searches towards bottom half of the pitchfork - as scenario 2 follows.
You can zoom out on the chart and see where I get my levels and lines from.
Would be nice and healthy to down a bit and find some more strength. Although,
April is historically a positive month for stock markets, so I believe it will go to an ATH. Perhaps, in the interval 20-30th April.
Stay healthy.

Will FTSE 100 finally breakout??!?!With a start of a new quarter..keep an eye on the FTSE 100.
Price has been consolidating since the start of the year, trading inside value for '21.
After selling off early in the year, price is back retesting 6800 yet again. A break above would be a very bullish signal, with continuation towards yearly highs a good possibility.
We are currently opening near last months VAH & POC, so should show its hand soon.
Watch and see how it plays out.

FTSE: LONG OR SHORT ?Following the world economic recovery, FTSE is now in a bullish cycle and here's our view for the upcoming days:
1.LONG : If the price retests the lower trendline and forms back a green bullish candle on the H4 timeframe, a Long position can entered there. And when the price reaches the green doted line, an additional Long position can be entered with more confidence since the price will be breaking a peak that was reached before.
2.SHORT : If the price breaks successfully the lower trendline with many bearish candles, then and only then a Short position can be entered.

FTSE100there is global diamond pattern for most indexes the rising cycle restore in markets from Asia to USA after the prices pullback from 6650 dip creating highdf low from the last one around 6500 which open new levels for 6960 for now
most indicators support this scenario .
i will keep an eye on astrazeneca news so i dont take any surprises for that 6700 stop loss will be my exit


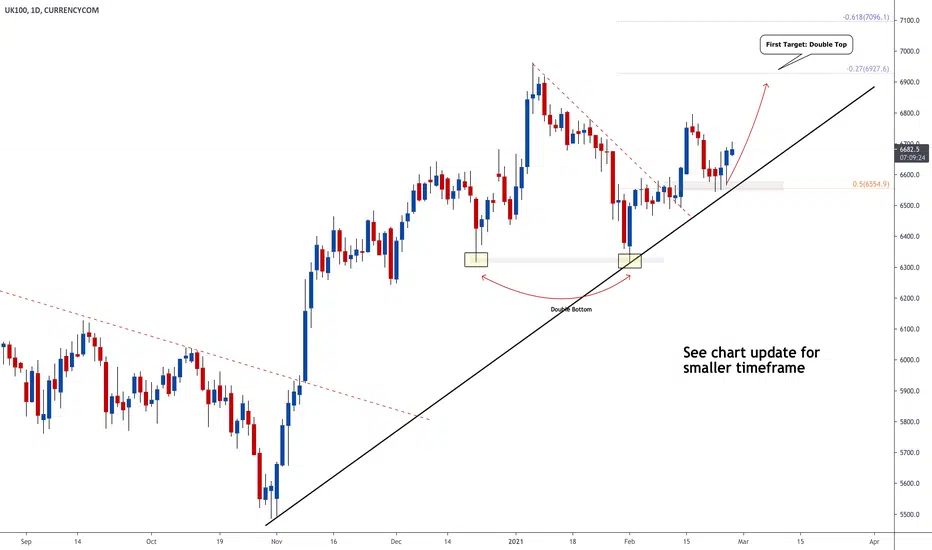
FTSE100 - Triple bottom formedFollowing on from my previous idea, the FTSE has continued to show strength at this level of support.
A triple bottom has formed at what looks like the bottom of the cup in a cup and handle pattern.
If FTSE traders were bearish, the drop from the rising wedge would've been steeper. The news around the vaccine spat with the EU would've also likely caused a steepeer slide. However, because the bad news has been absorbed, we can assume traders are bullish (for now).
I think the only thing stopping the FTSE from moving up is the current fears around lockdown on the continent. Technically speaking, I like how the chart looks. Bulls seem to be defending the 6700 level well. Fundamentally, the fears over lockdowns worries me about this setup, but I'm still confident it will play out.
See chart for entries and exits

FTSE100 - Fresh highs incomingThe FTSE is currently sat at strong support. Sellers tried to push price lower, but the index was bought back up to form a pinbar (red arrow). Lower BB also sits at this point (see %B in bottom window).
Considering the lacklustre fall from the rising wedge and the subsequent pin bar, we can expect 6800 to break (see how long price spent lingering around the level).
The next resistance is ~6838, so a break and restest of the 6800 is likely and will be the perfect high probability entry.
An aggressive entry would be at open on Monday (I personally will probably take this based on the pinbar with a stop below the low).
Target is the psychological level of 7000, which acted as a strong support throughout 2019.
High prob:
Entry = 6805 when retesting the level
Stop = 6735
TP = 6800
R:R = 3
Aggressive:
Entry = 6720
Stop = 6642
TP = 6800
R:R = 4
Happy trading:) follow for more of this kind of stuff!

FTSE100 - Bullish long-term setup and the possible Nest- Possible Nest configuration with a double 1-2 of different degrees
- Regular Flat correction in wave 2 Sub-minuette
- Leading diagonale in wave 1 Micro and double Flat WXY in wave 2
- Price actually trying to cross the EMA's and to consolidate above them
- Breakout and consolidation above the ATH would let the market go!
Next important long term target around 12.000 area and invalidation level @ 3460.7
F T S
Friendly. Trading. System.

UK100! (FTSE)Constant good news, has hit The FTSE upwards last week.
A pullback is possible and then the continuation of trend.

FTSE - Sell Signal 📉Entry details are shown on the chart.
We're only looking for TP3.
Trade history can be seen below this trade idea too for full transparency.
This isn't one of our main timeframes, but I'll be doing more testing on the H2 chart over the weekend.
------------------------------------------
I try and share as many ideas as I can as and when I have time. My trades are automated so I am not sat in front of a screen daily.
Jumping on random trade ideas 'willy-nilly' on Trading View trying to find that one trade that you can retire from is not a sustainable way to trade. You might get lucky, but it will always end one way.
------------------------------------------
Please hit the 👍 LIKE button if you like my ideas🙏
Also follow my profile, then you will receive a notification whenever I post a trading idea - so you don't miss them. 🙌
No one likes missing out, do they?
Also, see my 'related ideas' below to see more just like this.
Interested in access to my strategy so you can be in these trades the moment they're valid? Drop me a DM .
The stats for this pair are shown below too.
Thank you.
Darren


UK100 H4: Market BUY now TP +350 points(SL/TP)(NEW)Why get subbed to to me on Tradingview?
-TOP author on TradingView
-15+ years experience in markets
-Professional chart break downs
-Supply/Demand Zones
-TD9 counts / combo review
-Key S/R levels
-No junk on my charts
-Frequent updates
-Covering FX/crypto/US stocks
-24/7 uptime so constant updates
UK100 H4: Market BUY now TP +350 points(SL/TP)(NEW)
IMPORTANT NOTE: speculative setup. do your own
due dill. use STOP LOSS. don't overleverage.
🔸 Summary and potential trade setup
::: UK100 H4/candle chart review/outlook
::: speculative XABCD setup in progress
::: market BUY/HOLD TP +350 points
::: 5% upside in this market mid-term
::: sellers will come later from overhead
::: valid TP BULLS is 7050
::: recommended strategy: BUY/HOLD TP +325 points
::: SL below recent lows
::: low risk setup / bounce very likely now
::: just buy/hold low and get paid
::: do not expect fast/miractle gains
::: swing trade setup requires patience
::: good luck traders!
🔸 Supply/Demand Zones
::: N/A
::: N/A
🔸 Other noteworthy technicals/fundies
::: TD9 /Combo update: N/A
::: Sentiment: BULLS
::: Sentiment outlook short-term: BULLS
RISK DISCLAIMER:
Trading Crypto, Futures , Forex, CFDs and Stocks involves a risk of loss.
Please consider carefully if such trading is appropriate for you.
Past performance is not indicative of future results.
Always limit your leverage and use tight stop loss.

UK100- Expanded Flat patternIn the 240-minute chart, due to the 5 descending wave movement to the range of 6315, there is a scenario that, we encounter 5 more downtrend waves. The corrective movement of these 5 waves have been completed in the range of 6793 and the first wave from point 3/C has been finished in the range of 6535. In wave 2, the Expanded Flat pattern is formed.
By break down of the downtrend line in the 60-minute chart, hopefully, we can expect the continuation of the downtrend with 6150 targets.

FTSE 100 (UK100) - Simple and Clear MovesUK100 has been making clear impulse correction impulse. On lower timeframes, watch for shorting opportunities e.g. break of trendline near the channel resistance.
More in-depth analysis in the links below.
Trade Safe!

FTSE 100 (UK100) - Simple and Clear MovesUK100 has been making clear impulse correction impulse. On lower timeframes, watch for shorting opportunities e.g. break of trendline near the channel resistance.
More in-depth analysis in the links below.
Trade Safe!


uk100 short ?i started this pair today and i think this is the bias for the next day what do you think guys.


UK100 - Further UpsideUK100 has been steady moves to the upside. It has broken out of a correction and making its move back up now.
UK100 - Further UpsideUK100 has been steady moves to the upside. It has broken out of a correction and making its move back up now.
