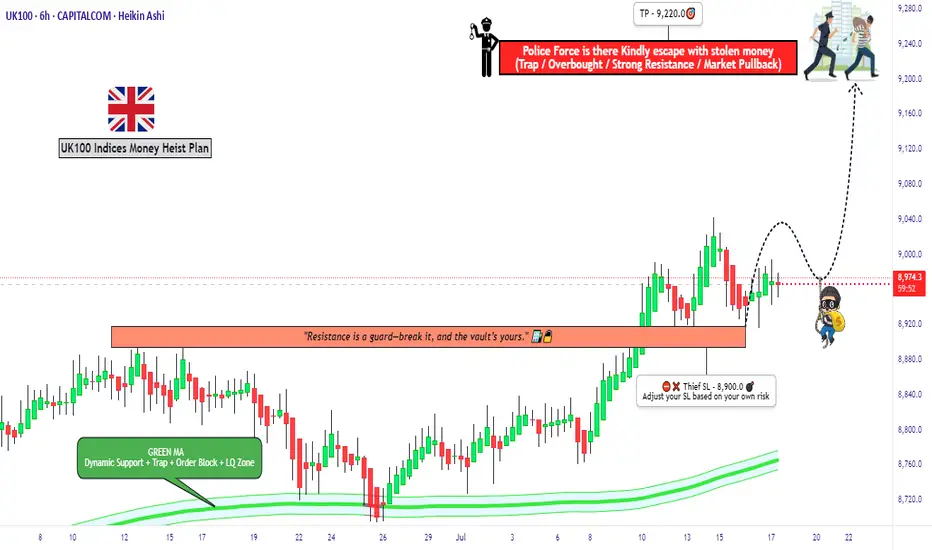
"UK100 Bulls Vault Open! Grab the Loot & Escape Early"🏴☠️💰"UK100 / FTSE100 Market Heist Blueprint" – A Thief Trading Operation for High-Profit Target Extraction 💼📈
🌍 Hola! Hi! Bonjour! Ola! Hallo! Marhaba!
To all the Market Robbers, Smart Thieves, and Strategic Money Makers — welcome to another Thief Trading Heist Plan™.
Ready your gear and charts — the UK100 / FTSE100 index is our next vault.
🔥Heist Objective: Swipe the Bullish Loot Before the Police Trap Hits! 🔥
Based on sharp Thief-style technical and macro-fundamental analysis, the market is showing bullish exhaustion and early signs of trap reversal zones. Our goal is clear: extract max value from the bulls and escape before the heat catches on.
🚨The current price action is nearing a Red Zone — high-risk area filled with potential police traps (supply zones, resistance, and bear setups). Timing and smart entries are key.
🎯 Strategy Overview (Day/Swing Trade)
Entry Plan:
🟢 “The Vault’s Open!” – Start accumulating long positions now or set buy limits near recent 15m/30m swing lows. Layer your entries (DCA method) for better control and efficiency.
Stop Loss (SL):
🔐 SL below recent swing low on 4H timeframe (~8900.0)
Adjust based on your risk appetite, position size, and how many layered orders you've got lined up.
Target Zone (TP):
🏁 Primary Target: 9220.0
Always be ready to exit early if market signals shift. He who escapes lives to rob another day.
🧲 Scalpers Note:
Only operate long within this framework. Big capital players can jump in earlier; others can trail behind with the swing traders. Always use trailing SLs to lock in stolen loot and reduce exposure.
📰 What's Driving the Market?
Current bullish sentiment is backed by:
Fundamental strength
Sentiment & COT reports
Macro data & intermarket correlation
Geopolitical & institutional flow analysis
Stay updated through your reliable sources and plug into key market dynamics and positioning reports.
⚠️ Trading Precaution:
🚫 Avoid new positions during high-impact news
💼 Manage your trades with care
🔁 Use trailing SLs to secure profits during volatility
💥Boost the Robbery – Support the Crew💥
If this heist plan aligns with your mission, smash that Boost button. Support the thief movement, and let’s build a strong trading crew where money is made with precision, strategy, and no mercy. 💰🤑
🔒 Final Notes (Read Before You Rob):
📌 This is a strategic trade setup, not financial advice. Always tailor the plan based on your risk management, capital size, and market conviction.
📌 Markets evolve. Stay alert, adapt fast, and trade like a thief — unseen, smart, and always two steps ahead.
💬Drop your thoughts, results, or setups below — and if you're in, type "HEIST READY" in the comments.
Stay tuned, another plan is on the way... 🏴☠️📊🔥
Uk100analysis
UK100 short - head and shoulders H4Risk/ reward = 4.6
Entry = 8 998.5
Stop loss = 9 034.2
Take profit level 1 = 8 859.8
Take profit level 2 = 8 794
Still need confirmation,
Waiting for H4 candle to close at 23.00 and will need to validate volume.

FTSE 100 Surges Towards Record HighFTSE 100 Surges Towards Record High
Today saw the release of new data on the UK labour market.
According to official statistics, the number of payrolled employees in the UK fell by 55,000 (0.2%) between March and April 2025. Over the broader period from February to April 2025, the number declined by 78,000 (0.3%).
In response to the drop in employment, the UK’s FTSE 100 index (UK 100 on FXOpen) jumped sharply, rising close to the 8,900 mark — near its all-time high reached in early March this year.
Market participants likely interpreted the weakening labour market as an additional argument in favour of interest rate cuts by the Bank of England. Such a move would be seen as supportive of the economy and a bullish factor for equities.
Technical Analysis of the FTSE 100 (UK 100 on FXOpen)
From a technical perspective:
→ The FTSE 100 continues to trade within an ascending channel (shown in blue);
→ Today’s bullish momentum broke through the resistance line from below — a level that had previously capped the upward movement within the channel.
If the bulls can maintain the price above the 8,860 level, the likelihood increases for a continued uptrend and a potential new all-time high for the FTSE 100 index.
This article represents the opinion of the Companies operating under the FXOpen brand only. It is not to be construed as an offer, solicitation, or recommendation with respect to products and services provided by the Companies operating under the FXOpen brand, nor is it to be considered financial advice.

UK100/FTSE100 - time to short slowlyTeam, let's kill the UK100/FTSE100
last night, we got target hit both in 15 minutes during LIVE trading. Today we are going to short the UK slowly according to the strategy set out
Please note: Target 1 will be around 8778-8771
Once it hits, take 70% and bring a stop loss to BE
Target 2 - will unload the remaining 30% volume.
Please carefully look at the chart. There is a section where if the market goes against you, please double up at that section; that would allow us to make double the profit. However, when it pulls down to our original short, we can take those profits.

UK100 - FTSE100 - TIME TO MAKE MILLION ON SHORTHi Everyone,
I hope yesterday you enjoy 450-500 points on DOW/US30 when we have two long and two target hit
last 2-3 days we avoid the US30 because we wait for the good set up.
Same as UK we short last two day but we didn’t short yesterday.
Now you are going to kill the UK100 together
Please watch the CHART carefully as we want to EXTRA Short price at 8668-8682 ranges
DO not be afraid. I am PRO trader if you go to my profile and check out and click the video.
I show you how to make $5000 simple every week.
Also follow the 1st target at 6622-15. TAKE partial 30%-50% and BRING stop loss to BE
NOTE: once you took and it move back hit stop loss - SHORT AGAIN,
Second target at 8596-8582
Hope you enjoy the TRADE yesterday on US30, you can check trading view chart post yesterday!

UK100 - Short Term Sell Idea Update!!!Hi Traders, on March 20th I shared this idea "UK100 - Expecting The Price To Drop Lower Further"
I expected the price to drop lower further. You can read the full post using the link above.
Price dropped lower further as expected!!!
If you enjoy this idea, don’t forget to LIKE 👍, FOLLOW ✅, SHARE 🙌, and COMMENT ✍! Drop your thoughts and charts below to keep the discussion going. Your support helps keep this content free and reach more people! 🚀
-------------------------------------------------------------------------------------------------------------------
Disclosure: I am part of Trade Nation's Influencer program and receive a monthly fee for using their TradingView charts in my analysis.

FTSE UK100 Rebound: Navigating Fragile Markets & Resistance Zone📊 FTSE 100 Recovery in Focus: The FTSE 100 has bounced back 📈 after a sharp sell-off, showing signs of recovery. Here's a breakdown of the key points to consider:
📉 Recent Performance: After a steep 4.4% drop on Monday, the FTSE 100 rebounded by 1.9% (+144.29 points) to 7846.37. This recovery mirrors improved global market sentiment 🌏, with indices like the Nikkei 225 surging 6% 🚀 (source: Evening Standard).
🌍 Market Sentiment: Analysts warn that the recovery remains fragile ⚠️, with risks of volatility stemming from geopolitical tensions and trade concerns. However, bargain-hunting investors 🛒 have supported the rebound by targeting undervalued stocks.
📈 Technical Levels: The FTSE 100 is climbing from multi-month lows, with momentum suggesting a potential test of resistance levels. But the rally's sustainability hinges on broader market sentiment and key economic data 📊 (source: Saxo Group).
🧐 Analyst Views: While the recovery is promising, some experts caution it could be a "dead cat bounce" 🐱, where the rally fizzles out if negative news arises. This makes short-term trading decisions highly dependent on intraday developments.
💡 Trade Setup: With the current momentum, a buying strategy for a day trade 🎯 targeting resistance levels may be more favorable than selling at the current level. However, traders must closely monitor intraday sentiment and technical indicators to manage risks effectively.

UK100 "FTSE 100 INDEX CASH" Heist Plan (Swing Trade)🌟Hi! Hola! Ola! Bonjour! Hallo! Marhaba!🌟
Dear Money Makers & Robbers, 🤑💰✈️
Based on 🔥Thief Trading style technical and fundamental analysis🔥, here is our master plan to heist the UK100 "FTSE 100 INDEX CASH" market. Please adhere to the strategy I've outlined in the chart, which emphasizes long entry and short entry. 🏆💸"Take profit and treat yourself, traders. You deserve it!"💪🏆🎉
Entry 📈 :
"The loot's within reach! Wait for the breakout, then grab your share - whether you're a Bullish thief or a Bearish bandit!"
🏁Buy entry above 8760
🏁Sell Entry below 8450
📌However, I recommended to place buy stop for bullish side and sell stop for bearish side.
Stop Loss 🛑:
🚩Thief SL placed at 8600 (swing Trade Basis) for Bullish Trade
🚩Thief SL placed at 8700 (swing Trade Basis) for Bearish Trade
Using the 4H period, the recent / swing low or high level.
SL is based on your risk of the trade, lot size and how many multiple orders you have to take.
Target 🎯:
🏴☠️Bullish Robbers : TP 9080 (or) Escape Before the Target
🏴☠️Bearish Robbers : Primary TP - 8250 (&) Secondary TP - 8100 (or) Escape Before the Target
UK100 "FTSE 100 INDEX CASH" Market Heist Plan is currently experiencing a neutral trend,., driven by several key factors.
📰🗞️Get & Read the Fundamental, Macro, COT Report, Geopolitical and News Analysis, Sentimental Outlook, Intermarket Analysis, Index-Specific Analysis, Positioning and future trend targets.. go ahead to check 👉👉👉
📌Keep in mind that these factors can change rapidly, and it's essential to stay up-to-date with market developments and adjust your analysis accordingly.
⚠️Trading Alert : News Releases and Position Management 📰 🗞️ 🚫🚏
As a reminder, news releases can have a significant impact on market prices and volatility. To minimize potential losses and protect your running positions,
we recommend the following:
Avoid taking new trades during news releases
Use trailing stop-loss orders to protect your running positions and lock in profits
💖Supporting our robbery plan 💥Hit the Boost Button💥 will enable us to effortlessly make and steal money 💰💵. Boost the strength of our robbery team. Every day in this market make money with ease by using the Thief Trading Style.🏆💪🤝❤️🎉🚀
I'll see you soon with another heist plan, so stay tuned 🤑🐱👤🤗🤩

UK100 - Short Term Sell Idea Update!!!Hi Traders, on March 20th I shared this idea "UK100 - Expecting The Price To Drop Lower Further"
I expected the price to drop lower further. You can read the full post using the link above.
Price dropped lower as expected!!!
If you enjoy this idea, don’t forget to LIKE 👍, FOLLOW ✅, SHARE 🙌, and COMMENT ✍! Drop your thoughts and charts below to keep the discussion going. Your support helps keep this content free and reach more people! 🚀
-------------------------------------------------------------------------------------------------------------------
Disclosure: I am part of Trade Nation's Influencer program and receive a monthly fee for using their TradingView charts in my analysis.

FTSE 100: Can April's Seasonal Surge Overcome Fiscal Tightening?🌸 April: A Historically Bullish Month for the FTSE 100 📈
Over the past 25 years, April has consistently been the strongest month for the FTSE 100, delivering an average return of 2.28% and boasting a 76% win rate. 🌟 This seasonal strength is driven by several key factors:
📊 Earnings Season Momentum: April is a pivotal month for corporate earnings, with many FTSE 100 companies benefiting from a post-first-quarter earnings boost. 💼
💷 Fiscal Year-End Flows: UK-based funds often adjust their portfolios at the end of the tax year in early April, leading to a reallocation into equities. 🔄
💸 Dividend Reinvestment: As a high-dividend-yielding index, the FTSE 100 typically experiences dividend reinvestment flows in April, further supporting stock prices. 📈
Despite the challenging macroeconomic environment, these seasonal drivers suggest that the FTSE 100 could maintain its historical trend of strong April performance. Notably, even in years with intra-period declines of up to 6.88%, the index has managed to deliver positive returns during this period. 💪
🇬🇧 UK Fiscal Policy and Market Implications 💡
This year, the bullish seasonal trend for the FTSE 100 coincides with significant fiscal developments. On March 26, UK Chancellor Rachel Reeves delivered the Spring Statement, outlining measures to stabilize public finances amidst mounting economic pressures. 📜 According to the Office for Budget Responsibility (OBR), the UK is at risk of missing key fiscal targets, prompting the government to model spending cuts of up to 11%. Welfare programs and green investments 🌱 are expected to bear the brunt of these reductions.
Additionally, the Bank of England's stance on inflation remains a critical factor. 📉 Persistent inflation risks could lead to a more hawkish monetary policy, potentially weighing on rate-sensitive sectors within the FTSE 100. However, the index's strong seasonal pattern, driven by earnings momentum, fiscal year-end flows, and dividend reinvestments, provides a counterbalance to these headwinds. ⚖️
🔮 Outlook for April 2025 🌟
As of late March 2025, the FTSE 100 has shown resilience, with sectors such as energy ⚡ and homebuilders 🏠 leading gains ahead of the Spring Statement. While fiscal tightening and inflationary pressures present challenges, the historical strength of April, combined with supportive seasonal factors, suggests that the FTSE 100 could still deliver positive returns this month. 📅 Investors will closely monitor the impact of fiscal policy adjustments and the Bank of England's monetary stance as they navigate this critical period. 🧐
Not Financial Advice.

UK Inflation DeclinesUK Inflation Declines
Today, the latest UK Consumer Price Index (CPI) figures were released. According to ForexFactory:
The actual annual CPI came in at 2.8%,
Analysts had expected it to remain at the previous level of 3.0%.
As a result, the British pound weakened, and a slight spike in volatility was observed on the FTSE 100 stock index chart (UK 100 on FXOpen)
Technical Analysis of FTSE 100
In early March, bearish activity (indicated by an arrow) led to a break of the support level around 8757, which then acted as resistance.
However, as soon as bears pushed the price below the February low, bulls stepped in.
Currently, the UK stock index chart is forming a narrowing triangle, which can be interpreted as a sign of equilibrium between supply and demand. However, this pattern will eventually be broken.
It is possible that the release of significant news—such as developments in international trade tariffs—could disrupt the balance of supply and demand, triggering a trend movement for the FTSE 100 index (UK 100 on FXOpen).
This article represents the opinion of the Companies operating under the FXOpen brand only. It is not to be construed as an offer, solicitation, or recommendation with respect to products and services provided by the Companies operating under the FXOpen brand, nor is it to be considered financial advice.

UK100 - Expecting The Price To Drop Lower FurtherHi Traders, on March 11th I shared this "UK100 - Looking To Sell Pullbacks In The Short Term"
We expected to see correction prior to the bearish continuation. You can read the full post using the link above.
Price is moving as per the plan!!!
Based on the current scenario my bearish view still remains the same here.
We have bearish divergence in play based on the moving averages of the MACD and I expect the price to drop lower further until the strong resistance zone holds
If you enjoy this idea, don’t forget to LIKE 👍, FOLLOW ✅, SHARE 🙌, and COMMENT ✍! Drop your thoughts and charts below to keep the discussion going. Your support helps keep this content free and reach more people! 🚀
---------------------------------------------------------------------------------------------------------------------
Disclosure: I am part of Trade Nation's Influencer program and receive a monthly fee for using their TradingView charts in my analysis.

"UK100 / FTSE100" Indices Market Bullish Heist Plan🌟Hi! Hola! Ola! Bonjour! Hallo!🌟
Dear Money Makers & Thieves, 🤑 💰🐱👤🐱🏍
Based on 🔥Thief Trading style technical and fundamental analysis🔥, here is our master plan to heist the "UK100 / FTSE100" Indices Market. Please adhere to the strategy I've outlined in the chart, which emphasizes long entry. Our aim is the high-risk Red Zone. Risky level, overbought market, consolidation, trend reversal, trap at the level where traders and bearish robbers are stronger. 🏆💸Book Profits, Be wealthy and safe trade.💪🏆🎉
Entry 📈 : "The heist is on! Wait for the MA breakout (8850.00) then make your move - Bullish profits await!"
however I advise to placing the Buy Stop Orders above the breakout MA or placing the Buy limit orders within a 15 or 30 minute timeframe. Entry from the most recent or closest low or high level should be in retest.
Stop Loss 🛑: Thief SL placed at 8720.00 (swing Trade Basis) Using the 4H period, the recent / Swing Low or High level.
SL is based on your risk of the trade, lot size and how many multiple orders you have to take.
Target 🎯: 9150.00 (or) Escape Before the Target
🧲Scalpers, take note 👀 : only scalp on the Long side. If you have a lot of money, you can go straight away; if not, you can join swing traders and carry out the robbery plan. Use trailing SL to safeguard your money 💰.
📰🗞️Fundamental, Macro, COT, Sentimental Outlook:
"UK100 / FTSE100" Indices Market is currently experiencing a bullish trend,., driven by several key factors.
🟤Market Overview
Current Price: 8740.00
30-Day High: 8920.00
30-Day Low: 8450.00
30-Day Average: 8630.00
🔵Fundamental Analysis
Economic Trends: The UK economy is expected to grow, driven by a rebound in consumer spending and investment
Interest Rates: The Bank of England is expected to maintain low interest rates, supporting the UK stock market
🟢Macro Economics
Global Economic Trends: The ongoing global economic recovery is expected to drive up demand for UK exports
Inflation Rate: Global inflation is expected to rise to 3.8% in 2025, potentially increasing demand for UK goods and services
Interest Rates: Central banks are expected to maintain low interest rates in 2025, supporting stock markets
🟡COT Data
Non-Commercial Traders (Institutional):
Net Long Positions: 52%
Open Interest: 120,000 contracts
Commercial Traders (Companies):
Net Short Positions: 28%
Open Interest: 80,000 contracts
Non-Reportable Traders (Small Traders):
Net Long Positions: 20%
Open Interest: 40,000 contracts
COT Ratio: 1.9 (indicating a bullish trend)
🟠Sentimental Analysis
Institutional Sentiment: 58% bullish, 42% bearish
Retail Sentiment: 55% bullish, 45% bearish
Market Mood: The overall market mood is bullish, with a sentiment score of +25
🔴Positioning Analysis
Institutional Traders: Net long positions increased by 8% over the past week, indicating growing bullish sentiment
Retail Traders: Net long positions decreased by 3% over the past week, indicating decreasing bullish sentiment
Leverage: The average leverage used by traders has increased to 2.8, indicating growing confidence in the market
⚫Overall Outlook
The overall outlook for UK100 is bullish, driven by a combination of fundamental, technical, and sentimental factors. The expected growth in the UK economy, low interest rates, and bullish market sentiment are all supporting the bullish trend. However, investors should remain cautious of potential downside risks, including changes in global economic trends and unexpected regulatory developments.
⚠️Trading Alert : News Releases and Position Management 📰 🗞️ 🚫🚏
As a reminder, news releases can have a significant impact on market prices and volatility. To minimize potential losses and protect your running positions,
we recommend the following:
Avoid taking new trades during news releases
Use trailing stop-loss orders to protect your running positions and lock in profits
📌Please note that this is a general analysis and not personalized investment advice. It's essential to consider your own risk tolerance and market analysis before making any investment decisions.
📌Keep in mind that these factors can change rapidly, and it's essential to stay up-to-date with market developments and adjust your analysis accordingly.
💖Supporting our robbery plan will enable us to effortlessly make and steal money 💰💵 Tell your friends, Colleagues and family to follow, like, and share. Boost the strength of our robbery team. Every day in this market make money with ease by using the Thief Trading Style.🏆💪🤝❤️🎉🚀
I'll see you soon with another heist plan, so stay tuned 🤑🐱👤🤗🤩

UK100 - Looking To Sell Pullbacks In The Short TermH1 - Bearish trend pattern
Currently it looks like a pullback is happening
Until the strong resistance zone holds I expect the price to move lower further after pullbacks.

UK100 (FTSE)-Weekly forecast, Technical Analysis & Trading IdeasMidterm forecast:
8380.25 is a major support, while this level is not broken, the Midterm wave will be uptrend.
Technical analysis:
A trough is formed in daily chart at 8611.20 on 02/21/2025, so more gains to resistance(s) 8854.99, 9000.00, 9100.00 and more heights is expected.
Take Profits:
8664.21
8765.00
8854.99
9000.00
9100.00
__________________________________________________________________
❤️ If you find this helpful and want more FREE forecasts in TradingView,
. . . . . . . . Hit the 'BOOST' button 👍
. . . . . . . . . . . Drop some feedback in the comments below! (e.g., What did you find most useful? How can we improve?)
🙏 Your support is appreciated!
Now, it's your turn!
Be sure to leave a comment; let us know how you see this opportunity and forecast.
Have a successful week,
ForecastCity Support Team

UK100 (FTSE)-Weekly forecast, Technical Analysis & Trading IdeasMidterm forecast:
8380.25 is a major support, while this level is not broken, the Midterm wave will be uptrend.
Technical analysis:
A trough is formed in daily chart at 8006.10 on 12/20/2024, so more gains to resistance(s) 8833.83, 9000.00, 9100.00 and more heights is expected.
Take Profits:
8664.21
8765.00
8833.83
9000.00
9100.00
__________________________________________________________________
❤️ If you find this helpful and want more FREE forecasts in TradingView,
. . . . . . . . Hit the 'BOOST' button 👍
. . . . . . . . . . . Drop some feedback in the comments below! (e.g., What did you find most useful? How can we improve?)
🙏 Your support is appreciated!
Now, it's your turn!
Be sure to leave a comment; let us know how you see this opportunity and forecast.
Have a successful week,
ForecastCity Support Team

UK100 (FTSE)-Weekly forecast, Technical Analysis & Trading IdeasMidterm forecast:
8380.25 is a major support, while this level is not broken, the Midterm wave will be uptrend.
Technical analysis:
The ascending flag taking shape suggests we will soon see another leg higher.
A trough is formed in daily chart at 8006.10 on 12/20/2024, so more gains to resistance(s) 8664.21, 8765.00, 9000.00 and more heights is expected.
Take Profits:
8083.43
8183.03
8242.89
8380.25
8485.05
8664.21
8765.00
9000.00
__________________________________________________________________
❤️ If you find this helpful and want more FREE forecasts in TradingView,
. . . . . . . . Hit the 'BOOST' button 👍
. . . . . . . . . . . Drop some feedback in the comments below! (e.g., What did you find most useful? How can we improve?)
🙏 Your support is appreciated!
Now, it's your turn!
Be sure to leave a comment; let us know how you see this opportunity and forecast.
Have a successful week,
ForecastCity Support Team

FTSE 100 Index May Reach 8500FTSE 100 Index May Reach 8500
As shown on the chart of the UK stock index FTSE 100 (UK 100 on FXOpen):
→ It has risen by over 3% in three days;
→ It is near the record high set in May last year and may reach the psychological level of 8500 points.
Bullish sentiment has been supported by yesterday's news of GDP recovery – according to media reports, the economy grew by 0.1% in November 2024 (compared to a previous decline of 0.1%), primarily driven by the dominant services sector.
Technical analysis of the FTSE 100 (UK 100 on FXOpen) chart shows that since mid-2024, the index has predominantly fluctuated within the 8000–8400 range, only briefly moving beyond it, which was accompanied by spikes in the RSI indicator.
The current RSI level indicates strong overbought conditions, making the FTSE 100 (UK 100 on FXOpen) vulnerable to a pullback. Should this occur, it will provide important insights into the strength of demand. This could be assessed by the index’s ability to remain above the 8333 support level and the lower boundary of the ascending channel (marked in blue).
Potential challenges for bulls are highlighted by MT Newswires, which report that analysts forecast higher inflation and weaker growth in 2025, amid expectations of a significant rise in labour costs.
This article represents the opinion of the Companies operating under the FXOpen brand only. It is not to be construed as an offer, solicitation, or recommendation with respect to products and services provided by the Companies operating under the FXOpen brand, nor is it to be considered financial advice.

UK100 "FTSE 100 Index Cash" Indices Market Bearish Heist Plan🌟Hi! Hola! Ola! Bonjour! Hallo!🌟
Dear Money Makers & Robbers, 🤑 💰
Based on 🔥Thief Trading style technical and fundamental analysis🔥, here is our master plan to heist the UK100 "FTSE 100 Index Cash" Indices market. Please adhere to the strategy I've outlined in the chart, which emphasizes long entry. Our aim is the high-risk Red Zone. Risky level, overbought market, consolidation, trend reversal, trap at the level where traders and bearish robbers are stronger. Be wealthy and safe trade.💪🏆🎉
Entry 📈 : You can enter a Bull trade at any point.
however I advise placing Buy limit orders within a 15 or 30 minute timeframe. Entry from the most recent or closest low or high level should be in retest.
Stop Loss 🛑: Using the 2H period, the recent / nearest low or high level.
Goal 🎯: 8380 (or) escape Before the Target
Scalpers, take note 👀 : only scalp on the Long side. If you have a lot of money, you can go straight away; if not, you can join swing traders and carry out the robbery plan. Use trailing SL to safeguard your money 💰.
Warning⚠️ : Our heist strategy is incompatible with Fundamental Analysis news 📰 🗞️. We'll wreck our plan by smashing the Stop Loss 🚫🚏. Avoid entering the market right after the news release.
Fundamental Outlook 📰🗞️
Based on the fundamental analysis, I would conclude that the UK100 FTSE 100 Index Cash is:Bullish
Reasons:
Strong economic growth: The UK's economy is expected to grow at a rate of 2.0% in 2023, driven by a strong labor market, increasing business investment, and a rebound in the housing market.
Low unemployment rate: The UK's unemployment rate is at a historic low of 3.8%, which is expected to support consumer spending and economic growth.
Increasing corporate earnings: UK companies are expected to report increasing earnings in 2023, driven by a strong global economy and a competitive pound.
Monetary policy support: The Bank of England (BoE) has kept interest rates at a low level of 1.0%, which is expected to support borrowing and spending in the economy.
Fiscal policy support: The UK government has announced a series of fiscal stimulus measures, including tax cuts and infrastructure spending, which are expected to support economic growth.
However, it's essential to consider the following risks:
Brexit uncertainty: The ongoing Brexit negotiations and uncertainty surrounding the UK's future relationship with the EU could impact the UK's economy and stock market.
Global economic slowdown: A slowdown in global economic growth could reduce demand for UK exports and impact the country's economic growth.
Trade tensions: Escalating trade tensions between the UK and other countries, particularly the US and EU, could impact the UK's trade balance and economic growth.
Bullish Factors:
Strong global economic growth, driven by strong consumer spending and investment.
Low interest rates, which can increase demand for stocks and reduce demand for bonds.
Potential for a rebound in the UK economy, driven by a resolution to Brexit uncertainty and a pickup in global trade.
Growing investment demand for UK stocks, driven by their potential for long-term growth and dividend yields.
Diversification benefits of investing in the UK stock market, which can reduce portfolio risk and increase returns.
Market Sentiment:
Bullish sentiment: 70%
Bearish sentiment: 30%
Neutral sentiment: 0%
Please note that this is a general analysis and not personalized investment advice. It's essential to consider your own risk tolerance and market analysis before making any investment decisions.
Take advantage of the target and get away 🎯 Swing Traders Please reserve the half amount of money and watch for the next dynamic level or order block breakout. Once it is resolved, we can go on to the next new target in our heist plan.
Keep in mind that these factors can change rapidly, and it's essential to stay up-to-date with market developments and adjust your analysis accordingly.
💖Supporting our robbery plan will enable us to effortlessly make and steal money 💰💵 Tell your friends, Colleagues and family to follow, like, and share. Boost the strength of our robbery team. Every day in this market make money with ease by using the Thief Trading Style.🏆💪🤝❤️🎉🚀
I'll see you soon with another heist plan, so stay tuned 🫂

UK100 Short Term Sell IdeaH4 - Bearish trend pattern
Strong bearish momentum
Until the strong resistance zone holds I expect the price to move lower further after pullbacks.

UK100 / FTSE100 Indices Market Bullish Heist PlanHi there! Dear Money Makers & Robbers, 🤑 💰
Based on Thief Trading style technical analysis, here is our master plan to heist the UK100 / FTSE100 Indices market. Please adhere to the strategy I've outlined in the chart, which emphasizes long entry. Our aim is the high-risk Red Zone. Risky level, overbought market, consolidation, trend reversal, trap at the level where traders and bearish robbers are stronger. So Be Careful, wealthy and safe trade.
Entry 📈: Acceptable anywhere; I advise placing buy limit orders within a 15-minute Chart. The entry for the Recent/Nearest Low Point should be in pullback.
Stop Loss 🛑: Using the 3H period, the recent/nearest low level.
Goal 🎯: 8470.0
Scalpers, take note: only scalp on the long side. If you have a lot of money, you can go straight away; if not, you can join swing traders and carry out the robbery plan. Use trailing SL to safeguard your money 💰.
Warning : Our heist strategy is incompatible with Fundamental Analysis news 📰 🗞️. We'll wreck our plan by smashing the Stop Loss 🚫🚏. Avoid entering the market right after the news release.
Take advantage of the target and get away 🎯 Swing Traders Please reserve the half amount of money and watch for the next dynamic level or order block breakout. Once it is resolved, we can go on to the next new target in our heist plan.
💖Supporting our robbery plan will enable us to effortlessly make and steal money 💰💵 Tell your friends, Colleagues and family to follow, like, and share. Boost the strength of our robbery team. Every day in this market make money with ease by using the Thief Trading Style.
I'll see you soon with another heist plan, so stay tuned 🫂

UK100 / FTSE 100 Index Bullish Robbery PlanHallo! My Dear Robbers / Money Makers & Losers, 🤑 💰
This is our master plan to Heist UK100 / FTSE 100 Index Market Market based on Thief Trading style Technical Analysis.. kindly please follow the plan I have mentioned in the chart focus on Long entry. Our target is Red Zone that is High risk Dangerous level, market is overbought / Consolidation / Trend Reversal / Trap at the level Bearish Robbers / Traders gain the strength. Be safe and be careful and Be rich.
Entry 📈 : Can be taken Anywhere, What I suggest you to Place Buy Limit Orders in 15mins Timeframe Recent / Nearest Low Point take entry in pullback.
Stop Loss 🛑 : Recent Swing Low using 1h timeframe
Attention for Scalpers : Focus to scalp only on Long side, If you've got a lot of money you can get out right away otherwise you can join with a swing trade robbers and continue the heist plan, Use Trailing SL to protect our money 💰.
Warning : Fundamental Analysis news 📰 🗞️ comes against our robbery plan. our plan will be ruined smash the Stop Loss 🚫🚏. Don't Enter the market at the news update.
Loot and escape on the target 🎯 Swing Traders Plz Book the partial sum of money and wait for next breakout of dynamic level / Order block, Once it is cleared we can continue our heist plan to next new target.
💖Support our Robbery plan we can easily make money & take money 💰💵 Follow, Like & Share with your friends and Lovers. Make our Robbery Team Very Strong Join Ur hands with US. Loot Everything in this market everyday make money easily with Thief Trading Style.
Stay tuned with me and see you again with another Heist Plan..... 🫂

UK100 Short Term Sell IdeaH4 - Bearish convergence
Currently it looks like a pullback is happening
No opposite signs
H1 - Bearish trend pattern
Currently it looks like a pullback is happening
Until the two strong resistance zones hold my short term view remains bearish here.
