Uk100long
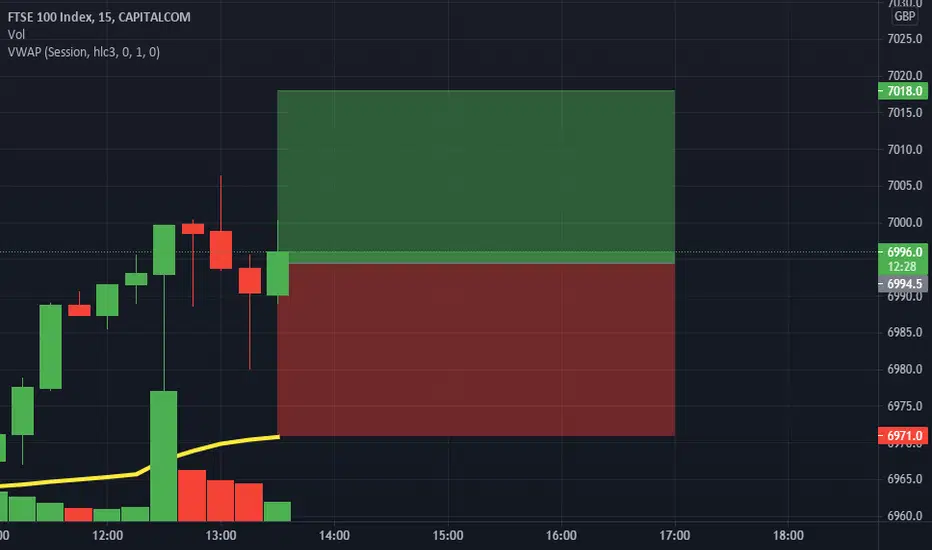
FTSE100 Possible sell and buy setups with entrys.Good evening all, I am overall forecasting a bull move coming in for the FTSE 100 shortly... this is due to price failing to maintain the HH HL price action.
HOWEVER....
We all know we trade what the market gives us which is why I always have multiple entry's for both bullish and bearish should price decide to go against my forecast. Now, every entry you see is based upon a key level, they are not just placed in random places...
Of course guys this goes without saying but this is just for educational purposes and copy this trade at YOUR OWN RISK.
Remember never risk more than 1% and aim for at least a 2:1 RR.
Good luck for the rest of the month guys and I am also open to hear you guys forecast for the week ahead.

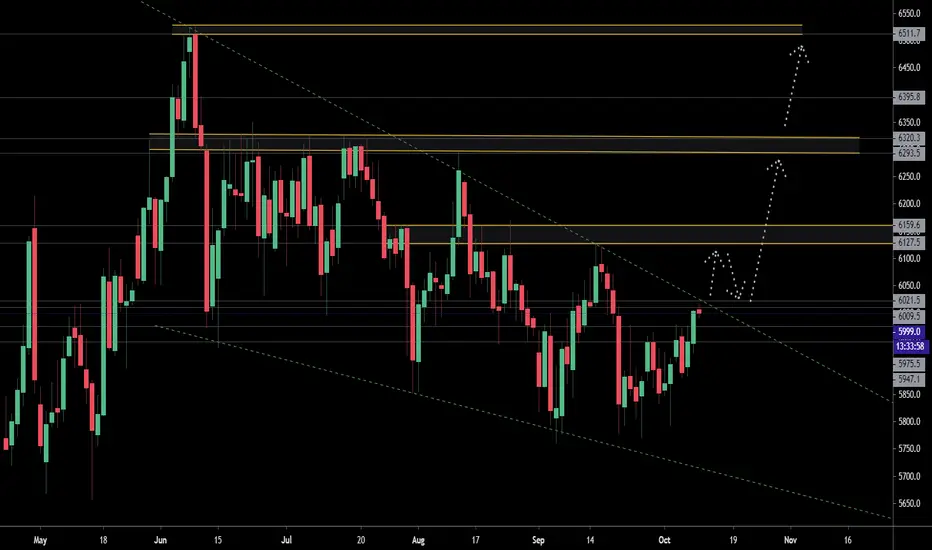
LONG POSITIONFTSE index considering a final lap towards new highs in coming weeks
Let's see how this goes from here.
If you find this helpful and want more FREE Updates on TradingView
. . . . . Please show your support back,
. . . . . . . . Hit the 👍 LIKE button,
. . . . . . . . . . . Drop some feedback below in the comment!
❤️ Your Support is very much 🙏 appreciated! ❤️
💎 Want us to help you become a better Forex trader?
Now, It's your turn!
Be sure to leave a comment let us know how do you see this opportunity and forecast.
Trade well, ❤️
1_GFX English Support Team ❤️

2 Possible Longs FTSE100 UK100Longterm hold small lot size - holding for the next 2-3 weeks as the UK starts to reopen i see growth! As always move SL as you secure a good amount of profit.

FTSE100 - Fresh highs incomingThe FTSE is currently sat at strong support. Sellers tried to push price lower, but the index was bought back up to form a pinbar (red arrow). Lower BB also sits at this point (see %B in bottom window).
Considering the lacklustre fall from the rising wedge and the subsequent pin bar, we can expect 6800 to break (see how long price spent lingering around the level).
The next resistance is ~6838, so a break and restest of the 6800 is likely and will be the perfect high probability entry.
An aggressive entry would be at open on Monday (I personally will probably take this based on the pinbar with a stop below the low).
Target is the psychological level of 7000, which acted as a strong support throughout 2019.
High prob:
Entry = 6805 when retesting the level
Stop = 6735
TP = 6800
R:R = 3
Aggressive:
Entry = 6720
Stop = 6642
TP = 6800
R:R = 4
Happy trading:) follow for more of this kind of stuff!

LONG POSITIONI would love to see some Buyers kick in and make some strong move
To the upside i can see price going long on a longer period of time
Bear in mind we can see a bit of Retracement Before some big impulse Move
to our final Target
If you find this helpful and want more FREE Updates on TradingView
. . . . . Please show your support back,
. . . . . . . . Hit the 👍 LIKE button,
. . . . . . . . . . . Drop some feedback below in the comment!
❤️ Your Support is very much 🙏 appreciated! ❤️
💎 Want us to help you become a better Forex trader?
Now, It's your turn!
Be sure to leave a comment let us know how do you see this opportunity and forecast.
Trade well, ❤️
1_GFX English Support Team ❤️

UK100- Expanded Flat patternIn the 240-minute chart, due to the 5 descending wave movement to the range of 6315, there is a scenario that, we encounter 5 more downtrend waves. The corrective movement of these 5 waves have been completed in the range of 6793 and the first wave from point 3/C has been finished in the range of 6535. In wave 2, the Expanded Flat pattern is formed.
By break down of the downtrend line in the 60-minute chart, hopefully, we can expect the continuation of the downtrend with 6150 targets.


FTSE 100 Looking For Long After RetraceThis is making a retrace after spiking 3 days ago. I am looking for an entry around 0.5 Fibonacci as this aligns with some previous resistance although it is best to wait for confirmation as it could drop further. Once we see a rebound target will be at a new high and where it will meet resistance of 7004.

FTSE Enter Long on RetraceFTSE 100 has had a big push higher, want to see a retrace before entering a long. Once it peaks on the current spike look for retrace to around 0.382 Fibonacci for entry. I have set target at a new high of 7004.4 although there will likely be some resistance at the previous high so can also take profit there and re-enter on the retrace from there.


UK100 LONG BIAS Price in the short term is in a bearish decline, while the medium to long term trend is bullish. Price has declined to a key area of previous resistance and potentially support on the Daily timeframe. Based on price action I believe this could be a key area where price could reverse to test previous broken support. I don't expect price to hit this target till next week.

UK100 (MY SNIPEST ENTRY)UK100 is going to buy because we have a break of structure for potential upside movement, (DAILY STRUCTURE)

UK100 Stock, Again bought UK100 indexUK stock index is retracing a little after the bit impulsion that we predicted in our previous Analysis. If you are not in open position you can buy One at the CMP and second buy limit will be 6550.
If you like my idea just hit the LIKE button.

UK100 Ascending Triangle - Long OrderUK100 Ascending Triangle Long Position
Entry: £6,861.3
TP & RR: £7,036.9 (2.21)
Stop Loss: £6,781.8
REASONS FOR THE TRADE
Unfortunately, this is not a trade that I will take since I already have enough positions for the day and my system prohibits me from being overexposed. From a technical point, this seems like a sound trade - testing lower trendline in ana ascending triangle and the Market Flow indicator printing a divergence. My sixth sense tells me, however, that this trendline may not hold... but it's usually wrong, that's why I count on technical indicators. The Stop Loss is far enough for you to evaluate if the price will drop down or will bounce up and start heading towards the target.
I will not count this trade in my journal but I will continue to update it as it goes.

UK100 Stock, Just bought UK100 indexAs UK100 index is looking a good buy position after Brexit Deal between UK and Europe is supporting UK Assets.
If you like this idea, Please give it a thumbs up!

UK100This could be based on the fact that the lockdown could be eased. And the vaccine can be tweaked to tackle the new covid strain.


UK100 to Long?Market analysis pointing to some decent bull in store after channel break to the upside.
Trade at your own risk ...
UK100 Index Trade Idea Gonna go ahead and steadily started building new buy positions on this asset, my main target is 6250 for the most part.


UK100 6024.3 - 0.3 % LONG IDEA * STRUCTURE & REVERSAL Hey Every-one
Here's an idea on the FTSE 100 looking at it from the 4H chart which is trading in a descending triangle structure on a couple of time-frames but more focus on the 4H. The index just tested the bottom of structure or rather support looking for a push up with the bulls to respect the descending triangle structure before we see any break-out of any sort.
let's see how it goes..
HAPPY TRADING EVERYONE
_________________________________________________________________________________________________________________________
ENTRY & SL - FOLLOW YOUR RULES
TP 1 - 6070.5
TP 2 - 6111.0
SL - 5985.5
RISK-MANAGEMENT
PERIOD - SWING TRADE
__________________________________________________________________________________________________________________________
If this idea helps with your trading plan kindly leave a like definitely appreciate it.
