UKOIL/CRUDE OIL - PUMP to 184$\5555In this tutorial idea, I have shown a custom numerological fib that can work as a support, resistance and buffer zone for local and global trend reversal. Also Gann, which indicates reversals in the trend and all this together can be used for both global and local work. Also we see that exactly from the high we have had 5555 days for the strong decline that is happening right now, I expect a test of the buffer zone and strong support at 0.444 fibs and a reversal up. Often, if they want to make a massive dump and trend reversal, a deep call is made behind 0.333 fib and even a possible test of 0.222 fib and after a strong decline, this did not happen, we gently touched 0.333 on day 5555 and flew down. Nothing more than a local knockout and liquidity gathering before the flight due to the complicated geopolitical situation.
Crude Oil Brent

CRUDE OIL (WTI) Your Trading Plan For Next Week 🛢️
What a pump on WTI Crude Oil.
Following the geopolitical tensions, the market bounced nicely on Friday.
Ahead I see a strong daily resistance: 88.4 - 88.6 area is the last resort
for the sellers. If the price breaks and closes above that on a daily next week,
it will be a strong bullish signal for you.
You can anticipate a bullish continuation all the way up to 93.45 level then.
Just remember, that first you need a breakout confirmation.
❤️Please, support my work with like, thank you!❤️

CRUDEOILCrude oil is trading on a weekly demand zone and have taken a bounce, expecting the target at the upper end of the range.

US Oil Long Trade - SL Previous Swing LowMany Fibonacci and Harmonic Confirmations
Bullish - Butterfly Harmonic ,
With Expanded Flat ABC Elliot
C = 1.618 A
1.618 AB = CD ( PRZ As per AB=CD Pattern )
0.50 Retracement Levels
Trade at your own decision , I'm not a financial adviser.

USOIL - Waiting For Breakout...
Hey Traders !
The USOIL Price Broke a Strong Daily Support Level (85.90 - 84.15)
Currently,
-This Support Level Becomes a New Resistance Level.
-The Support Line is Broken.
So, I Expect a Bearish Move📉
i'm waiting for breakout...
-----------
TARGET: 78.60🎯
___________
if you agreed with this IDEA, please leave a LIKE, SUBSCRIBE or COMMENT!

TradePlus-Fx|BRENT: closing the gap💬 Description: Oil quotes have been holding by buyers at current levels after the gap. The reason for the formation of the gap was the aggravated geopolitical situation in the Middle East. It should be noted that buyers even "overplaying", but there is no result, no growth is observed. In addition, it was no coincidence that the price hovered at the local level of 87.45, which is a medium-term area of liquidity accumulation. Based on the traditional our metrics, most likely in the near future we should expect a fall in order to cover the gap, as well as update local minimums.
➖➖➖➖➖➖➖
🚀Thank for your BOOSTS 🚀
👇Share your views and FOLLOW US 👇

OIL WILL GO TO THE MOON FIRST !THE INTELLIGENCE SERVICE GAME
It is IMPOSSIBLE that the intelligence services (CIA, NSA, MOSSAD, SVR, MSS, ISI, RAW, MI6...) that have invested billions and billions in monitoring "every click," every "audio" message left on an encrypted messaging platform (i.e. Pegasus), COULD NOT have been aware that HAMAS was arming itself in preparation for an operation and suddenly became ineffective!
So if all the services were aware of the "scam," how did the opposing party anticipate managing this potential stumbling block?
SET MOOD AND ESTABLISH THE SCENE BEFORE THE ARMS RACE BEGINS THEN COMODITIES WILL FOLLOW
The internal security of a state depends on the quality of services provided by its protecting intelligence agencies
The failure of Western services in prediction, but above all, the conviction that the Russians were 30 years behind, becomes glaringly evident. Otherwise a part of them knew it (CIA, MI6) and chose to misinform EVERYONE to sow chaos with the aim of boosting markets and generating demand.
I always claimed this difference between USA and Russia in the fact that one are Poker players, and the others are chess players.
In poker, it's not just about knowing how to lie, but also about knowing how to raise the stakes or play probabilities to determine the strongest hand on the table.
The lack of information about one's potential can only be estimated through a provocation close to the borders; this is the opportunity the Americans seized in 2014 to overthrow the Ukrainian gvt. and repeat what they tried in 1936 by arming Poland (the former concept of the sanitary cordon).
How can they switch from a theater of war into another ? Easy ! It is a question of manipulating public opinion as they already did in 9/11 to SAVE AMERICA from the crisis.
Generally, we learn from our mistakes to avoid repeating them. And it's during an armed conflict that we delve into history to understand its origins. One must believe that only in fashion does a cyclical phenomenon exist. Without wanting to resort to sarcasm, artificially creating a conflict by using HAMAS to justify a local intervention is truly treating people like fools.
The image war is primarily the one that targets public opinion at the expense of the invisible mechanisms that are set in motion, in order to make the 'pill' go down more smoothly.
DEDOLLARIZATION TAKES A BACKSEAT, OIL FIRST !
Do not ignore that the USMCA (formerly NAFTA) still remains the largest consumer market ahead of the EEA.
What is vulnerable or fragile for one state is an opportunity for another.
The composition of teams is now known to all. The G7 against the BRICs, gradually marking the end of a G20, some countries seize an opportunity in investing in newly available areas (Africa is an example).
As we observe a blatant loss of the former Western colonies, on which the latter built its wealth, it is entirely normal to see a conservative mechanism at play, detaching/tearing away the European zone at all costs to preserve the development of its own economic activity, much like a dog would defend its stake.
From an objective standpoint, the Soviet Union and Europe share a similar economic framework :
> A zone bringing together a group of states
> Free movement of goods and individuals within it
> The development of common projects using different parts of the zone
> But above all, a common currency
So, It took time to establish a common currency, therefore dedollarization won't happen right away
And where some of them failed to stand out in creating alternatives to the dollar as they all got eliminated (HUSSEIN, KADHAFI, CHAVEZ), the probability that the BRICS succeed in this global "decentralization" becomes more and more evident. This is one of the reasons that is increasingly appealing to countries wishing to join this organisation.
There is a certain logic if one looks at the geographic perspective of the 6 new members who have joined the BRICS, that it is imperative to secure the area to supply the new markets (Middle East / Africa), and consequently gain full control of the Red Sea and the Gulf of Aden (part of the BRI).
Israel is merely an opportunity for the West to slow down the development of this project !
Therefore, to return to this "small" war of secret service cartels, MOSSAD (and indirectly the CIA) could not have been unaware that Hamas was arming itself progressively, but above all, qualitatively. One might even assume that it was evident to anticipate, following the abandonment of 50 billion dollars worth of military equipment in Afghanistan, just like the initiation of the Marshall Plan for Ukraine in the supply of heavier weaponry, a scenario concocted from scratch to set up this new theater of war!
Something tells me that the cancelled cereal deal by the Russians has something to do with it...
What are you ready to do at any cost ?
www.macrotrends.net
No matter the price you put into it, it will be nothing compared to the resources of governments !
In conclusion, not only have you been manipulated in a 'scam' with war images you could never have imagined seeing in 1973, but you will all watch how the price of a barrel will skyrocket and get ready to pay your "full of tank" 5 times more expensive.
Russia's deputy PM NOVAK on NSE:OIL prices by year end : "Market sets the prices itself"
Why? Quite simply because the geographical area of the conflict is composed of OPEC, and therefore the likelihood of a refinery receiving a 'stray missile' is very significant.
As a result, the "Peace Makers" have decided to replenish their coffers to continue funding the production of ammunition...
FOR THE PLAYERS :
The last week close, before the busy weekend from the Gaza Strip left a gap between 84.90$ and 85.95$. There are barely 0.24$ left to close this one.
The experience of 1973 raised the thermometer by over 35$ (from 28$ to 65$) initially, ultimately ending above 146$ over the decade following the conflict.
147.5$ was the 2008's ATH (we know the reason...)
138.4$ was the Russia's SMO over Ukraine, which shows the first attempt to Break the Creek
Pull back above 92.63$ will trigger my Swing LONG
STOP BUY > 92.63$ | STOP LOSS 79$
TARGET 1 > 147.50$
TARGET 2 > 215.32$
Just take a look of 1973-1983 chart to understand !
I don't make the rules!

Crude oil I've been watching oil closely for the last two months. I would like to say that oil is a trending instrument, we started the decline from 95$ per barrel and fell quite rapidly until the conflict in the Middle East. all news resources said that oil rose in price on the background of this news. Technically, I was waiting for this upward correction. But if the war will really be global, the price of oil should be cheap to strengthen the US and the dollar, and these goals began to be fulfilled. In what way?
I have written about this many times, that what we trade is futures oil, in the financial market, and the main players in futures oil are City Bank, Goldman Sachs, JPMorgan Chase
read more
Best regards EXCAVO

UKOIL Waves UpdateHello Traders, Base on technical and wave analysis we see this scenario for #UKOIL for next move. let me know in the comment section below if you have any questions, the entry will be taken only if all rules of the strategies will be satisfied. I suggest you keep this pair on your watchlist and see if the rules of your strategy are satisfied.

Crude Oil Rising Momentum🛢️ CRUDE Oil!
⛽Price rebounds from $83 to $88 amid Middle East tensions and oil supply threats. 🌍 Geopolitical risks loom large; brace for a potential breakout!

CRUDE OIL (WTI): Will The Gap Be Filled?!🛢️
WTI Oil opened with a huge gap up due to the Israeli - Palestinian conflict.
As you know, the is always up to 80% chance that the gap will be filled.
For us, it can be a nice shorting opportunity.
To trade that with a confirmation, focus on 84.5 - 85.0 area.
That is a minor intraday support that is based on gap close level
and recent historical price action.
My bearish confirmation will be a 4H candle close below that - its breakout.
I will anticipate a bearish movement to 83.1 - gap opening level.
As always, pay close attention to events.
A new higher higher higher close will indicate the escalation of the conflict.
❤️Please, support my work with like, thank you!❤️

trifor || XAUUSD-10/09/2023Preferred direction: SELL
Comment: The extreme trading idea for gold worked out perfectly. At the moment, the local strengthening of the metal is likely to continue, this will be facilitated by the technical and fundamental factors. We cannot rule out a slight downward movement, as in most major instruments, after which there will most likely be growth with a target of 1870. It is not worth considering higher targets for now, since there is already a high probability of a reversal and a continuation of the fall within the downward trend.
Thank you for like and share your views!

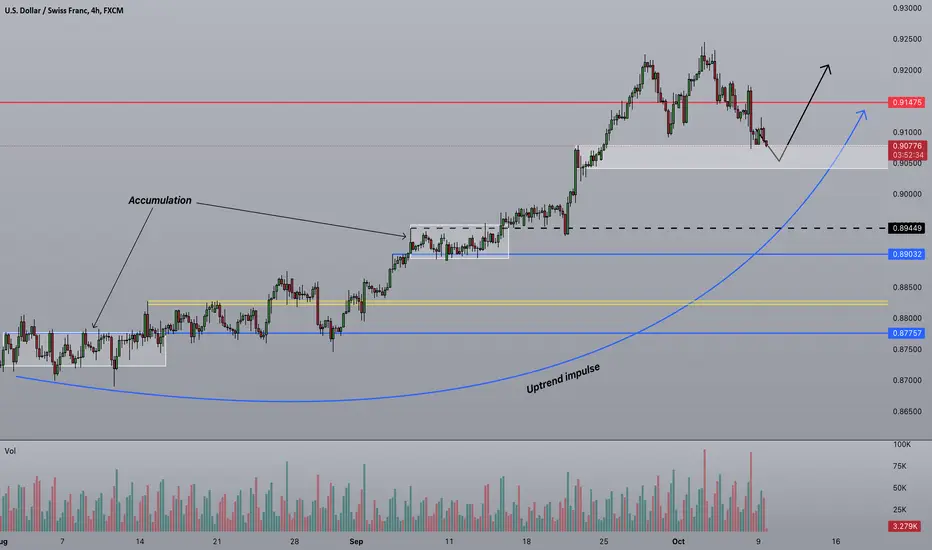
Strifor || USDCHF-10/09/2023Preferred direction: BUY
Comment: There is a prospect of growth within 1-2 weeks for the USDCHF currency pair. Before this, as we wrote in our last idea for the franc, a slight, shallow fall is expected. You can start shopping now. You can also buy in the area of the level 0.90500. Growth target level 0.91475.
Thank you for like and share your views!
Strifor || UKOIL-10/09/2023Preferred direction: SELL
Comment: Monday's oil gap surprised everyone, but given this geopolitical background, this is not surprising in principle. The strengthening of oil is most likely short-term and a fall can be expected soon. Most likely it will be in the middle of this week. The goal of the fall will, of course, be closing the gap, and even moving lower.
Thank you for like and share your views!

Crude Oil (WTI): Preparing For Reversal 🛢️
WTI Crude Oil closed, testing a major horizontal daily support.
The price formed an inverted H&S pattern on that on an hourly time frame.
Your bullish confirmation next week will be a bullish breakout of 83.37 level - its horizontal neckline. Hourly candle close above will confirm the violation.
A bullish continuation will be expected to 84.51 / 85.41 levels then.
❤️Please, support my work with like, thank you!❤️

TradePlus-Fx|EURUSD: drop once again💬 Description: The approach to the daily level of 1.05194 has been realized and is currently being tested. Sellers are still strong, and sell-trades are still given priority. It should be noted that the euro resists the fall more successfully than anyone else, but it is unlikely that this currency will ignore the retest of local lows, namely 1.04500 . This area has many purchases; whether they will be able to protect themselves is a big question. Therefore, today's intraday sales are being considered in order to approach the indicated area of support. The idea may take 1-2 days.
🔔 FX CALENDAR TODAY:
🇺🇸Initial Jobless Claims
🇺🇸Trade Balance
🇨🇦Trade Balance
🇨🇦Ivey PMI
➖➖➖➖➖➖➖
🚀 Thank for your BOOSTS 🚀
👇 Share your views and FOLLOW US 👇

WTI Crude Oil All Time Chart. Does History Repeat Itself..?!I'm writing this article, because of the striking resemblance with Today's oil and the one that has been a lot of times before..
I believe that history repeats itself, and there are lessons to be learned. And since this boom and bust cycle are not new, it might also provide some understanding on where we are heading.
I hope you enjoy.
The time of dinosaurs
In the 1850s the whale fisheries had failed to keep pace with the mounting need for illuminating oil, forcing the price of whale oil higher and making illumination costly for ordinary Americans. Only the affluent could afford to light their parlors every evening.
There were many other lighting options such as lard oil among others but no cheap illuminant that burned in a bright, clean, safe manner.
George Bissell, considered as the father of the American oil industry, had the intuition that oil that was plentiful in western Pennsylvania could be a first rate illuminant. The slimy liquid was so ubiquitous that it tainted well water and plagued local contractors drilling for salt.
In 1855, Professor Benjamin Silliman from Yale produced a report that vindicated Bissell's hunch that oil could be distilled to produce a fine illuminant (like kerosene), plus a host of other useful products. As a result, Bissel and his company, Seneca Oil Company (formerly the Pennsylvania Rock Oil Company) needed to dispatch someone to Pennsylvania to look for large pools of oil.
First oil drilled in America
That man was Colonel Edwin Drake, known as the first to successfully drill for oil. Drake arrived in Titusville, Oil Creek Valley. Oil was known to exist here, but there was no practical way to extract it. Its main use at that time had been as a medicine for both animals and humans. Natives used it for war paint and for soothing skin liniment. It took a couple years but Drake struck oil in 1859.
This was the beginning of a pandemonium. Bands of fortune seekers and speculators streamed into Titusville and other oil-related businesses quickly exploded on the scene.
I guess we can call this the Klondike of oil, as a beginning of Global Industrialization Era.
Mr. Rockefeller was known as the co-founder of the Standard Oil Company and was the world's richest person. Crude oil jumped multi X times in 1860s from approximately 50cents per barrel in early 1860s to over 3 dollars in late 1860s.
Additionally, I would like to note that crude oil fluctuated between $10 and 10¢ a barrel in 1860! Adjusted for inflation, Mr. Rockefeller fortune upon his death in 1937 stood at $336 billion according to Fortune (in 2008 U.S. dollars).
Similar how crypto enthusiasts built their wealth in 2010s, right? 😉
Pump and Dump
By the late 1860s, there was a slump in the oil industry, keeping it depressed for the next five years. Low kerosene prices, a boon to consumers, were catastrophic for refiners, who saw the profit margin between crude and refined oil prices shrink to a vanishing point.
Worse, the oil market wasn't correcting itself according to the self-regulating mechanism described by neoclassical economists. Producers and refiners didn't shut down operations in the expected numbers.
John D. Rockefeller said "So many wells were flowing that the price of oil kept falling, yet they went right on drilling." Rockefeller tirelessly mocked those "academic enthusiasts" and "sentimentalists" who expected business to conform to their tidy competitive models.
One Hundred Years of Resistance for $4
According to the standard model of competition, as oil prices fell below production costs, refiners and producers should have shutdown.
But the oil market didn't correct itself in this manner because refiners and producers carried heavy bank debt and other fixed costs and by operating at a loss they could still service some debt. Each refiner, pursuing his own self-interest, generated collective misery.
Does it sound like today's crypto news, right? 😉
The U.S. drilling activity didn't slow down after hot 1860s as much as expected and a lot of producers are still pumping oil to avoid defaulting on their loans..
There was World War I in 1914-18, and total number of military and civilian casualties was around 40 million - around 20 million deaths and 21 million wounded. 😓
There was World War II in 1939-45, and total number of military and civilian casualties estimated around 50 - 56 million.. 😓
Crude oil prices jumped again, and again. But still remained below $4 until 1970s, as there were no all time peaks in crude oil after super hot 1860s.
Money-printing Era Breaks the Rules
The gold standard was the basis for the international monetary system from the 1870s to the early 1920s, and from the late 1920s to 1932 as well as from 1944 until 1971 when the United States unilaterally terminated convertibility of the US dollar to gold, effectively ending the Bretton Woods system, that has been resulted with huge inflation all over the world within further decades..
Technical pictures at the main WTI crude oil chart illustrates, oil price are on the sustainable path since then, with huge bullish accelerations within local and global conflicts, like Arab-Israeli War in 1973, 9/11 attacks in 2001 and Russia-Ukraine conflict in 2022.
Nowadays
Knee-jerk surge’ happens again, and again, so oil experts repeatedly predict market impact of new 2023 Israel-Hamas conflict.
Crude oil price sees a spike on early Monday trading Oct 9, 2023 so the overall impact of the attack on Israel by Palestinian militants Hamas has yet to consider...
In a conclusion.. Does history repeat itself..
Certainly "Yes". As lessons of history still remain unlearned.

Odd things in the oil market, reminiscent of 2022 market topRecently, more and more financial institutions have been upgrading their price targets for oil. Mostly, these forecasts were upward of $100 per barrel, with JP Morgan and some other financial entities forecasting prices as high as $150 in the coming months. About three weeks ago, we tweeted that these statements are very reminiscent of those made in the second quarter of 2022 when many of the same corporations upgraded their forecasts right at the market top (to $150, $200, etc., depending on the entity). While $100 per barrel could be in play if OPEC and OPEC+ (mainly referring to Saudi Arabia and Russia in this regard) manage to maintain production cuts and the U.S. stops releasing oil from the Strategic Petroleum Reserves, we are very skeptical about the ultra bullish calls out there.
The first reason for our view is that if the global economy continues slowing down and heads into recession, we will likely see oil demand falling. The second one, which surprises us, is that the Biden administration has not started filling up Strategic Petroleum Reserves despite planning to do so earlier this year (plus, despite oil falling below $70), which makes us wonder why the administration is not buying. Could it be that they completely miscalculated their game and missed the chance, or are they expecting a better opportunity to come (supposedly better than $64 per barrel)? We honestly do not know, but it is very odd, to say the least.
Illustration 1.01
The picture above shows the monthly chart of U.S. crude oil production. From the start of 2023 through June 2023, U.S. crude oil production has grown by more than 500,000 barrels per day (by more than 4%).
Illustration 1.02
Illustration 1.02 displays the daily chart of USOIL and simple support/resistance levels.
Technical analysis
Daily time frame = Bearish
Weekly time frame = Neutral
Please feel free to express your ideas and thoughts in the comment section.
DISCLAIMER: This analysis is not intended to encourage any buying or selling of any particular securities. Furthermore, it should not be a basis for taking any trade action by an individual investor. Therefore, your own due diligence is highly advised before entering a trade.

UKOIL Wave AnalysisHello Traders, Base on technical and wave analysis we see this scenario for #UKOIL for next move. let me know in the comment section below if you have any questions, the entry will be taken only if all rules of the strategies will be satisfied. I suggest you keep this pair on your watchlist and see if the rules of your strategy are satisfied.

CRUDE OIL (WTI): Good Moment to Buy 🛢️
WTI is testing a key horizontal support.
The price formed a tiny double bottom on that on an hourly time frame
and violated its neckline, giving us a nice bullish confirmation.
I expect a pullback from the underlined blue area to 0.894 / 0.900
❤️Please, support my work with like, thank you!❤️

The Oil "belong to" UK finally reached 96.80 +/-. 2/Oct/23UK Brent Crude Oil finally reached 96.80 +/- as posted idea on 23/Feb/23. What Next to the "mother of all inflation"?

Crude Oil ~ 4H Swing V2 (Sept-Oct)Updated 30/09/23:
- Revised up-trending parallel (green)
- Added down-trending/consolidation parallel (white)
- Added horizontal lines (yellow/dashed) to mark upper/lower range (94.239-87.829)
Everything else stays the same (chartist holy grail lol).
Notes:
- Further write-up on Daily Swing V2 Chart
- Faded out longer TF parallel lines (light blue)
TradingView has a sh*tty chart bug where any trend-lines drawn on longer TF become misaligned when you switch to shorter TFs.
Temporary workaround = set "Opacity" on affected lines to "0%" before publishing & restore afterwards so you don't have to manually erase/re-draw...just remember where you drew them to begin with lol.

Crude Oil ~ Daily Swing V2 (Sept-Oct)Updated 30/09/23:
- Revised up-trending parallel (green)
- Added down-trending/consolidation parallel (white)
- Added horizontal lines (yellow/dashed) to mark upper/lower range (94.239-87.829)
Everything else stays the same (chartist holy grail lol).
CAPITALCOM:OIL_CRUDE has done an amazing job respecting its upward parallel channel since June.
Could see period of consolidation (foreshadowed by prev price action) into lower trend-line before deciding whether to push higher towards Golden Fib (break upper trend-line), or capitulate to global recession fears & collapse towards 200DMA/23.6% Fib, TBC.
Price action would be biased towards upside given OPEC+ bullish manipulation, however OPEC+ would also be hyper-vigilante on excessive Crude Oil prices which could threaten demand destruction - hence why they opted to review production cuts on a monthly basis to maintain price/economic stability.
