Crude Oil (WTI): Time to Buy!!! 🛢️
Crude Oil reached a key daily structure support.
Approaching that, the price formed an ascending triangle formation on 1H time frame.
Its neckline has just been broken.
I expect a pullback.
Goals: 68.6 / 69.4
❤️Please, support my work with like, thank you!❤️
Crude Oil Brent

Hi, I see A very good Swing trade opportunityHi,
I see A very good Swing trade opportunity
Risk to reward is very convenient
Good luck Every one


CRUDE OIL - KEYLEVELSCRUDE OIL - KEYLEVELS
The last stock of crude Oil its less than the last week, so bassically until Thrusday there is huge potental for grow in price , but not for too long...maybe 72 or 73... im not very bullish ...just for a scalp trade maybe.

Oil -Rising on potential OPEC cut oil productionWell, the technical analysis seems to indicate that Oil is currently in a very strong overbought area, from which we expect it to rise to at least 82.
Especially since interest rates may stop rising in the coming period and be fixed at 5.25 or 5.50
With the decline in oil prices due to the economic slowdown, there is a high probability that OPEC will cut oil production at the next meeting, which will cause prices to rise strongly.

UKOIL LONG IDEAI believe the price will fall and tag the
POC from PD and then bounce back up
PD buyer heavy
L50 in buy zone.
we could go long as the price opens above
POC and AVWAP
something like illustration on chart.
NOTE - Not yet tagged in the position.
maybe entry will present post London open.

USOIL Additional Chart I feel compelled to share another possible scenario. If OPEC+ fails to agree on a meaningful cut, we may see increased volatility, which could shape an expanding leading diagonal (red dotted line and pale wave count).
The bigger picture is in the previous post .

FEDFUNDS | Too TightThe point of TradingView (and being a human/trader in general) is to learn from your mistakes. I did make some mistakes. Perhaps this idea by itself is another mistake. But I cannot do any different. I must speak out about what I see.
For the past year I tried to understand the pressures that are pushing prices higher, equities lower.
It is important in analysis to avoid the mass, the "common truth".
We all have expected a future of uncontrollable inflation, extreme prices and The Great Reset. The place where everything is too expensive to buy, and we will have to live with coupons.
While some of these may come, it is important to analyze what isn't coming.
Oil prices have been paired with the dollar (with the petrodollar).
Many expect oil prices to explode even further, while "dollar is losing value" and "hyperinflation is imminent".
Some charts however show a different picture...
WIth the 2M chart warning of downward swing, and with the 3M chart showing divergence, the future of oil may not be as explosive as we may believe.
But that is in relative terms. The strength of money seems fated to increase a lot more. Which in relative terms will constitute oil cost to be viable.
In the main chart, it appears that oil is moving into what appears to be a Wyckoff Distribution.
And oil is not the only one who will have trouble with the high-yield environment.
Until now, the usual equity-bond investment scheme has performed tremendously.
This trend is now changing. With a significant trend violation that occurred last year, it seems that we are entering a new period of investment strategies.
From bonds as a hedge against equity weakness, investors should seek alternatives.
The old way of doing things is broken. Commodities will be playing a significant role in the future of investments.
It is in our power to find the new way of doing things.
Tread lightly, for this is hallowed ground.
-Father Grigori
P.S. A link to the indicator I am using.

USOIL is getting cheapWe recently noted that an interesting opportunity to go long oil could be on the horizon soon. Accordingly, we waited patiently for the price to fall below $70 per barrel. Now, with the price trading near $68.80, we are starting to consider the price attractive to go long. However, we think it is proper not to use all the firepower yet as technicals still point to more downside. Therefore, our plan is to start accumulating in very small batches and unload the stash with the price retracing back above $70. With that said, we would like to set a price target for USOIL at $71.
Technical analysis
Daily time frame = Bearish
Weekly time frame = Bearish
Please feel free to express your ideas and thoughts in the comment section.
DISCLAIMER: This analysis is not intended to encourage any buying or selling of any particular securities. Furthermore, it should not be a basis for taking any trade action by an individual investor. Therefore, your own due diligence is highly advised before entering a trade.

CRUDE OIL (WTI) Under Bearish Pressure!🛢
WTI Crude Oil was consolidating for quite a long period of time within a horizontal trading range.
Its support was broken today.
It may push the price much lower.
Taking into consideration that the market is trading in a long - term bearish trend,
I will expect a bearish continuation to 64.0 level.
❤️Please, support my work with like, thank you!❤️

UKOIL LONG
8-20 on daily curling up.
i see an up shift coming in oil
price cleared POC today.
coming off of AVWAP and POC.
Sentiment in buy zone. good MACD.
entry long, with SL below POC.0

Crude Oil (WTI) Bullish Pattern Forming 🛢️
It looks like WTI Crude Oil is forming an ascending triangle formation on a daily time frame
that signifies a bullish accumulation.
To confirm a bullish continuation, monitor the neckline of the pattern.
If the price breaks and closes above 74.3 that will confirm the strength of bulls.
A bullish continuation will be expected to 76.6 level then.
❤️Please, support my work with like, thank you!❤️

UKOIL Analysis: Brent Crude OilThe looming possibility of a US debt ceiling default has sent shockwaves through the financial markets, triggering a series of events that could impact various assets, including commodities like UKOIL (Brent Crude Oil). In this analysis, we will explore the potential implications of a US debt ceiling default on UKOIL and present a trading strategy based on the current market conditions.
Analysis:
1. US Debt Ceiling Default Impact: A US debt ceiling default can have far-reaching consequences on global financial markets. Uncertainty and market volatility often drive investors towards safe-haven assets like commodities, particularly crude oil. As a result, we can anticipate increased demand and a potential price surge for UKOIL.
2. Buy Zone: The suggested buy zone for UKOIL, considering the potential effects of a US debt ceiling default, lies between $73.42 and $65.46. This range indicates the levels at which traders could consider entering long positions, anticipating a bullish price movement.
3. Stop Loss: To manage risk, it is crucial to establish a stop loss level. For this analysis, a suggested stop loss level is $61.53. Traders should set their stop-loss orders below this point to protect against adverse price movements.
4. First Target: The first target for UKOIL, considering the potential rise resulting from a US debt ceiling default, is set at $121.22. This level represents a significant upside potential and serves as an initial profit-taking area.
5. Second Target: In the event of a sustained bullish trend, the analysis suggests that UKOIL could potentially reach new all-time highs. The second target is set at $184.53, reflecting the possibility of an extended price surge beyond previous records.
Considering the potential impact of a US debt ceiling default on UKOIL, there is a compelling case for a bullish price movement. The suggested buy zone of $73.42 to $65.46 provides an opportunity for traders to enter long positions, while the $61.53 stop loss helps manage risk. The first target of $121.22 offers a profitable exit point, and the potential for UKOIL to reach new all-time highs, with a second target of $184.53, adds an exciting long-term perspective.
Disclaimer: This analysis is based on the assumption of a US debt ceiling default and should be considered speculative. Traders and investors should conduct their research, evaluate market conditions, and exercise caution when making financial decisions.

Crude Oil (WTI) 2 Scenarios Explained 🛢️
WTI Crude Oil is stuck between 2 solid structures.
Depending on the reaction of the price to these structures, I see 2 potential scenarios.
Bullish Scenario.
If the price breaks and closes above 74.3 resistance on a daily,
a bullish continuation will be expected to 76.57 level.
Bearish Scenario.
If the market drops and closes below 69.4 support,
a bearish movement will be expected to 65.0 level.
Wait for a breakout, it will show you the future direction of the market.
❤️Please, support my work with like, thank you!❤️

Intraday BUY Crudeoil (17 MAY 2023)Crudeoil intraday trading alert
3 simple steps to find a quality setup !
Risk Reward Ratio 1: 2
Anyone same idea with me?
BUY Crudeoil
Good luck traders..

Crude Oil (WTI) Key Levels to Watch This Week 🛢️
Here is my latest structure analysis for USOIL.
Support 1: 63.6 - 64.5 area
Resistance 1: 73.88 - 74.3 area
Resistance 2: 76.5 - 77.0 area
Resistance 3: 78.6 - 79.9 area
Resistance 4: 83.17 - 83.5 area
Consider these structures for pullback / breakout trading.
❤️Please, support my work with like, thank you!❤️

CRUDE OIL - SHORT SCALP TRADEI will Short Crude Oil , this area look like distribution so in the next moment we can see a downtrend continuation

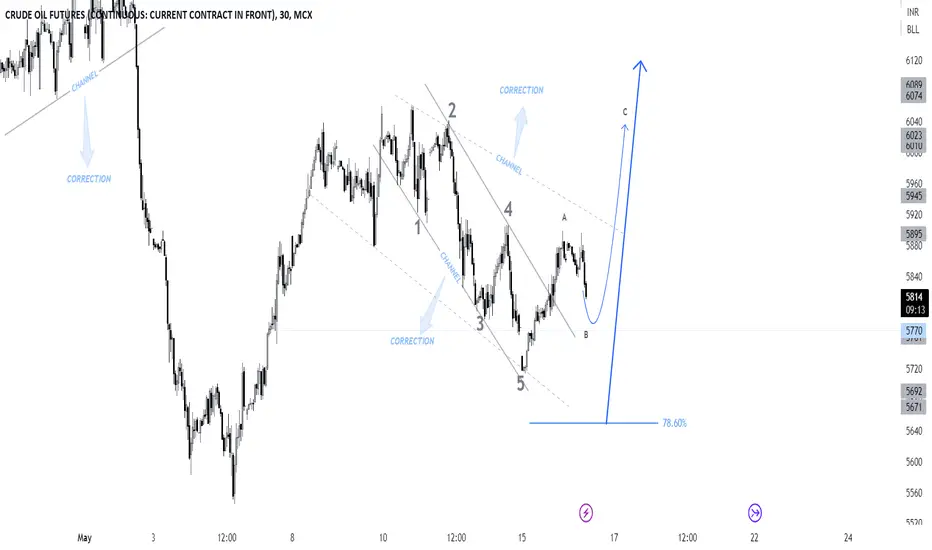
Crude Oil Next MovePair : Crude Oil
Description :
Impulse Correction
RSI - Divergence
Completed " 12345 " Impulsive and " AB " Corrective Wave
Break of Structure
Flag Pattern
Bearish Channel as an Correction in Short Time Frame with the Breakout of the Upper Trend Line and Retracement
SPX | Waiting For The Miracle To ComeThis year has been very boring... Lot's of horizontal movement, not many interesting news.
Well, except of course that "a couple" of banks went bust.
But if I didn't tell you that, you couldn't tell where in this chart this occurred...
SPX, and the market in general, has been too stubborn despite the importance of the events occurring.
On the one hand, this makes sense. This kind of crisis (banking) has come before, so the markets are calm. A crisis comes when nobody expects it to. And by design, a crisis is an unknowing event of unknowing consequences. A bank going bust is not frightening anymore. The market expects the FED to step-in and bail everyone out.
But the FED cannot possibly bail anyone out. They cannot print any more money (we might have reached a debt ceiling), and even if they could, they could be unwilling to print more money. Inflation will get worse.
So no more money.
Dollar has served as the worldwide reserve currency, until now. China amongst other powerful nations, collaborate into creating an alternative reserve currency. One that will be controlled by them, not by a panicking (?) FED.
The FED might not be panicking, even if we believe that they are trapped. I believe that they have very good knowledge of what they do, and of the repercussions. Absurdly high interest rates can be a mechanism to increase the dollar purchasing strength. And you need purchasing power when you have enemies (Russia, China etc.)
Since 2015, this has worked out tremendously well. The Dollar is making higher highs.
Of course, there are many fundamentals (like the Dollar Milkshake) that push the dollar value to new highs. But interest rates are interest-ing (hahaha) to the Dollar.
And the Dollar is winning battles against many countries of the world.
And with lower money supply, it's value is fated to increase even further.
(I like real reality, not augmented reality, that's why I used M2REAL instead of M2SL)
The money supply is vacuumed back into the printer which created it. And the power of the vacuum is not big, it is exponential.
The Dollar Milkshake Black Hole is now open.
But how much can the FED possibly hike?
The discrepancy between the FED's rate and the Market's rate is at it's highest level. The FED may not be able to hike any higher against the market's expectance. Who knows what will happen if the FED overcomes this limit... (is it even fundamentally possible?)
Inflation is high and it is fated to increase even more. I have posted about it extensively.
The preview of this chart idea is broken, oops...
Now, oil is looking substantial signs of strength.
Oil, the main inflation influencer, is showing significant signs of bottoming. Furthermore, it has retested a trendline that followed us since 2008. Long-term, the only way for Crude is up!
And the only way for equities is down! Just to reach the mean, the OIL/SPX ratio has to increase by 75%. So there is much room upwards for commodities...
Have you realized what SPX has shaped into?
Could this be the anatomy of a bubble? And has it already broken?
It seems that the recession is only now just beginning.
During normal times for the US economy, equities could grow even as yields were increasing. Now we are entering a period of weakness for the economy. Something has to give, either the equities go bust, or the yield rates. (Equities have much more room to drop than Yields do)
A crisis is definitely inching towards us...
A final chart for today:
Equities used to grow as money was created. Now this chart has immense dynamics to move downwards. In a sense, equities have MUCH room downwards, even if money gets created. This comes to prove that equities cannot absorb any more money supply. Money printing from the FED cannot possibly help equities, no matter what they do, they are trapped inside the bearish wedge. Only way for equities is down!
And similarly for SPX
Tread lightly, for this is hallowed ground.
-Father Grigori
PS. What could these charts mean? Are they of any meaning after all?
A crisis is definitely itching towards us...
I HAVE to test. All the time. Or I get this... this ITCH. It must be hardwired into the system or something.
-Wheatley, Portal 2

USOIL POSSIBLE SELLING TOWARDS THE SUPPORTFor more updates, please follow my TradingView page, and if you find the content useful, kindly hit the "thumbs up" button to show your support. If you have any queries regarding trading, please feel free to send me a direct message on TradingView. Additionally, please share this content with your friends who may find it beneficial.
Please note that any trading updates provided here are for educational purposes only, and it is always advisable to conduct your own research before making any investment decisions. It is important to ensure that all conditions are met before following any trade plan suggested in this update.

CRUDE OIL (WTI) Key Levels to Watch This Week 🛢
Here is my fresh structure analysis for WTI Crude Oil for this week.
Resistance 1: 73.88 - 74.3 area
Resistance 2: 76.56 - 77.10 area
Resistance 3: 78.60 - 79.85 area
Resistance 4: 83.2 - 83.5 area
Support 1: 67.90 - 68.05 area
Support 2: 64.4 - 66.9 area
Consider these structures for pullback/breakout trading.
❤️Please, support my work with like, thank you!❤️

UKOIL's Slippery Slope Heads Towards $60 Before New ATH of $500+Based on analysis of UKOIL's all-time chart from year 18xx, I believe it to be in a massive Flat correction. With Wave A of the Flat stretching down from $145 to $16, this gives implication that Wave B is likely to move up to the range of $331-$557, likely before the year 2030 arrives. RSI divergence on the monthly chart should also be present during the anticipated run to an ATH. If so, this will confirm a very deep and sharp move to follow.

Anyone get some WTI longs?TVC:USOIL
Nice looking longs for the oil traders here.....
Does that mean my gas going up for my car?
