WATCH OUT FOR OIL'S DESCENDING TRIANGLE...A potential close above 70 will signal the likelihood of oil price to test trendline is sloping downward or the bearish order candle.
N.B!
- USOIL price might not follow the drawn lines . Actual price movements may likely differ from the forecast.
- Let emotions and sentiments work for you
- ALWAYS Use Proper Risk Management In Your Trades
#usoil
#wti
#ukoil
Crude Oil Brent

"UK oil / Brent" Energy Market Heist Plan🌟Hi! Hola! Ola! Bonjour! Hallo! Marhaba!🌟
Dear Money Makers & Robbers, 🤑💰🐱👤🐱🏍
Based on 🔥Thief Trading style technical and fundamental analysis🔥, here is our master plan to heist the "UK oil / Brent" Energy market. Please adhere to the strategy I've outlined in the chart, which emphasizes long entry and short entry. 🏆💸Book Profits, Be wealthy and safe trade.💪🏆🎉
Entry 📈 :
"The loot's within reach! Wait for the breakout, then grab your share - whether you're a Bullish thief or a Bearish bandit!"
Buy entry above 77.00
Sell Entry below 74.00
However, I recommended to place buy stop for bullish side and sell stop for bearish side.
Stop Loss 🛑:
-Thief SL placed at 75.30 (swing Trade Basis) for Bullish Trade
-Thief SL placed at 75.70 (swing Trade Basis) for Bearish Trade
Using the 2H period, the recent / nearest low or high level.
SL is based on your risk of the trade, lot size and how many multiple orders you have to take.
Target 🎯:
-Bullish Robbers TP 81.50 (or) Escape Before the Target
-Bearish Robbers TP 71.30 (or) Escape Before the Target
📰🗞️Fundamental, Macro Economics, COT data, Sentimental Outlook:
🛢️"UK oil / Brent" Energy market is currently experiencing a Neutral trend (there is a higher chance for Bearishness)., driven by several key factors.
🔥 Fundamental Analysis
The global oil market is experiencing a slight imbalance, with supply exceeding demand. OPEC has agreed to extend production cuts, which may help stabilize the market. However, US shale oil production is expected to continue growing, potentially putting downward pressure on prices. Global economic growth is expected to slow down, which may reduce demand for oil.
🔥 Macro Economics
The global economy is facing headwinds, including inflation, interest rate hikes, and geopolitical tensions. This may lead to reduced demand for oil and a potential decrease in prices.
🔥 COT Data
Commercial Traders: Net short 55,000 contracts
Non-Commercial Traders: Net long 30,000 contracts
Trend: Commercial traders are increasing their net short positions, indicating a potential bearish trend. Non-commercial traders are decreasing their net long positions, also indicating a potential bearish trend.
🔥 Sentimental Analysis
70% of client accounts are long on UKOIL, indicating a bullish sentiment among traders. However, some analysts predict a potential bearish trend due to supply and demand imbalances.
🔥 Technical Analysis
The short-term trend is bearish, while the long-term trend is neutral. A head and shoulders pattern is forming, which may indicate a potential reversal. The key trading level is at 7685, 20 Day Moving Average level.
🔥 Geopolitical Analysis
Middle East tensions, US-Iran relations, and global trade agreements are affecting the oil market. The conflict in Ukraine and potential sanctions on Russia may disrupt global oil supply flows.
🔥 Inventory and Storage Analysis
US crude oil inventories are at average levels, indicating a balanced market. However, global oil storage levels are high, indicating a surplus of oil.
🔥 Seasonal Analysis
Oil prices tend to be higher during the winter months due to increased demand. The calendar spread is in contango, indicating a surplus of oil.
🔥 News and Events Analysis
The market is awaiting the Federal Reserve's crude oil data, which may shed more clarity on the near-term trend. OPEC meetings and US economic data are also expected to impact the market.
🔥 Quantitative Analysis
Statistical models indicate a high probability of a price decline. Machine learning algorithms predict a potential bearish trend.
🔥 Intermarket Analysis
Oil prices are highly correlated with the US dollar index. There is a divergence between oil prices and the S&P 500, indicating a potential reversal.
🔥 Overall Outlook
The UKOIL market is expected to experience a bearish trend in the short term, driven by supply and demand imbalances, geopolitical tensions, and technical indicators. However, the long-term trend remains neutral, with potential for a reversal. Traders should be cautious and monitor market developments closely.
⚠️Trading Alert : News Releases and Position Management 📰 🗞️ 🚫🚏
As a reminder, news releases can have a significant impact on market prices and volatility. To minimize potential losses and protect your running positions,
we recommend the following:
Avoid taking new trades during news releases
Use trailing stop-loss orders to protect your running positions and lock in profits
💖Supporting our robbery plan will enable us to effortlessly make and steal money 💰💵 Tell your friends, Colleagues and family to follow, like, and share. Boost the strength of our robbery team. Every day in this market make money with ease by using the Thief Trading Style.🏆💪🤝❤️🎉🚀
I'll see you soon with another heist plan, so stay tuned 🤑🐱👤🤗🤩

The Inevitable Descent of UKOILIn the shadow of a market that continues to revel in its own delusions, I find myself compelled to address the elephant in the room – or rather, the oil in the barrel that is UKOIL. We stand on the precipice of what I predict to be a significant correction, one that will see UKOIL prices plummeting to the region of $48 per barrel.
Why the Fall?
OPEC+'s decision to phase out additional output cuts by September 2025, announced in June last year, is a clear signal. The return of 2.2 million barrels per day to the market, should market dynamics permit, will flood an already saturated market. Despite the rhetoric of control, the reality is that OPEC+'s spare capacity, currently at 5.9 million barrels per day, limits any significant price increase. This, coupled with near-record production levels from non-OPEC countries like the United States, sets the stage for an oversupply scenario. The notion that demand will continue to grow unchecked is flawed. Global oil consumption growth is expected to slow dramatically from 2.3 million barrels per day in 2023 to 1.1 million in 2024, with similar levels in 2025. This deceleration is driven by multiple factors including the rise of electric vehicles, increasing efficiency in traditional vehicles, and a stuttering economic recovery in major markets like China. The market's current bullishness is more sentiment than substance. Indicators like the Stoch RSI currently at 77.9 suggest we are nearing overbought territory, a strong indication that a reversal could be imminent. This high reading, combined with the parabolic SAR signaling an upward trend now, might just be the last gasp before a significant correction.
The technical and fundamental analyses converge on a bearish outlook. Long Forecast anticipates Brent oil, which closely tracks UKOIL, to hover around $60-$65 by 2026 before a potential rebound. This, combined with other forecasts suggesting a further decline in demand, paints a picture not of a soft landing, but of a sharp descent. If we extrapolate current trends and market sentiment shifts, $48 is not just a possibility but a probable near-term floor.
Investors should consider reducing exposure to oil-related equities or hedge against the risk through diversification into non-correlated assets. For those with the stomach for risk, this scenario presents a unique opportunity to short UKOIL CFDs. In closing, let us not be swayed by the siren song of current market highs. The fundamentals, much like gravity, will eventually pull prices back to earth. Prepare for the storm, for it's not a matter of if, but when.
Horban Brothers.
Alex Kostenich

Brent UK Spot OilBrent UK Spot Oil
Brent crude is moving in a downtrend direction until
it reaches the support point at :
70.618
69.744
It is expected to change direction and move in
an uptrend direction and then reach the targets:

UKOIL (Brent Crude)UKOIL (Brent Crude) has recently tested a strong support level at $73.80, where buying pressure has prevented further declines. This level has historically acted as a significant price floor, indicating a potential reversal or continuation of bullish momentum.
Bullish Scenario:
As long as UKOIL remains above $73.80, we can expect an upward move toward the next resistance levels.
The first key resistance is at $74.70, a level where sellers have previously shown interest.
If price action remains strong, the next upside target would be $75.30.
Bearish Scenario:
If UKOIL fails to hold $73.80 and breaks below this level, it may signal a further decline.

BRENT Bearish capped by resistance at 7580The BRENT Crude (Brent Crude) price action sentiment appears bearish, supported by the longer-term prevailing downtrend.
The key trading level is at 7580, 20th February swing low level. An oversold rally from the current levels and a bearish rejection from the 7580 level could target the downside support at 7373 followed by 7300 and 7242 levels over the longer timeframe.
Alternatively, a confirmed breakout above 7580 resistance and a daily close above that level would negate the bearish outlook opening the way for further rallies higher and a retest of 615 resistance followed by 7690 levels.
This communication is for informational purposes only and should not be viewed as any form of recommendation as to a particular course of action or as investment advice. It is not intended as an offer or solicitation for the purchase or sale of any financial instrument or as an official confirmation of any transaction. Opinions, estimates and assumptions expressed herein are made as of the date of this communication and are subject to change without notice. This communication has been prepared based upon information, including market prices, data and other information, believed to be reliable; however, Trade Nation does not warrant its completeness or accuracy. All market prices and market data contained in or attached to this communication are indicative and subject to change without notice.

USOIL is about to fall sharply, prepare to shortFrom a technical perspective, usoil currently has a large short-selling opportunity.
The overall price of usoil has successfully stabilized at the 70 mark, and on this basis, it has ushered in a correction market with a volatile rebound. In the afternoon European session, oil prices rose slightly, pierced the 71.2 mark, and then closed in a volatile state. From the daily K-line pattern analysis, it finally closed with a volatile rebound cross K-line.
Although the short-term price stabilized and rebounded after gaining support at the 70 mark, from a comprehensive consideration at the daily level, usoil is still in a weak volatile pattern, limited by the 10-day moving average and below the 5-day moving average. For the short-term trend, the 73 mark is the key dividing line for short weakness. At the daily level, as long as usoil fails to effectively break through and stabilize the 73 mark, any pullback can be regarded as an excellent short-selling opportunity.
usoil short-selling trading plan:
Sell: 71.55, take profit 70.5; stop loss 72.3
TVC:UKOIL TVC:USOIL

"UKOILSPOT / BRENT Crude Oil" Energy Market Bearish Heist Plan🌟Hi! Hola! Ola! Bonjour! Hallo!🌟
Dear Money Makers & Robbers, 🤑 💰
Based on 🔥Thief Trading style technical and fundamental analysis🔥, here is our master plan to heist the "UKOILSPOT / BRENT Crude Oil" Energy market. Please adhere to the strategy I've outlined in the chart, which emphasizes long & Short entry. 👀 Be wealthy and safe trade 💪🏆🎉
Entry 📈 : You can enter a Bull or Bear trade at any point after the breakout.
Buy entry above 77.500
Sell Entry below 75.500
Stop Loss 🛑: Using the 2H period, the recent / nearest Pullbacks.
Goal 🎯: Bullish Robbers TP 81.500 (or) Escape Before the Target
Bearish Robbers TP 72.500 (or) Escape Before the Target
📰🗞️Fundamental, Macro, Sentimental Outlook:
The "UKOILSPOT / BRENT Crude Oil" Energy market is expected to move in a bearish direction, driven by several key factors.
🟠Macroeconomic Factors:
1. Global Economic Slowdown: A slowdown in global economic growth, particularly in China, may decrease demand for crude oil, putting downward pressure on prices.
2. US-China Trade Tensions: Escalating trade tensions between the US and China may lead to a decline in global economic growth, negatively impacting oil demand.
3. Strong US Dollar: A strong US dollar may make crude oil more expensive for foreign buyers, reducing demand and putting downward pressure on prices.
🔴Fundamental Factors:
1. Increasing US Shale Oil Production: Rising US shale oil production may lead to a surplus in global oil supply, putting downward pressure on prices.
2. High Oil Inventory Levels: Elevated oil inventory levels in the US and other countries may indicate a surplus in global oil supply, negatively impacting prices.
3. OPEC+ Compliance Issues: Non-compliance by OPEC+ members with production cuts may lead to a surplus in global oil supply, putting downward pressure on prices.
🟢Trader/Market Sentimental Analysis:
1. Bearish Trader Sentiment: The CoT report shows that speculative traders are net short crude oil, indicating a bearish sentiment.
2. Market Sentiment: The market sentiment is bearish, with many analysts expecting crude oil prices to decline due to the supply surplus.
3. Technical Analysis: The technical analysis shows that crude oil is in a downtrend, with a bearish breakdown below the $70 level.
🟡Sentimental Outlook:
Bearish Sentiment: 55%
Bullish Sentiment: 30%
Neutral Sentiment: 15%
⚠️Trading Alert : News Releases and Position Management 📰 🗞️ 🚫🚏
As a reminder, news releases can have a significant impact on market prices and volatility. To minimize potential losses and protect your running positions,
we recommend the following:
Avoid taking new trades during news releases
Use trailing stop-loss orders to protect your running positions and lock in profits
🚨Please note that this is a general analysis and not personalized investment advice. It's essential to consider your own risk tolerance and market analysis before making any investment decisions.
🚨Keep in mind that these factors can change rapidly, and it's essential to stay up-to-date with market developments and adjust your analysis accordingly.
💖Supporting our robbery plan will enable us to effortlessly make and steal money 💰💵 Tell your friends, Colleagues and family to follow, like, and share. Boost the strength of our robbery team. Every day in this market make money with ease by using the Thief Trading Style.🏆💪🤝❤️🎉🚀
I'll see you soon with another heist plan, so stay tuned 🫂

Crude OIL $UKOIL Classic patternI've seen this pattern many times over the last 5 years on different instruments, and its working out to over 50%
The essence of this pattern is a classic triangle with horizontal support, most of the participants realize that we will break down, but not everyone believes that we will take liquidity off the top before going down.
An instrument like oil is quite trivial and it can fall without taking liquidity off the top.
But I want to share a few examples of my theory working out, where the upper resistance line is broken before the drop-down
Best regards EXCAVO

"BRENT / UK OIL SPOT" Energy Market Heist Plan🌟Hi! Hola! Ola! Bonjour! Hallo!🌟
Dear Money Makers & Robbers, 🤑 💰
Based on 🔥Thief Trading style technical and fundamental analysis🔥, here is our master plan to heist the "BRENT / UK OIL SPOT" Energy market. Please adhere to the strategy I've outlined in the chart, which emphasizes short entry. Our aim is the high-risk Green Zone. Risky level, oversold market, consolidation, trend reversal, trap at the level where traders and bullish robbers are stronger. 🏆💸Be wealthy and safe trade.💪🏆🎉
Entry 📈 : "The heist is on! Wait for the breakout (74.500) then make your move - Bearish profits await!"
however I advise placing Sell limit orders within a 15 or 30 minute timeframe. Entry from the most recent or closest high or low level should be in retest.
Stop Loss 🛑: Thief SL placed at 78.800 (swing Trade) Using the 4H period, the recent / nearest low or high level.
SL is based on your risk of the trade, lot size and how many orders you have to take.
Target 🎯: 71.000 (or) Escape Before the Target
Scalpers, take note 👀 : only scalp on the Short side. If you have a lot of money, you can go straight away; if not, you can join swing traders and carry out the robbery plan. Use trailing SL to safeguard your money 💰.
📰🗞️Fundamental, Macro, COT, Sentimental Outlook:
"BRENT / UK OIL SPOT" Energy market is currently experiencing a Neutral trend (there is a higher chance for Bearish)., driven by several key factors.
🟠Corporate Traders:
Fundamental Analysis: Bullish, citing growing demand for oil and supply constraints.
Macro Economics: Bullish, expecting a global economic recovery to drive oil demand.
Sentimental Analysis: Bullish, with 58% of corporate traders holding long positions.
COT Report: Bullish, with corporate traders holding 100,219 long contracts.
🔴Investor Traders:
- Fundamental Analysis: Neutral, citing uncertainty around global oil demand and supply.
- Macro Economics: Neutral, expecting a slow global economic recovery to impact oil demand.
- Sentimental Analysis: Neutral, with 50% of investor traders holding long positions and 50% holding short positions.
- COT Report: Neutral, with investor traders holding 40,109 long contracts and 35,219 short contracts.
🟤Hedge Fund Traders:
- Fundamental Analysis: Bearish, citing rising US oil production and global supply concerns.
- Macro Economics: Bearish, expecting a global economic slowdown to impact oil demand.
- Sentimental Analysis: Bearish, with 60% of hedge fund traders holding short positions.
COT Report: Bearish, with hedge fund traders holding 80,109 short contracts.
🟢Institutional Traders:
- Fundamental Analysis: Bearish, citing rising US oil production and global supply concerns.
- Macro Economics: Bearish, expecting a global economic slowdown to impact oil demand.
- Sentimental Analysis: Bearish, with 62% of institutional traders holding short positions.
COT Report: Bearish, with institutional traders holding 120,000 short contracts.
🟡Overall Outlook:
- Bearish: 55%
- Bullish: 25%
- Neutral: 20%
Based on the comprehensive analysis, the outlook for Brent UKOIL Spot Commodity CFD is bearish, with a target price of around $62-$65 per barrel.
⚠️Trading Alert : News Releases and Position Management 📰 🗞️ 🚫🚏
As a reminder, news releases can have a significant impact on market prices and volatility. To minimize potential losses and protect your running positions,
we recommend the following:
Avoid taking new trades during news releases
Use trailing stop-loss orders to protect your running positions and lock in profits
📌Please note that this is a general analysis and not personalized investment advice. It's essential to consider your own risk tolerance and market analysis before making any investment decisions.
📌Keep in mind that these factors can change rapidly, and it's essential to stay up-to-date with market developments and adjust your analysis accordingly.
💖Supporting our robbery plan will enable us to effortlessly make and steal money 💰💵 Tell your friends, Colleagues and family to follow, like, and share. Boost the strength of our robbery team. Every day in this market make money with ease by using the Thief Trading Style.🏆💪🤝❤️🎉🚀
I'll see you soon with another heist plan, so stay tuned 🤗

USOIL Trade Update📢 FX:USOIL Trade Update
Hey Traders!
Following recent fundamental and technical developments, we’re seeing strong bullish momentum on Crude Oil.
🔹 Fundamentals:
Trump's new tariffs are driving market sentiment, pushing oil prices higher.
Despite last week’s excess supply from the US oil stock inventory, Crude held strong at $72 and failed to close below the 38.2% Fib level, signaling strong buy pressure.
🔹 Technicals:
The descending channel breakout confirms a bullish reversal.
This rally was triggered by the tariff remarks, and if more tariffs are imposed, we could see Crude pushing towards $80+ in the coming weeks.
🎯 Plan of Action:
We’ll be looking for buy/long positions on market open (Monday), ahead of the next Crude Oil inventory report. Regardless of the report outcome, momentum suggests higher prices for the black gold.
📊 Stay ready, and trade smarter! 🚀

Crude OilUS Oil - Crude Oil
Bearish Channel as an corrective pattern in Short Time Frame
Break of Structure
RSI - Divergence
Completed " 12345 " Impulsive Waves and " A " Corrective Waves
Demand Zone

WTI Crude Oil Futures: The Chokers of the Global EconomyLast Friday, January 10, 2025, the United States announced its most sweeping and aggressive sanctions against Russian oil trade, just ten days before Joe Biden leaves the White House and is replaced by Donald Trump.
In fact, it was more of a soap opera at first, as an unofficial document of unknown origin on the subject of sanctions had been circulating on the Web since the Fridays' morning before the official press release from the US Treasury appeared, causing the stock quotes of the companies affected by the sanctions to experience increased volatility in Friday trading on the local exchange.
Finally, about 160 oil tankers were sanctioned, and India, a key buyer of seaborne barrels, will not allow ships to call at its ports after the end of the curtailment period in March.
If these measures remain in place under Trump, they have a better chance of disrupting Russian oil exports than anything any Western power has done so far.
In addition to the tankers, sanctions were imposed on two major producers and exporters, traders arranging hundreds of shipments were listed, major insurers were named and two U.S. oil service providers were ordered to leave. A Chinese oil terminal operator was also included.
The measures could theoretically reduce what the International Energy Agency forecasts as a supply glut of nearly 1 million barrels a day this year.
Brent and WTI crude futures, which have generally traded lower for the past two and a half years, ended Friday at $80, data from ICE Futures Europe and CME Group's Nymex show.
Surgutneftegaz Sanctions RUS:SNGS and Gazpromneft RUS:SIBN are by far the most direct and aggressive move taken so far by Washington or any other Western power.
Together, the two companies shipped about 970,000 barrels of oil per day by sea in 2024, and their inclusion on the list will be a cause for concern for refineries in India as well as state-owned companies in China.
Putting their seaborne flows in context, that’s more than the global supply glut the International Energy Agency predicts for 2025. It’s also nearly 30% of Russia’s seaborne exports.
No one is suggesting that either company’s shipments will be completely shut down, but the fact that they are under sanctions, as well as other measures announced, means that supply chain disruptions and supply shortages cannot be ruled out.
Global markets, which were also hit by the December NFP report, reacted as expected.
The Nasdaq-100 immediately fell about 1%, the U.S. dollar index TVC:DXY rocketed to the moon while the yield on 10-year U.S. Treasury bonds TVC:TNX jumped nearly 10 basis points to 4.785%, its highest since October 2023.
Futures on the Dow Jones Industrial Average - a benchmark for the global economy - ended last week lower for a sixth straight week, while Bitcoin BITSTAMP:BTCUSD Bears are already dreaming to enter a Bear Market, approaching a 20% decline from the highs of around $108,000 reached in December 2024.
The technical main graph is dedicated specifically to WTI oil futures (the contract following the expiring one), and supported by the averages of the 5- and 10-year SMA.
It points to the reversal of the disinflationary time span seen in the previous two and a half years, from mid-2022.
// Don't say "hop" , before you throned 😏

Crude OIL Follow the plan Oil is one of the main tools that pressure the global economy. This tool is manually controlled; I will not repeat who owns it.
For the last 10 years, I have seen this pattern very often when we see a triangle that breaks down, but before it collects liquidity from above and breaks the upper resistance
I talked about it in a previous post
The idea is still the same; the timings are stretched longer.
I intend to pick up a historical start this year, most likely at the end of the year.
That's my lazy plan.
The realization is more complicated because opening a position at the ideal entry point will be challenging. All shorts will be liquidated and stop out for a long time, so we will probably have to stand in the reversal formation phase for a long time.
I could go on and on about politics and how it's explained to you on TV. But I don't do that.
Best regards EXCAVO

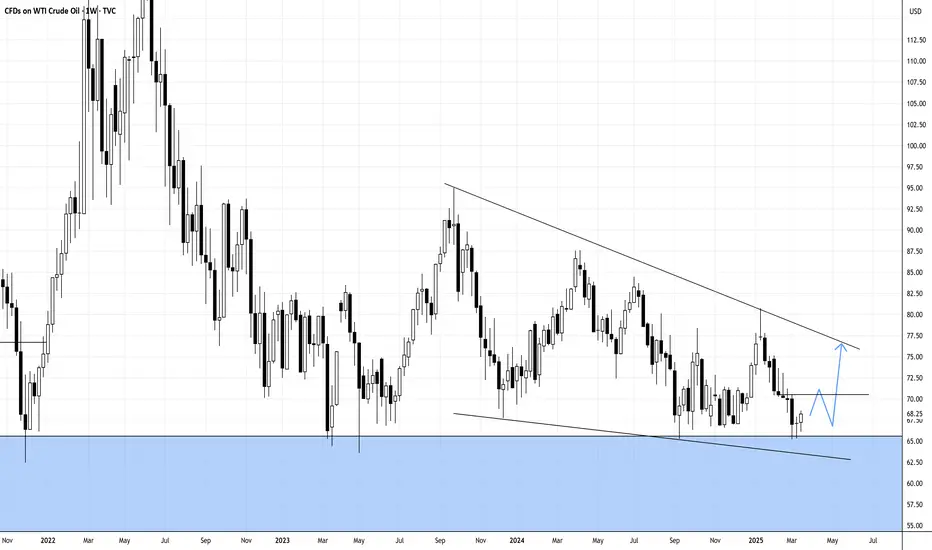
$USOIL USOIL WT CRUDE OIL Descending TriangleTVC:USOIL USOIL WT CRUDE OIL price action has formed a Descending Triangle on the Weekly timeframe.
Current Price: 70.3
In previous years, #USOIL reached a high of 149 and retraced to a low of 66.4 (A retracement of over 50%)
A breakout of Descending triangle can lead to higher prices: 73.9, 84.4, 94.3
A break below 66.4 can lead to prices down to 42.7!
It remains to be seen...

Berry Corporation - 13.5% dividend yieldBerry is in the oil and gas sector, where its current low share price and improved financials offer upside potential, albeit with higher risk

Murphy Oil Corp START BUY at 14The company in the energy sector is undertaking efforts to optimize debts and increase efficiency in production. Stable dividends and share buybacks create an interesting investment opportunity

UKOILSPOT "Brent Crude Oil" Energies Market Bullish Heist Plan🌟Hi! Hola! Ola! Bonjour! Hallo!🌟
Dear Money Makers & Robbers, 🤑 💰
Based on 🔥Thief Trading style technical analysis🔥, here is our master plan to heist the UKOILSPOT "Brent Crude Oil" Energies market. Please adhere to the strategy I've outlined in the chart, which emphasizes long entry. Our aim is the high-risk Red Zone. Risky level, overbought market, consolidation, trend reversal, trap at the level where traders and bearish robbers are stronger. 👀 So Be Careful, wealthy and safe trade.💪🏆🎉
Entry 📈 : You can enter a bull trade at Pullback,
however I advise placing Multiple Buy limit orders within a 15 or 30 minute timeframe. Entry from the most recent or closest low & high level should be in retest.
Stop Loss 🛑: Using the 4H period, the recent / nearest low level.
Goal 🎯: 78.437
80.000
Scalpers, take note : only scalp on the Long side. If you have a lot of money, you can go straight away; if not, you can join swing traders and carry out the robbery plan. Use trailing SL to safeguard your money 💰.
Warning⚠️ : Our heist strategy is incompatible with Fundamental Analysis news 📰 🗞️. We'll wreck our plan by smashing the Stop Loss 🚫🚏. Avoid entering the market right after the news release.
Take advantage of the target and get away 🎯 Swing Traders Please reserve the half amount of money and watch for the next dynamic level or order block breakout. Once it is resolved, we can go on to the next new target in our heist plan.
💖Supporting our robbery plan will enable us to effortlessly make and steal money 💰💵 Tell your friends, Colleagues and family to follow, like, and share. Boost the strength of our robbery team. Every day in this market make money with ease by using the Thief Trading Style.🏆💪🤝❤️🎉🚀
I'll see you soon with another heist plan, so stay tuned 🫂

USOIL Best Level to Short/Hold 10% swing trade setup🔸Hey guys, today let's review the 2 hour chart for US oil . Any upside is
limited by strong overhead resistances, currently trading near range highs
so overall risk/reward shifting in bears favor.
🔸Strong resistances will cap upside at 72.00 usd / 72.50 usd. right now
locked in tight trading range, however expecting final pump to trigger overhead stop losses before reversal and subsequent sell off event.
🔸Recommended strategy for BEARS: wait for the final pump before short selling from strong overhead resistances at 72.00 and 72.50 SL fixes at 74.00 usd, TP1 bears is 68 usd TP2 bears is 66 usd. swing trade setup, patience required. good luck!
🎁Please hit the like button and
🎁Leave a comment to support our team!
RISK DISCLAIMER:
Trading Futures , Forex, CFDs and Stocks involves a risk of loss.
Please consider carefully if such trading is appropriate for you.
Past performance is not indicative of future results.
Always limit your leverage and use tight stop loss.

USOIL WEEKLY MARKET ANALYSIS📊 USOIL Weekly Update
Technical View:
Not much has changed on the charts. Price remains within the expected range, waiting for a catalyst to break out.
Fundamental Highlights:
Geopolitics: TVC:UKOIL Brent hit ~$71, WTI at ~$67, driven by instability following the ousting of Syria's President.
Saudi Aramco: January crude prices for Asia slashed to early 2021 lows due to weak Chinese demand.
OPEC+: Delayed output hikes to April 2025; cuts extended through 2026.
U.S. Supply: Increased oil & gas rig activity adds pressure on prices.
Natural Gas: Futures rebounded 5% to $3.147 after last week’s losses.
🔑 Key Levels ( FX:USOIL WTI):
Bullish: Close above 21-period SMA ($72.37) targets 50-period SMA ($73.98).
Bearish: Close below $72.00 may see a drop toward ~$70.63.
📌 Trading Strategy:
Keep alerts set for key levels; patience is key as we await clearer directional moves.
💬 Let’s discuss more in comment below!
Happy Trading,
The NFX Team™ 💚
(Earlier shared this post but got taken down due to some off-platform mention (violation) - still getting used to the TV rules :) , reposted for reference purpose.)

Bearish on CrudeOilA very short post 😁
I just wanted to let you know, based on my technical analysis I see $62 to $63.5 an area that Crude Oil probably see in the near future. Then it has the potential to go towards $57.
That's it 😉
Cheers 🍻

Spot Crude Oil Energies Market Heist PlanHola! Ola! My Dear Robbers / Money Makers & Losers, 🤑 💰
This is our master plan to Heist Spot Crude Oil Energies Market based on Thief Trading style Technical Analysis.. kindly please follow the plan I have mentioned in the chart focus on Long entry. Our target is Red Zone that is High risk Dangerous level, market is overbought / Consolidation / Trend Reversal / Trap at the level Bearish Robbers / Traders gain the strength. Be safe and be careful and Be rich.
Entry 📈 : Can be taken Anywhere, What I suggest you to Place Buy Limit Orders in 15mins Timeframe Recent / Nearest Low Point take entry should be in pullback.
Stop Loss 🛑 : Recent Swing Low using 4h timeframe
Attention for Scalpers : Focus to scalp only on Long side, If you've got a lot of money you can get out right away otherwise you can join with a swing trade robbers and continue the heist plan, Use Trailing SL to protect our money 💰.
Warning : Fundamental Analysis news 📰 🗞️ comes against our robbery plan. our plan will be ruined smash the Stop Loss 🚫🚏. Don't Enter the market at the news update.
Loot and escape on the target 🎯 Swing Traders Plz Book the partial sum of money and wait for next breakout of dynamic level / Order block, Once it is cleared we can continue our heist plan to next new target.
💖Support our Robbery plan we can easily make money & take money 💰💵 Follow, Like & Share with your friends and Lovers. Make our Robbery Team Very Strong Join Ur hands with US. Loot Everything in this market everyday make money easily with Thief Trading Style.
Stay tuned with me and see you again with another Heist Plan..... 🫂
