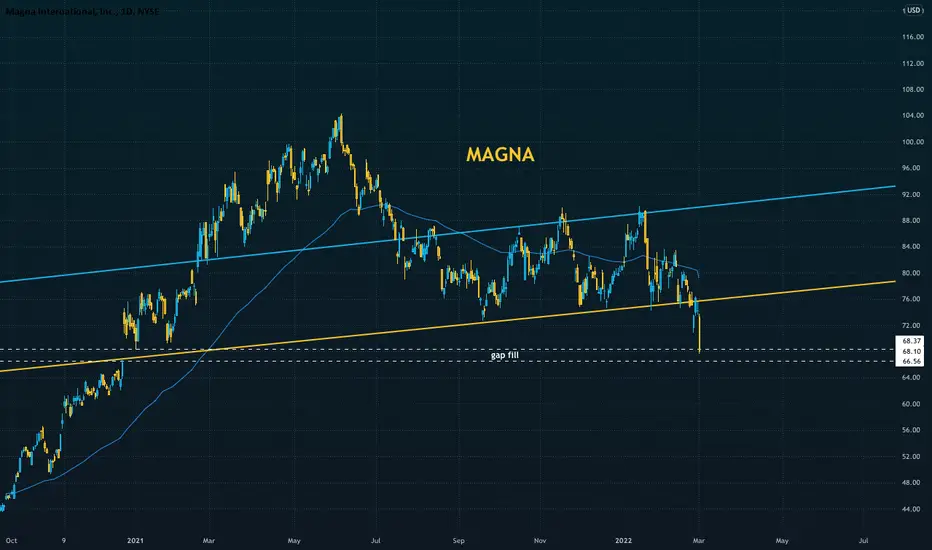
All Gaps Must FillA gap from Dec 2020 was closed in trading yesterday.
It would seem that asset managers are liquidating assets of companies with large manufacturing operations in Russia.
Magna has 2,500 employees in Russia in 6 facilities.
Russia conflict is likely to add even more supply chain constraints for auto manufacturers.
I really like Magna, should the conflict in Russia resolve itself, Magna will be positioned as a great investment opportunity on a discount with a good dividend.
Ukraine
BTCUSDTI say (1) or (2) .
These are the first prices before the other prices we will see .
What do you think ?

Real Money Moves Markets Good morning, nothing really technical here today folks just a reminder that one Geopolitical Event In Ukraine caused the market to move sharply to the upside. The power of real money cannot be denied during times of Bank Freezes or even Invasions & Occupations. Bitcoin passed the test once again, when millions of people donated BTC to fund Ukraine's Military. Over the last few weeks a colleague approached me in different ways sneakily trying to ask for crypto advice. I have to be honest, to people who aren't in the market & are clueless about the technology Bitcoin seems like some secret Cabal. Every few years people ask me randomly what coin they should buy. After six years the answer is always the same. I suggest starting with Bitcoin. If anyone is managing a portfolio BTC is the best way to start, it's the best investment, the best money, the most liquid cash, the most secure, it goes on & on. But for some strange reason, they think I'm lying or keeping secrets, or worse yet, I'm supposed to teach them portfolio management FOR FREE. This colleague, said his organization had access to large sums of cash sitting in a bank acct. A regular acct not a business acct. He asked what was the best thing to do? I suggested buying BTC & collateralizing it back into dollars 50% at 1% interest. The Org would have had tens of thousands of dollars to advertise, to do community events or for projects within the facility...The following week the conversation shifted to Akoin being some kind of solution for people in Senegal & potentially for black Americans here in the US. I was floored. After six years of teaching BTC, I had to start all over with the basics. My new approach is not to bash sh!tcoins but to allow people to fail, I do research on the projects then get back to "investors" with the good the bad & the ugly about their latest lotto dreams. After a few short conversations about the idealism behind Akoin or rather the appeal my colleague told me he hoped I was wrong or that he didn't want what I'd said to be true. I have no other choice but to believe he bought Akoin when BTC was dipping. The weight of the words "I don't want to believe that & I hope that's not true" were devastating. And this is the reason portfolio management conversations cost money.
What do you think?
Did you buy the BTC dip?
How do you handle no coiners?
Most diplomatic way to handle sh!tcoiners?
Disclaimer: In no way should my remarks or the context of coin discussion surrounding Geopolitics, Nation or Country of Origin to be considered disparaging. In fact if you're interested please see the latest developments regarding Senegal's adoption of Bitcoin.

Possible Buys on Gold
As Ukraine-Russia tensions continue, gold remains bullish. We will look for buys if price is able to break and close above the key level of resistance at 1931.00. This range should be filled with a 140 pip move to the upside.

Oil Soars Past $100, Next Targets?? #OOTTOil has soared and smashed through even our most aggressive profit targets. We smashed through 106, then hit 110, before finally coming up for air. A brief retracement appears to be finding support just above 106, so it does not appear that the rally is over, or even showing signs of pause. The Kovach OBV is extremely strong right now, as one would expect, but it has not showed teh slightest intent on leveling off, so it would be FOMO to buy at these highs. Our next target, set from Fibonacci Extension Levels is 116. We have created a giant vacuum zone below, so watch out if 106 does not hold. The next target below is 101.46, then 100.00. After that, we will surely find support in the 90's, but we aren't likely to see such low prices for now.

Stocks Still Undecided as Ukraine Crisis IntensifiesStocks have retraced further from relative highs at 4408. It looked like we might have been gearing up for a bull run to test 4440, but geopolitical woes seem to keep weighing, and two red triangles on the KRI suggest that 4408 is providing prohibitive resistance for now. We have since retraced back to 4272, but seem to have good support there. Currently, we are seeing a brief pivot from 4272, which has brought us to the midpoint of this level and 4408. From here it could go either way, but it is likely we will need some resolve to the Russia/Ukraine crisis to break higher. If we sell off further and 4272 does not hold, then 4228 is the next relative low where we should expect support, then 4122. If we can break 4408, then 4440 is the next target.

IS THIS THE HEALTHY UPTREAD?Weekly Time-frame
We are currently above Ichimoku Cloud but not yet confirmed. Still this is a Bullish Scenario. Bullish Relative Strength Index (RSI), Bullish Awesome Oscillator (AO). Rejection Area of $45,806 & $48,008. Support is in $43,971.
1D Time-frame
Huge green volume candle right there in AO. Area of rejection is still in $45,350, $48,008, and max would be $49,965. RSI is not overbought yet means there are still room for the upside. EMA 144 and EMA 233 has become a Strong Resistance. We are yet to test this resistance which is weakening and becoming a flattening slope resistance. Support is found in $44,106 & $42,624.
4H Time-frame
alternative.me
There is no sign of eminent reversal of trend yet. Greed and Fear Index remains neutral 52 (yesterday 51).
We can expect more to the upside. Rejection Area $45,653, $45,806, & $48,008. Relative Strength Volatility Variable Bands (RSVVB) staying inside the Bullish Pumping Zone. We have formed Cup & Handle price target at $53,907. RSI is overbought but doesn't matter it is normal during a healthy up-trend.
We will discuss more on the possibility on our Live. Stay tune and check with us!
Want more insights before US market open? Hit Like, Share, and Subscribe for more daily trading tutorial & cryptocurrency news
Trade Scholar, the best cryptocurrency educational community online!
Find the content above difficult to understand?
Feeling lost about how to trade?
Want to learn how to do your Own Price Prediction?
We endeavour to share you our investment knowledge & experience in order to help you starting your path to financial freedom. Follow, Subscribe & Join our Community to trade together!
Disclaimer: Above Technical Analysis is pure educational information, not Investment Advice. The information provided on this post does not constitute investment advice, financial advice, trading advice, or any other sort of advice and you should not treat any of the website's content as such. Do conduct your own due diligence and consult your financial advisor before making any investment decisions.

Bitcoin (BTCUSDT) MultiTF TA: 22.3.2Bitco in is below 44500-45800$ Resistance in 8-hour time and is forming a Wedge pattern in 1 hour timeframe, which can be broken down or broken upwards with a spike candle. It is recommended to wait until the process is clear. While bitcoin is in range, some altcoins can grow.
8H Timeframe:
⚠️ This Analysis will be updated ...
👤 Sadegh Ahmadi: @SDQ_Crypto
📅 2.Mar.22
⚠️(DYOR)
❤️ If you apperciate my work , Please LIKE and COMMENT , It Keeps me motivated to do better❤️

A Ukraine war is bullish for wheatWheat futures are showing a constant higher lows ahead of a bullish catalyst. That catalyst is a war between Russia and the Ukraine. I can get into any questions as to why I believe the current information suggests Russia will invade upon request in the comments.
This is bullish for wheat futures, The Ukraine is the number 5 ranked wheat exporter globally its wheat compromises 8% of global wheat exports. Most of the Ukraine's wheat production is in the east which would be totally cut off during a major conflict. To make matters worse Russia is the number 1 wheat exporter in the world exporting 17.7% of total global wheat exports. In the event of war Russia would likely be cut off from the swift payment system which would stop most of its international transactions causing massive supply chain issues with the wheat market. These factors in combination with the constant lower highs makes for very bullish conditions.

BTC Short TermOn H4 chart BTC is bearish/oversold in the MACD, RSI and Stoch RSI. I expect BTC to consolidate or make a small correction to the FVG zone. This will open up possibility for fresh entries and both alts if we stabilize or correct here. BTC has now become a strong asset during the Ukraine/Russia crisis, BTC also looks stronger than fiat and jump in BTC price and ''MCAP of stable coins'' indicate that investors are buying these assets. 3 of the top 11 coins are stable coins (usdt, busd and usdc)

Crypto ID Systems - Why Zero-Knowledge Proofs Are the FutureThe Russian-Ukrainian crisis, the tanking of the Russian stock exchange (and its subsequent shutdown) has put the economic future of Eastern Europe in a very uncertain state. Why Zero-Knowledge Proofs like zk-STARK and zk-SNARK (combined with KYC and AML methods) might see a renewed interest in the crypto industry in the near future. (And probably for the longer term as well.)

Bonds Soar off the Russia/Ukraine ConflictBonds have soared as risk off sentiment prevails as the Ukraine conflict intensifies. Russian forces are bearing down on Kyiv, the capital of Ukraine and civilian casualties are mounting. ZN has blasted off from highs at 127'08, through 127'22, and well into the 128 handle. We have cleared 128'01, the first level in the 128's, and have just broken through 128'10. With such a strong bull impulse, it is difficult not to anticipate a pullback or sideways currection at this point. We are likely to at least range at current levels, between 128'01 and 128'11, with a ceiling at 128'24. If not, expect a retracement to 127'22. Worst case, it is certainly possible that we will retrace the entire move to 127'08 (recall that gold did this just last week).

Bitcoin - All The PossibilitiesBitcoin - all the possibilities ...
The Long target could be $49k, $26k still possible by April

SPY StraddleOn the short term this looks like a textbook bull pennant
Long term however it's a bear pennant (kind of?), But not a textbook one, that massive dip and massive rally messes with it
I expect us to make a major move up or a major move down today or tomorrow
SOTU is catalyst enough today for that imo
I'm leaning towards up. The charts are better for it and I think Ukraine news is good for US, as we covered earlier
Looking forward to your thoughts when you read this
tldr 437.33 turns into support that holds solidly we go pew up to 440, then it's a straight shot to 447
Now if it breaks to the downside, 430.39 is the support, and if that fails we tumble all the way down to 412
"gap down" as they say
Bears will do puts, Bulls will do calls, smart / safe money will do both with a straddle

Ruble Where You Going ?
Hi traders:
With the tension between Russia and Ukraine, we can expect the market to be volatile and moving during an uncertainly time.
As we know, USD is a safe haven currency, and here on USDRUB, we can see clear bullish price action on the bigger time frames.
With many bullish impulse phases follow by bullish continuations, price is getting push up to all time highs.
This is where usually price will consolidate, and potential to continue or reverse back down.
For me, my personal options is leaning more upside and continuation up move.
What we should wait for is some sort of bullish continuation correction on the lower time frames, to confirm the upside move.
With the situation between the two countries may get worse, USDRUB could on route to a new highs.
thank you

Oil Short?! Yes thats right folks... and here's why. In this video we explain why we are now looking to take short positions in the Oil market.
TLDR:
- The fears of global supply problems from Russia/Ukraine conflict could be overplayed and that supply is able to be met by other suppliers increasing their supply within OPEC+ if Oil prices become a problem (which they already are).
- Politically high Oil prices are bad for governments so expect some action from policy makers if the price continues to rise much more (already seeing these reports now).
- Technical Analysis suggests we are entering levels of historic resistance.
- Last week (at the height of the Russia / Ukraine outbreak the Oil market sold off significantly from the current levels we are at right now.
Let me know in the comments below your own thoughts on where Oil is headed next.

FTMFTM coin that give breakout on chart, bullish RSI on D1 chart. Good to buy with stop loss at $1.8

Supply Concerns Lift OilOil has blasted off from yesterday's levels where it gapped up to the mid 90's. We found support at 95.24, and smashed through the next level at 96.88. After that, we made run back to $100, but are facing some resistance before that. The world is rearing from Russian supply fears, as it is in the top five oil producing countries (number two in 2022 right after the US by some sources, see here and here ). There is little in the way of fundamental data to suggest lower oil prices. However, if do see a technical retracement, then 95.24 should hold, if not, there is a vacuum zone back to 92.03. Our next target is $100, then $101.46.

Geopolitical Conflict Hits StocksStocks have begun to dip off of stepped up efforts with Russia to move in on Ukraine. Russian forces are close to the capital, Kyiv, and markets are reacting. We have strong safe haven inflows, as per bonds and gold, and the S&P 500 has just rejected a relative high at 4389. The Kovach OBV was increasing, but has curved over with the rejection. If we do find support at current levels, watch for a bull wedge or other bull consolidation pattern to form under 4389. If we retrace further, 4245 should provide support. If we are able to break out from 4389, 4440 is our next target, but this is not likely for today.

Gold Consolidates as War Pressure Ramps UpThe price of gold is consolidating in a range between the 23.6% Fibonacci retracement level at 1922.32 and 38.2% Fibonacci at 1890.01, as peace talks are threatened by Russia's intensified aggression .
Depending on how the peace talks develop next, a breakout above the 23.6 per cent Fibonacci may be attempted, though this is then likely to be followed by a pullback to the resistance-turned-support at 1922.32.
Conversely, a breakdown below the lower limit of the channel could allow for a subsequent dropdown towards the 38.2 per cent Fibonacci, which is about to be crossed by the 100-day MA (in blue) soon. This would make the 1890.01 threshold an even more prominent turning point, which is already evident given its close proximity to the psychologically significant level at 1900.00.

natural gas still holding on to supply fears?on the daily time frame a head and shoulders pattern is forming. on the 1hr time frame natural gas broke the up trend, and is need for a correction. there is a regular bullish divergence forming on the 1hr as well. A regular bullish divergence indicates a bull back in the market. This is about a 100 pip move, looking for price to go back near the trendline.I am looking for an entry after this pull back, may not be ready until London X New york session.
The market calmed a little when there was a discussion about releasing oil from storage in a bid to mitigate supply disruption. The release may be between 60 and 70 million barrels of oil. The EIA (International Energy Agency) is set to hold a meeting today 03/01/2022 about roles members can play in stabilizing oil markets

Bitcoin (BTCUSDT) TA 22.3.1Bitcoin grew yesterday as I watched it move fast. In this uptrend, it has broken its downtrend and needs to stabilize above it. If the new news of the war is not established and transmitted, it can increase the resistance between 45,000 and 51,000. Bitcoin support is in the range of 41,500. If the bitcoin uptrend slows down, altcoins can start moving well upwards.
Recommend to see last idea about BITCOIN sharp move forcast
⚠️ This Analysis will be updated ...
👤 Sadegh Ahmadi: @SDQ_Crypto
📅 1.Mar.22
⚠️(DYOR)
❤️ If you apperciate my work , Please like and comment , It Keeps me motivated to do better❤️

SACTION? TO THE MOON!Monthly Time-frame
Bullish Harami Printed!!! Breakout to the upside is in play! Higher low is printed confirmed! Watch out for confirmed bulls back in the ball game. Russian sanction on Swift Banking was Bullish for Bitcoin as Russians transferred their funds to Cryptocurrency.
Weekly Time-frame
Bullish week, double bottom, Relative Strength Index (RSI) Bullish. Higher low, breaking the previous high. Awesome Oscillator (AO) printing green volume and Bullish RSI. Breaking the Ichimoku Cloud soon! If rejected at $44,070 it’s a good time to open a short for a retest at $40,972.87.
1D Time-frame
Cheers for the bulls! We have broken the ichimoku Cloud, and made it a support, it looks weak breakout but will see if we can hold it as a Support. We are now ready to open a Positive Volume tomorrow.
4H Time-frame
RSI is overbought, which is normal during an up-trend. Broken the cloud, printed a strong volume AO. We are done with the butterfly constriction now we are moving to the upside.
We will discuss more on the possibility on our Live. Stay tune and check with us!
Want more insights before US market open? Hit Like, Share, and Subscribe for more daily trading tutorial & cryptocurrency news
Trade Scholar, the best cryptocurrency educational community online!
Find the content above difficult to understand?
Feeling lost about how to trade?
Want to learn how to do your Own Price Prediction?
We endeavour to share you our investment knowledge & experience in order to help you starting your path to financial freedom. Follow, Subscribe & Join our Community to trade together!
Disclaimer: Above Technical Analysis is pure educational information, not Investment Advice. The information provided on this post does not constitute investment advice, financial advice, trading advice, or any other sort of advice and you should not treat any of the website's content as such. Do conduct your own due diligence and consult your financial advisor before making any investment decisions.
