Global headwinds for copper?Copper has attempted a rebound from technical oversold levels in recent days, following a 20% drawdown from its all time highs, thus officially entering a bear market.
Is this an indication that investors have already priced in a global economic downturn and that the worst is now over?
Or are we merely experiencing a copper bear market rally, with further declines to come?
The previous days have acted as a relief rally in all assets that had declined in recent months. That's because interest rate fears cooled as inflation peaked. The market is beginning to believe that the Fed may not go all-in with rate rises and will thus need to release the brake to prevent more damage (a recession).
However, the most significant concerns associated with copper, particularly Covid-19 in China and the negative repercussions on global growth, have not dissipated.
If current geopolitical and economic challenges, such as Covid in China and the conflict in Ukraine, derail globalization efforts, copper prices may face further headwinds in the coming months as trade flows stall due to a drop in global consumer demand amid real income losses.
Copper prices exhibit an extraordinarily close link with South Korean exports ECONOMICS:KREXP — one of the world's most open economies and a gauge of the health of global trade flows.
Read more...
Ukraine

MOS/USD Daily TA Neutral BearishMOS/USD Daily neutral with a bearish bias. * Fed minutes were released today and confirms that the Fed is committed to two more rate hikes in June and July of at least 50 bps with potential for another 50-75 bp hike in September, and that they will sell mortgage backed securities (rather than let them roll over) if necessary as a means of reducing their balance sheet. Equity markets are currently responding positively but this could be short-lived. Additionally, to address the global food shortage, last week the U.N. proposed a plan for Russia to unblock grain exports from Ukraine through the Black Sea in exchange for reducing Western sanctions on fertilizer exports from Russia and Belarus; considering that Russia has found willing buyers of their fertilizer at higher price points, this is unlikely to pass anytime soon.* Recommended ratio: 40% MOS, 60% cash. Price is currently breaking down out of the uptrend line from 01/24/22 but is still technically testing it as support at ~$60. Volume remains high (moderate) and alternating between buyers and sellers every other day for what is now twelve consecutive sessions; this is indicative of potential consolidation. Parabolic SAR flips bullish at $66 which currently coincides with the 50 MA, this margin is neutral at the moment. RSI is currently trending up at 45.48 but is still technically testing 40.33 support; if it is able to establish support here it will likely test 58.12 resistance. Stochastic crossed over bullish in today's session and is currently trending up at 59; the next resistance is at 80.49 and support at 39.11. MACD remains bearish and is currently trending sideways at -1.65 as it continues to hover just below the Signal line (-1.54); if it is able to break out above -1.54 it would be a bullish crossover. ADX is currently trending up slightly at 19 as Price continues to fall, this is mildly bearish. If Price is able to reclaim support at the uptrend line from 01/24/22 (~$60) this would also imply that it has broken out of the descending trendline from 04/18/22 and would likely prompt a retest of $64.22 resistance. However, if Price continues to break down here then it will likely retest $55.79 minor support before potentially testing the 200 MA (for the first time since 12/01/21) at ~$46.28. Mental Stop Loss: (two consecutive closes above) $60.40.

Where the money at? $RTXI dont endorse war but in a see of red these stocks seem very atractive. 140+ for raytheon by EoY is very humble and realistic. :)

Lockheed Martin This is a long shot as the war is not over air warfare which is the specialty of Lockheed. However, the increase of its drone manufacturing capabilities could grant it a lot of governement contracts. If Putin boosts the Ukraine conflict from Special Operation to a declaration of War, I expect a lot of upside for Lockheed; specially Drone warfare division.

Pound rises on US inflation, GDP loomsThe British pound is in positive territory, as the currency tries to break a four-day losing streak. In the European session, GBP/USD is trading at 1.2355, up 0.36% on the day.
US inflation dipped in April, but still came in above the forecast. Headline CPI dropped from 8.5% to 8.3%, above the estimate of 8.1%. Core CPI came in at 6.2%, down from 6.5% but above the estimate of 6.0%. The US dollar is broadly lower as a result, although the decline would have been sharper had the estimates been right on.
Today's inflation data will no doubt result in some headlines proclaiming an "inflation peak", but I would caution that it seems premature to declare that inflation is on its way down after just one release. Higher interest rates will do the job and curtail inflation, but it will take time. In the meantime, today's inflation report will not change the Fed's stance, and the CME's FedWatch has pegged the likelihood of a 50-bps rate hike in June at 89%.
Looking forward, inflation gazing has become even trickier in the current environment. There are huge unknowns around price pressures due to the Ukraine war, as well as the extent of China's slowdown and the impact on supply chains due to China's uncompromising zero-Covid policy. With energy prices at very high levels, it will be difficult for headline CPI to come down.
Over in the UK, we'll get a load of data on Tuesday. The key release, Preliminary GDP for Q1, is expected to slow to 1.0%, down from 1.3% in the fourth quarter. The UK economy is showing an unhealthy mix of slower growth together with soaring inflation, which has raised concerns about stagflation. The BoE has been raising rates to curb inflation, but investors have not been impressed, as the pound has hit hard times and hit a 23-month low earlier this week.
There is support at 1.2199 and 1.2056
GBP/USD faces resistance at 1.2272 and 1.2418

Time for a USD retrace move? The US Dollar has been bullish for months... Global economic uncertainty caused by inflation, COVID, and the Russian and Ukrainian conflict have caused cash to flow to USD assets. Could the USD be currently over-valued? My analysis suggests that USD price is due a retrace move, especially on very over-extended pairs such as USDCHF, USDJPY, EURUSD and GBPUSD... Analysis for USDJPY and GBPUSD below...
USDJPY - 9 consecutive bullish weeks (almost a record?) Weekly RSI currently hitting over 88. Lower time-frames show weakening upside momentum. Possible retrace move due to previous monthly resistance at 124.00. I am expecting the retrace move to start by the end of June (hopefully this week as I am already holding out of the money USDJPY put options)
GBPUSD - testing key support area around 1.2200. Weekly RSI hitting around 22. Possible inverted head and shoulder trend reversal pattern (or range) on the weekly time-frame. I am expecting the retrace move to start by the end of June (hopefully this week as I am already holding out of the money GBPUSD call options).
Don't get me wrong, I expect the USD bullish trends to continue, perhaps now is just a good time to get off any long positions and open those shorts... Fingers crossed!

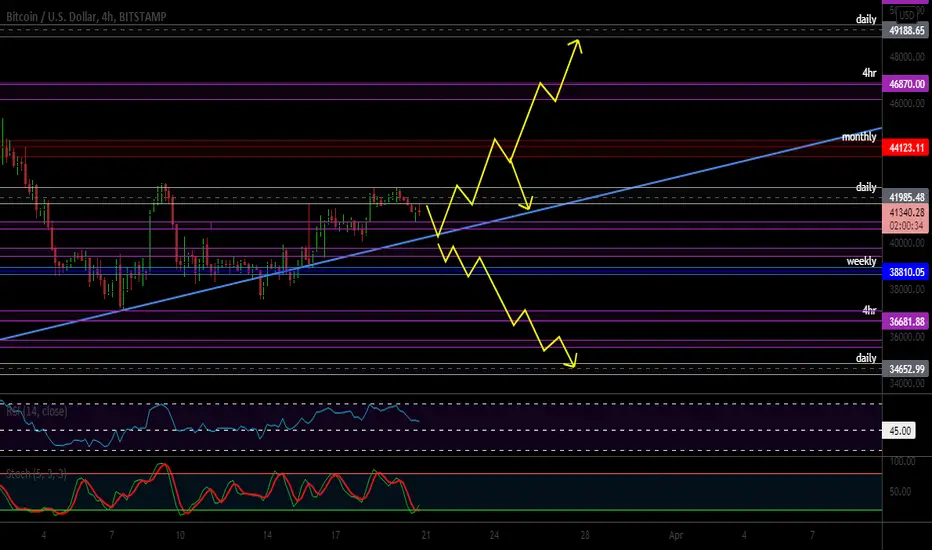
Waiting on Trendline Support or Fail For MoveThis currency is technically is a very large range, and the war isn't making it get any more steady. Even though my bullish trendline has been very respected, I'm starting to think it may have run out of steam this week.
If my trendline is broken, we'll probably make it back to 38810 zone and even further down to the 34652 zone.
If the trendline is supported, we should make it to 49188 zone for a solid higher high.
Here are the TPs:
BULL:
• 41620.37
• 43660.12
• 46090.47
• 48781.20
BEAR
• 41056.18
• 39797.61
• 38929.63
• 37150.27
• 35804.90
• 34936.92
EURO under pressure - Key element to watchEURO under pressure - Key element to watch
Context :
Since 2000 EUR/USD is evolving between 0,82 and 1,60 providing two clear floor and cap level following the trend of global macro economy and the strategies deployed in the differents major central banks.
The last past weeks following the decision to lower the Quantative Easing, the different actions took in the world in order to control the inflation and the good figure confirming the pursuit of the accumulation of the growth (even slower than last year) in the develop countries - The consensus for the Euro were quiet clear => main research highlighted 1,08/1,12 as strong support area and 1,18/1,23 as strong resistance for a further trading range without significant element for EUR or USD to take significant advantage regarding Growth, inflation and monetary policy.
Today the situation is a bit different with less visibilty regarding the situation in Ukraine and even if we can exclude potential risk of global war, we can't ignored the risk about bilateral sanction between NATO countries and Russia. It means significant problem with energy/metals/commodities supply and price, political destabilisation, cyber attack, etc... This kind of modification take time to be absorbe and modified in order to set up a new strategy were russia will stay isolated from global economy for a while.
The first economy to be impacted will be definitely the Europe in this crisis and the EURO since one week is in a free fall mode.
So what to understand from EURUSD chart and what to focus on? :
- Only a Weekly Chart Basis
1/ The previous upside trend ABC 0,82 to 1,60 has been follow by a consolidation in ABC towards 1,02 (or a construction of the long-term downside swing within a huge triangle)
2/ For now the ABC downside pattern within the bearish channel seems to be finished with the test of the 1,02 support - Then we are evolving within a range/triangle dynamic (Blue Frame)
---> That the graphical situation illustrating the context above.
3/ If the ABC downside pattern is not finished we gonna see a downside breakout from the triangle/range structure on going (inside the blue frame) to open further downside risk
----> Risk = Irregular running Range (Test of the 1,0075/0,9750)
----> Risk = poursuit of the bearish channel within a complex ABC X ABC pattern towards 0,8450
4/ RSI indicators is approaching support but didn't reached the previous oversold area where bullish reaction started = It is more likely to see more bearish momentum to be developed.
5/ Moving averages are now capping the market at 1,1530
Analysis
Regarding the key elements and giving more weight to the Waves structures and the recurrence of Fibonacci levels, we can still giving more credit to see a development of a further trading range (blue frame) than a free fall of the Euro within the bearish channel towards 0,8450.
Where it is more tricky to to have conviction is between a range in irregular with the test of parity before swinging up or triangle pattern with 1,0750 as key support before developing a new upside swing
The key resistance is for now clearly set at 1,1530 and only a break out of this resitance can lower the downside risk significantly.
Trading
=> Intraday/multi days traders will use 1,0750 as stop loss level to catch the dip and play agressive recovery with for now the Moving Average as Target to watch
=> Mid-term Institutional trader seems already in restructuration of the strategy by activating action to hedge the commodities upside risk and the pressure on Europe, so i would say that the hedge in place is between 1,0750/0,97 for the downside risk and 1,1530 (Neutrality area protection to adjust option)

M for (M)aybe invading a sovereign nation wasnt such a good ideaJust made kind of a prediction yesterday since some friends were interested in the RUB hitting the floor
Original prediction made yesterday (3:42AM pacific time 28th)
And then looked at today (also the idea has this anyway).
Seemed pretty easy and I'm not sure where it will go from here or how far down it will go. It just depends on the war and any further sanctions, I guess. If it goes down like the Crimea timeframe, it should hit 0.
Did you know monopoly money has a value? Since there are a number of them in each box, and they cost paper to produce, they are worth some fraction of a USD. Possibly, it could be worth more than the ruble soon!!
Hope everyone stops this madness and people don't have to die.

$UVXY buying the dip 👁🗨*This is not financial advice, so trade at your own risks*
*My team digs deep and finds stocks that are expected to perform well based off multiple confluences*
*Experienced traders understand the uphill battle in timing the market, so instead my team focuses mainly on risk management
Recap: Bitcoin and the US markets are losing steam after rallying for the majority of the month of March. We entered $UVXY on 3/25/22 at $14.25 per share. Our take profit was set at $18.
My team has decided to average down on $UVXY at $11.75 per share which now brings our share average to $13. We have also added a 2nd take profit at $21.
SHARE AVERAGE: $13
TAKE PROFIT 1: $18
TAKE PROFIT 2: $21
If you want to see more, please like and follow us @SimplyShowMeTheMoney

GOLD LONG TO 2140We have seen a completion of Wave 3, completed with a retracement to the downside (Wave 4), giving Gold the liquidity to carry on its bullish movement. The final leg part of the bullish phase will be make Gold reach 2140-2160 this year before we see a downtrend start.
We have FOMC tonight which will bring a lot of volatility into the markets. Be careful with your positions and make sure to use risk management as manipulation is expected. Make sure to drop a like and let me know what you think!

$USOIL purely technical 👁🗨*This is not financial advice, so trade at your own risks*
*My team digs deep and finds stocks that are expected to perform well based off multiple confluences*
*Experienced traders understand the uphill battle in timing the market, so instead my team focuses mainly on risk management
!! This chart analysis is for reference purposes only !!
$USOIL appears to be on a pathway to retest its support zone for the third time. If this zone is breached, we expect $USOIL to head into the $80-$90 range.
This scenario is purely technical.
If you want to see more, please like and follow us @SimplyShowMeTheMoney

Why has the Russian ruble not collapsed yet?
Russia’s efforts to prop up the ruble appears to be working despite sanctions imposed by Western countries aimed at cutting the Kremlin’s access to external resources and crippling the nation’s ability to fund its war against Ukraine.
Last week, the ruble surged to a more than two-year high against the euro and the US dollar, recouping its losses during the war. The rally was triggered by Russia’s last-ditch attempt to avoid defaulting on a eurobond on Friday.
Russia’s finance ministry paid $564.8 million in interest on a 2022 eurobond and $84.4 million on another 2042 bond, the ministry said Friday. Both payments were made in US dollars, marking a reversal from its previous threat to pay its debts in rubles.
To begin this week, the ruble has continued its strong performance, with the USDRUB down almost 3%. As it stands, Rubles are exchanging hands at less than 69 per USD.
Rating cut to selective default
Prior to the payment of these bonds, Russia had earlier paid its dollar-denominated bonds in rubles, triggering a rating downgrade by S&P Global Ratings to “selective default.”
The rating agency said investors won’t likely be able to convert those payments into dollars equivalent to the amount due as sanctions on Russia are predicted to worsen in the coming weeks.
Gas for ruble
In a bid to bolster the ruble and retaliate against Western sanctions, Russia, one of the top oil-producing countries worldwide, required “unfriendly” buyers of the country’s natural gas to pay in rubles. While many European Union leaders were quick to reject the Kremlin’s demands, one of Germany’s biggest energy companies, Uniper, said it was ready to buy Russian gas by converting its euro payments into roubles.
"We consider a payment conversion compliant with sanctions law and the Russian decree to be possible," a spokesman was quoted by BBC as saying recently, adding that the absence of Russian gas “would have dramatic consequences for our economy.”
Russian national energy giant Gazprom recently cut off its gas supplies to Poland and Bulgaria due to their refusal to pay in rubles.
Commodity powerhouse
Many countries’ reliance on Russian oil and other commodities like wheat has helped the ruble avoid collapse and may play a role in supporting the currency moving forward.
Vyacheslav Volodin, a top Russian lawmaker, over a month ago said Russia should demand ruble payments for other commodities like wheat, fertilizer, and lumber, adding that Western governments have to pay for their decisions to sanction Russia.

URANIUMWhere is the world heading to?
Nuclear energy? hope that's all.
Since march 2020 crash, URANIUM has not stopped rising in value (+354%), and since December 2020 volume has began to rise significantly.
There is high probability that it will reach new highs, from 35 to 60 usd, during this year 2022.
As my XAR analysis, I really hope I'm wrong this time.
Check my XAR analysis here:
Peace&Love!
SolMar Traders.

$USOIL its spring time 👁🗨*This is not financial advice, so trade at your own risks*
*My team digs deep and finds stocks that are expected to perform well based off multiple confluences*
*Experienced traders understand the uphill battle in timing the market, so instead my team focuses mainly on risk management
!! This chart analysis is for reference purposes only !!
If you want to see more, please like and follow us @SimplyShowMeTheMoney

USOILUSOIL, We know that as the year goes by and for as long as #Russia attacks #Ukraine we will have fluctuating oil prices. Hence there is an opportunity here.

Natural Gas’s Price Is As Combustible as the Energy CommodityVolatility in markets creates opportunity, but as risk is always a function of reward, the more the upside, the greater the potential for losses. Since natural gas futures began trading on the NYMEX in 1990, more than a few market participants have lost fortunes in the market that has traded as low as $1.02 and as high as $15.65 per MMBtu.
Over five times higher since June 2020
US LNG to Asia was sold out for more than a decade
A very volatile energy commodity
Europe’s dependence on Russia causes supply issues
If prices in Europe are a guide, we could see a challenge to the 2008 and 2005 highs
The high came in 2005 when a devastating hurricane destroyed natural gas infrastructure along the US Gulf Coast at the NYMEX delivery point at the Henry Hub in Erath, Louisiana. Another storm in 2008 took the price above the $10 per MMBtu level but to a lower high. Over the next twelve years, the natural gas market changed. Massive discoveries of quadrillions of cubic feet of natural gas in the US Marcellus and Utica shale regions and technological advances in fracking and extracting natural gas from the earth’s crust caused the supplies to soar and the price to decline.
Since necessity is the mother of invention, two new demand verticals developed. Natural gas replaced coal in the US for power generation. Meanwhile, turning gas into liquid for transport beyond the US pipeline network created an export market for the energy commodity.
In 2020, the price fell to the lowest level since 1995 at below $1.50 per MMBtu. Since then, the bear has transformed into a bull.
Over five times higher since June 2020
The most recent peak in the natural gas futures arena took the price to $8.0650 on April 18.
The weekly chart shows the explosive move from the $1.44 level in late June 2020 to the April 18 high, over five and one-half times higher in less than two years. Moving to a multi-year high as the peak season for demand approaches is one thing, but this rally comes as the peak season ended in March.
US LNG to Asia was sold out for more than a decade
The natural gas price in Asia has been far above US prices for years. The domestic US natural gas market’s transformation and expanding the addressable market far beyond the US pipeline network has made the energy commodity and NYMEX natural gas futures market more sensitive to international prices and supply and demand fundamentals.
Cheniere Energy (LNG) is a leading supplier of liquefied natural gas that travels worldwide on ocean vessels. In 2021, Cheniere’s CEO told CNBC that the company was sold out of LNG for more than a decade after signing long-term supply contracts with Asian consumers. Asian prices were multiples of US prices, making the business highly profitable. Cheniere’s share price has reflected the booming demand for LNG.
LNG shares rose from $27.06 in March 2020 to the most recent high of $149.42 in March 2022. At the $135.70 level on April 22, LNG shares reflect the growing demand for their energy product. While the shares and revenues exploded higher, earnings have been elusive.
The chart shows the negative earnings trend since Q1 2021. A survey of twenty analysts on Yahoo Finance has an average price target of $149.50 for LNG shares, with forecasts ranging from $61 to $180 per share.
LNG is a leader, but the EPS issue could cause the stock to become as volatile as the natural gas price over the past week.
A very volatile energy commodity
While price ranges tend to widen at higher levels, natural gas volatility was head-spinning over the past week.
As the daily chart of May NYMEX natural gas futures highlights, after trading to a high of $8.065 per MMBtu on April 18, the price moved below the $7 level on April 19. Natural gas has never been for the faint of heart as the price has ranged from $1.02 to $15.65 per MMBtu since trading on NYMEX began in 1990. However, after over a decade of lower highs and lower lows, the trend changed in June 2020.
The long-term chart illustrates the trend changed when natural gas futures moved above the 2018 $4.929 per MMBtu high, ushering in a bullish path of least resistance for the energy commodity. The quarterly price ranges since mid-2021 are the broadest since 2008, the last time the energy commodity eclipsed the $10 per MMBtu level.
Europe’s dependence on Russia causes supply issues
The previous administration warned Germany and the EU about depending on Russia for natural gas supplies. Meanwhile, US energy policy shifted from “drill-baby-drill” and “frack-baby-frack” in January 2021 when the Biden Administration began fulfilling its campaign pledge to address climate change.
Stricter regulations, canceling pipelines, and bans on fracking and drilling on federal lands caused oil and gas output to decline. While it handed the pricing power in the oil market back to the international oil cartel and Russia, it also limited Europe’s options for natural gas supplies. While the administration took a hard line against US production, it supported a Russian natural gas pipeline to supply Europe with the energy commodity.
The February 24, 2022, invasion of Ukraine changed the world. While the US, European, and other allied countries came together with severe sanctions, Europe’s dependence on Russian gas remains a window of opportunity for the Putin government. Retaliating for other sanctions, Russia is now demanding rubles for natural gas supplies, boosting the currency despite other stringent sanctions.
The US government has leaned on companies like Cheniere to divert supplies from Asia to Europe. However, the administration’s energy policy has not supported the new US terminals to liquefy natural gas and increase supply capacity. Russia remains in the driver’s seat in European natural gas requirements and is free to drive the price higher.
If prices in Europe are a guide, we could see a challenge to the 2008 and 2005 highs
At the recent $8+ high, US natural gas futures rose to the highest price since 2008. Meanwhile, European prices have screamed higher in 2022.
The long-term chart shows ICE UK natural gas futures rose to $800 in March. Before 2021, the all-time high was at the $117 level in 2005. At $171.39 at the end of last week, European natural gas prices remain at lofty levels above the pre-2021 record peak.
Natural gas has transformed into a far more international commodity. The US lost an opportunity to supply Europe and remove cash flow from Russia before the first Russian soldier crossed Ukraine’s border on February 24. The revenue from natural gas sales to Europe is funding the first major European war since WW II.
Rising natural gas prices will fuel inflation and hit consumers in their pocketbooks in the US. Natural gas is another victim of inflation, the war in Ukraine, and US energy policy. Addressing climate change is a noble cause, but fossil fuels continue to power the world. The shift from hydrocarbons to alternative and renewable fuels is a multi-decade, not a multi-month process. The economic and geopolitical landscapes and US energy policy shift ignited a very bullish fuse in a very combustible commodity. Natural gas price explosions and implosions could be the norm instead of the exception over the coming months and years.
--
Trading advice given in this communication, if any, is based on information taken from trades and statistical services and other sources that we believe are reliable. The author does not guarantee that such information is accurate or complete and it should not be relied upon as such. Trading advice reflects the author’s good faith judgment at a specific time and is subject to change without notice. There is no guarantee that the advice the author provides will result in profitable trades. There is risk of loss in all futures and options trading. Any investment involves substantial risks, including, but not limited to, pricing volatility, inadequate liquidity, and the potential complete loss of principal. This article does not in any way constitute an offer or solicitation of an offer to buy or sell any investment, security, or commodity discussed herein, or any security in any jurisdiction in which such an offer would be unlawful under the securities laws of such jurisdiction.

USOIL LongHey traders, in today's trading session we are monitoring USOIL for a buying opportunity around 102 zone, once we will receive any bullish confirmation the trade will be executed.
Trade safe, Joe.

BITCOIN 6H TA : 04.21.22 (Update) Yesterday we saw that the price reacted negatively by reaching 42K and with a 3% correction to the level of $ 40800, it was able to react positively to this support level (BB +) and is currently trying to break the resistance of $ 43300. , Considering the volume of market and the power of Bulls at the price of $ 41600 on the current trading day, we can expect the price to rise above $ 43000 and wait for the price to break and consolidate above this level.
Follow us for more analysis & Feel free to ask any questions you have, we are here to help.
⚠️ This Analysis will be updated ...
👤 Arman Shaban : @ArmanShabanTrading
📅 04.21.2022
⚠️(DYOR)
❤️ If you apperciate my work , Please like and comment , It Keeps me motivated to do better ❤️

FTSE UK100 could go downWe have not very good situation with inflation
Still there is a war
All major indexies had bigger corrections but uk100 has not
and of course we are going up and hitting to ATH resistance soon
so in my opinion the price could drop a little bit 2-4% to the downside.
we will see, it's not a recomendation but I'm curious what do You think. It here any other 'someone' who is shortin this index? hm.. ?

$BTC the royal flush 👁🗨*This is not financial advice, so trade at your own risks*
*My team digs deep and finds stocks that are expected to perform well based off multiple confluences*
*Experienced traders understand the uphill battle in timing the market, so instead my team focuses mainly on risk management
!! This chart analysis is for reference purposes only !!
PSA: Get one thing straight with us, we are not rookies. Lately we have been on the receiving end of some haters who do not agree with our chart ideas and trades. We are here today to say, "keep the hate coming." Every single one of these guys so far have been proven wrong so it's pretty amusing.
Anyways, our thoughts on Bitcoin $BTC have not changed since our last Bitcoin post. It is still in a bearish trend, and things could get much uglier if earnings this week are a bust. Tesla $TSLA and Netflix $NFLX are to report earnings this week which could impact the price of $BTC drastically. $TSLA, Apple $AAPL, and the S&P500 $SPY are mirror images of each other right now. None of them look bullish. Global economic shifts due to the Russian x Ukraine war are likely to dent the share prices of the companies that make up the majority of $SPY this season.
Must we also mention that there is supposedly a high-rate hike coming in May?
Or that Russia will likely use tactical nukes in Ukraine soon?
If Russia does use tactical nukes, we expect markets to fall-out temporarily. World War III talks will be the buzz that drives the markets down for the proceeding days or weeks until a resolution is found. Afterwards, the market will be on the receiving end of a relief rally.
These are simply our current thoughts and opinions, and they are subject to change...
Happy investing!
If you want to see more, please like and follow us @SimplyShowMeTheMoney


$US30 the glass house 👁🗨*This is not financial advice, so trade at your own risks*
*My team digs deep and finds stocks that are expected to perform well based off multiple confluences*
*Experienced traders understand the uphill battle in timing the market, so instead my team focuses mainly on risk management
!! This chart analysis is for reference purposes only !!
$US30 has been consolidating outside of our bearish channel for the past 2 weeks. Many traders automatically assume that this is bullish, but appearances can sometimes be deceiving. My team still expects a strong bearish move to take place within the next couple of weeks, but it may retest 35350-35850 before that happens.
Overall, the market appears to be waiting for a catalyst to justify an impulsive move down. Our guess is that repercussions/escalations from the Russian-Ukraine crisis will kick this move into motion before May arrives.
If you want to see more, please like and follow us @SimplyShowMeTheMoney
