UMA/USDT Weekly Analysis – At the Edge of Compression?📉 Chart Overview:
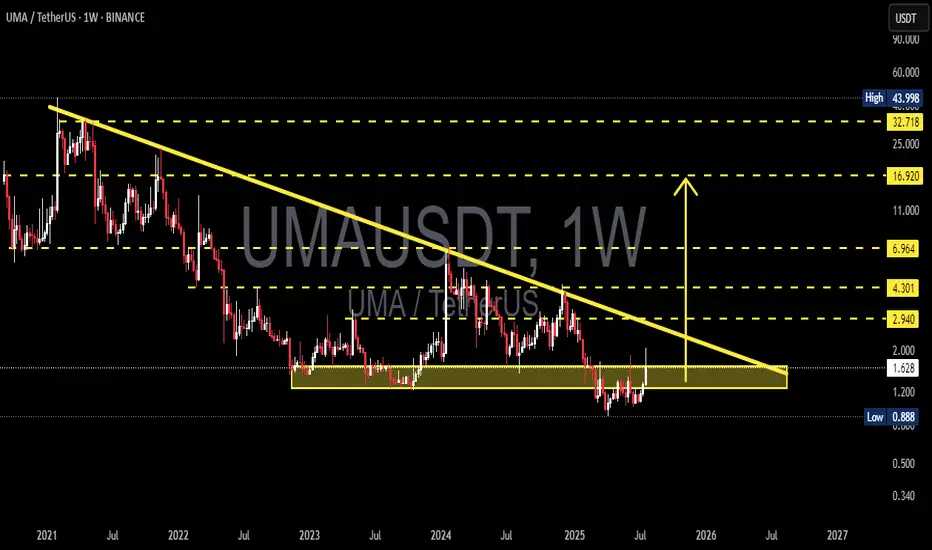
UMA/USDT has been in a long-term downtrend since its peak in 2021. For nearly three years, price action has been trapped within a descending triangle pattern, forming consistent lower highs while holding a strong horizontal support zone around $0.88 – $1.20.
Over the last two years, UMA has been consolidating sideways, creating a massive accumulation base. Now, the price is sitting just beneath the descending trendline, putting the asset in a critical compression zone — a potential breakout could trigger a major trend shift.
🔍 Technical Pattern Breakdown:
Multi-year Descending Triangle structure with a well-defined horizontal base.
Long-term accumulation zone between $0.88 – $1.20, repeatedly tested but not broken.
UMA is currently pressing against the descending resistance line, building pressure.
Setup hints at a compression breakout, often leading to explosive moves when volume confirms.
🟢 Bullish Scenario – If Breakout Confirms:
If UMA breaks out convincingly above the descending trendline (~$1.85) with a weekly candle close and strong volume, the market could start targeting these levels:
1. ✅ $2.94 – First horizontal resistance from prior breakdown zone.
2. ✅ $4.30 – Key structure from mid-2023.
3. ✅ $6.96 – Larger swing target from historical resistance.
4. 🚀 $16.92 – Mid-to-long term target if bullish momentum sustains.
5. 🎯 $32 – $43 – Potential long-term upside under extreme bullish conditions (not base scenario).
Bullish Confirmation Signs:
Weekly candle close above trendline + high volume
RSI breaks above 50 with momentum
Bitcoin remains stable or bullish
🔴 Bearish Scenario – If Rejected Again:
If UMA fails to break the trendline:
Price could drop back into support: $1.20 → $0.88
A breakdown below $0.88 would open the door to new all-time lows
Watch for wicks and volume drop as signs of weakness
When Is Breakout Considered Failed?
Strong rejection from $1.80–$1.90
Weekly close back below $1.20
Broader market (especially BTC) turns sharply bearish
🎯 Trader Strategy Outlook:
Swing traders: Wait for breakout confirmation and retest before entering.
Long-term investors: The $0.90–$1.20 range remains a solid accumulation zone with tight risk management.
Conservative traders: Avoid entry until a clear close above the descending trendline.
📌 Final Thoughts:
> UMA is now positioned at a major inflection point after two years of sideways compression. The chart structure shows clear signs of long-term accumulation, and a breakout could mark the beginning of a new bullish trend cycle. However, patience and confirmation are crucial — this is a setup worth watching, not chasing.
#UMAUSDT #UMA #CryptoBreakout #TechnicalAnalysis #DescendingTriangle #AltcoinSetup #SwingTradeOpportunity #CryptoAccumulation #BreakoutWatch #PriceAction
Umalong
#UMA/USDT#UMA
The price is moving within a descending channel on the 1-hour frame, adhering well to it, and is heading toward a strong breakout and retest.
We are experiencing a rebound from the lower boundary of the descending channel, which is support at 1.36.
We are experiencing a downtrend on the RSI indicator that is about to be broken and retested, supporting the upward trend.
We are heading toward stability above the 100 moving average.
Entry price: 1.41
First target: 1.45
Second target: 1.50
Third target: 1.57

#UMA/USDT#UMA
The price is moving within a descending channel on the 1-hour frame, adhering well to it, and is heading for a strong breakout and retest.
We are seeing a bounce from the lower boundary of the descending channel, which is support at 1.36.
We have a downtrend on the RSI indicator that is about to break and retest, supporting the upward trend.
We are looking for stability above the 100 moving average.
Entry price: 1.39
First target: 1.42
Second target: 1.45
Third target: 1.49

UMAUSDT – Critical Level at 1.278!UMAUSDT – Critical Level at 1.278! 🚨
“If 1.278 breaks, we’re flipping bearish—and we won’t hesitate to short!”
🔥 Key Insights:
✅ 1.278 = Make-or-Break Level – Holding = bullish continuation, breaking = serious trouble.
✅ First Retest = High-Probability Short Zone – If we break, we wait for confirmation.
✅ Aggressive Approach? Direct Short on Breakdown – For those who love momentum plays.
💡 The Game Plan:
If 1.278 Holds – We Stay Bullish – No reason to fight the trend.
If 1.278 Breaks – Short on Retest or Directly – We trade what we see, not what we hope.
CDV & Volume Profile Must Confirm Weakness – If buyers disappear, we attack.
“Markets don’t lie—if this level gives way, we strike without hesitation!” 🚨🔥📉
A tiny part of my runners;
💼 STMXUSDT: 2 Buying Areas
🐢 TURBOUSDT: Buy Zones and Buyer Presence
🌍 ICPUSDT.P: Massive Upside Potential | Check the Trade Update For Seeing Results
🟠 IDEXUSDT: Spot Buy Area | %26 Profit if You Trade with MSB
📌 USUALUSDT: Buyers Are Active + %70 Profit in Total
🌟 FORTHUSDT: Sniper Entry +%26 Reaction
🐳 QKCUSDT: Sniper Entry +%57 Reaction

UMAUSDT 1WUMA ~ 1W Analysis
#UMA This is the lowest support for now. Buy from here if you still have a Conviction on this coin with a minimum target of 20+

UMAUSDT 1WUMA ~ 1W
#UMA retest this support block,. And still continues to maintain its bullish structure. If you still have Conviction on this coin,. This support block will be a good buying place for now.

UMAUSDT 5DUMA ~ 5D
#UMA If you still have Conviction on the coin,. buy in stages from here. with a minimum target of 20%. It is only a matter of time until this resistance line is broken

UMAUSDTNSE:UMA ~ 5D
#UMA If you still have Conviction on this coin, buy gradually on this support block. Minimum target 20%++

UMAUSDTUMA ~ 5D ✅
#UMA Make purchases gradually in this pattern. In our opinion, it is only a matter of time that this descending pattern is successfully broken.

UMA token completed a setup for upto 16.50% pumpHi dear members, hope you are well and welcome to the new trade setup of UMA token with US Dollar pair.
Previously we caught 33% pump of UMA as below:
Now on a 2-hr time frame, UMA has formed a bullish AB=CD move for next price reversal.
Note: Above idea is for educational purpose only. It is advised to diversify and strictly follow the stop loss, and don't get stuck with trade.

#UMA/USDT#UMA
The price is moving in a bearish flag channel on a 12-hour frame and we have a support area in green at the level of the lower border of the channel at the price of 3.50.
We have a tendency to stabilize above the Moving Average 100
The RSI indicator has a downtrend that is about to break higher
Entry price 3.877
The first goal is 4.485
Second goal 5.54
Third goal 6.97

UMA completing a setup for upto 19% pumpHi dear friends, hope you are well and welcome to the new trade setup of UMA token with US Dollar pair.
Recently we caught 12% pump of UMA as below:
Now on a daily time frame, UMA is about to complete a bullish Gartley move for next price reversal.
Note: Above idea is for educational purpose only. It is advised to diversify and strictly follow the stop loss, and don't get stuck with trade.

🚨#UMA/USDT lONG#UMA
The price has been moving in a head and shoulders pattern since July 2022
Moving average 100 was broken
We are now at the right shoulder of pattern
Current price 2.18
First goal 3.56
Second goal 4.26
Which represents 200% of the current price

order-block...?(UMA)📊Analysis by AhmadArz:
how you find order-block?
🔍Entry: 3.40
🛑Stop Loss: 2.99
🎯Take Profit: 4.02
🔗"Uncover new opportunities in the world of cryptocurrencies with AhmadArz.
💡Join us on TradingView and expand your investment knowledge with our five years of experience in financial markets."
🚀Please boost and💬 comment to share your thoughts with us!

#Uma/USDT#Uma
The bearish channel on the daily frame has been broken
Now the downward trend is being tested again
The price is expected to rise again from the entry areas marked on the chart
About the price of 1.410
With a goal of 2.44
Nearly 200% expected rise
Supported by Bitcoin's bullish movement

UMA token formed bullish Gartley for upto 10% pumpHi dear friends, hope you are well and welcome to the new trade setup of UMA token with US Dollar pair.
Previously we caught almost 65% pump of UMA as below:
Now on a 4-hr frame, UMA has formed a bullish Gartley move for the next price reversal.
Note: Above idea is for educational purpose only. It is advised to diversify and strictly follow the stop loss, and don't get stuck with trade.


UMA token forming bullish Gartley for upto 35% pumpHi dear friends, hope you are well and welcome to the new trade setup of UMA token with US Dollar pair.
Recently we caught more than 66% pump of UMA a below:
Now on a 4-hr time frame, UMA has formed a bullish Gartley pattern for the next price reversal.
Note: Above idea is for educational purpose only. It is advised to diversify and strictly follow the stop loss, and don't get stuck with trade

UMA LOOKS BULISH HEREForming Falling wedge In daily Timeframe
Also Printed Massive Bulish divergence In Rsi
Incase Of Breakout expecting Massive Bounce

Trading opportunity for long position UMAUSDTBased on technical factors there is a Long position in :
📊 UMAUSDT
🔵 Long Now 2.355
🧯 Stop loss 2.166
🏹 Target 1 2.700
🏹 Target 2 3.200
🏹 Target 3 3.900
💸RISK : 1%
We hope it is profitable for you ❤️
Please support our activity with your likes👍 and comments📝

UMA/USDT - PULLBACK AND UP AGAIN !Just made nice 40% profit on trade which is also shown on chart.
RSI now is very high, it need to cool and go down.
I marked buyzone and possible scenario for price and RSI movement in WHITE colors.
Share your ideas and thoughts.

UMA BRECKOUT! READY TO PUMP 100%!Hi guys, This is CryptoMojo, One of the most active trading view authors and fastest-growing communities.
Do consider following me for the latest updates and Long /Short calls on almost every exchange.
I post short mid and long-term trade setups too.
Let’s get to the chart!
I have tried my best to bring the best possible outcome in this chart, Do not consider it as financial advice.
UMA is breaking out from the bullish pennant pattern. I'm expecting a big move from it. Buy some now and hold it for some time.
Entry range:- $8-$8.3
Target1:- $9.6
Target2:- $11.2
Target3:- $13.4
Target4:- $16
SL:- $7.5
This chart is likely to help you in making better trade decisions if it did do consider upvoting this chart.
Would also love to know your charts and views in the comment section.
Thank you

After My Alert This Morning, UMA Pumped 70%! Amazing!
After an alert I put out to subscribers this morning, UMA went parabolic! Congrats to those who followed me! Is it altcoin season yet? And a little about bitcoin and where it needs to close today.
