Inflection PointBKI caught my attention for a few reasons.
1. Held by Scion Asset Mngt- if you haven't heard of them or Michael Burry, check it out. Crazy returns off the financial Crisis.
2. SP sitting at an inflection point at bottom of long term demand zone and near lowest long term demand zone.
3. BKI's shiller PE ratio range over the past 10 years is from 36.26-43.09 and currently sitting at 37.37 implying that it is near its lowest valuation in 10 years.
4. Mornings Star Fair Value market valuation sitting at $61.1. My own target of $77.5 is based on a Fibonacci retrace of 61.8% of 2020 highs.
Undervalued

Alibaba (BABA) is undervalued right now.Although Alibaba experienced a downturn in its financials in 2022, it still meets the requirements of a great business.
PS: "Intrinsic Value by zdmre" has not been published yet!
#DYOR

Technical Pull back Buy the DIP!The slight gross margin decrease of 4.8% was enough to resume the HS pattern on the chart executing a normal pullback- relative to the "neckline" where HS patterns are confirmed with some other criterion. Despite the quarterly margin contraction, expected cost reductions should start to materialize in 2024. Everything on the income statement is trending in the right direction. If TSLA really does hit the pattern target of HKEX:80 , a 50% further decrease from current SP, which is based on a formula of probabilities for this specific pattern, then it will be 62% undervalued.
At SP of 80, subtracting the 5.14 of Cash per share, and using current TTM, the PE would be 21! Even with a PE of 49 GAAP TTM , the difference to sector is 222% and FWD PE of 50.5. However several different metrics between growth and profitability could easily justify it where its at now. EBITDA growth YoY 3,607% diff to sector,/ FWD 690% diff to sector; Rev Growth Fwd 393%. EV/EBIDTA FWD 180 % diff to sector. Net Income Margin TTM 247% diff to sector. ROC TTM 193 and ROA TTM 289% differences to sector... Easily justified.. Rarely are you able to purchase growth companies at a PE of 21... Buy the DIP!

Breakout on Battery Production NewsPositive divergence can be seen on a yearly basis with MACD leveling out crossing into positive territory.
SP appears to have formed a double bottom and is currently breaking out from a narrower down trend.
Currently, the SP is ≈33% below the average analyst target and ≈45% below the top range of down channel primary trend.
The SP collapsed last year as a result of the public offering in December, cash burn rate and a gross loss for the most recent quarter.
Revenue YoY has grown 142% and revenue growth FWD is 118%. With the high growth rate and being profitable on a yearly basis, a PE of 22 is cheap.

Is Solar Integrated Roofing (OTCPK: SIRC) an undervalued stock?Solar Integrated Roofing Corp (OTCPK: SIRC) stock gained 27% on February 2nd and saw a total gain of 100% in the last one week.
The company announced a $25 million drawdown term note from an institutional investor with a 6% interest rate and a 5% discount.
The CEO believes the term note and cost control efforts will help optimize operating cash flows and profitability, leading to sustainable, long-term value for shareholders.
Solar Integrated Roofing Corporation specializes in solar roofing systems and has seen a significant increase in sales and net income in recent quarters

Huge breakout MicroCap after yrs consolidation Just shy 52wk hiIntermap Technologies was held back by government covid shutdown contract delays, but has now signed more new contracts this year alone than it's entire current market cap. The company was just selected for position by the US Airforce under a 5 year $950,0000,000 Advanced Battle Management System contract.
Link Here:
www.intermap.com
The company continues to grow and expand its cloud recurring software due to its world leading and proprietary mapping technology. They have signed HUGE New Multi Million Dollar contracts with Governments, Insurance companies (for managing flood, drought, and fire risks), Telecom Giants, Airlines, and Urban Air mobility Drone companies.
Recession proof business with recession proof clients. Just hoping they aren't bought out so this position can +10x in the next few years.

BAJAJ FINANCE DETAILED MACD ANALYSIS!! DISCOUNTED NIFTY 50 STOCKin this idea i will be explaining you the MACD analysis done by me. but firstly let me run you through the chart.
THE TREND LINES:
RED LINE: its the trend followed from past several years before the 2020 crash.
DARK BLACK LINE: it is drawn out from the market getting consolidated and from the bull rally post the corona's crash. its the actually trend which should be followed by the stock at present. this helps to determine how much is the stock discounted by.
BLUE LINE: this are the short term resistence followed by the stock.
EXPLAINING THE MACD ANALYSIS:
THE DARK GREEN sticks represents a bull momentum
THE LIGHT GREEN sticks represents the stock correcting, after having several dark green sticks
THE DARK RED sticks represents a bear momentum
THE LIGHT RED sticks represents the stock having an impulse move after the correction, and coming back to its original trend.
MACD ANALYSIS DONE IN DETAIL:
i have wrote down some numbers on MACD explaining my analysis(be with me till the end).
based on the numbers i will be writing the points:
NUMBER 1 REPRESENTS: the macd being always been in the green stick(light and dark), representing having a bull rally and a correction after it, but staying within the trend.
NUMBER 2&3 REPRESENTS: the 3 dark red sticks, showing the 2020 crash. now, since it has to be valued right, the minor red sticks showed an upward momentum to bring the stock again in its original trend.
NUMBER 4&5&6 REPRESENTS: the bull rally post the crash, and the correction followed by it. NUMBER 6 is also a major correction because of MAJOR FII STAKES SELLING.
NUMBER 7 REPRESENTS: a small momentum gained by stock after NIFTY 50 finished correcting, and had a bull rally(dated- 20th of June). and even including the stock split news. but this smal momentum had broken the blue trend line, showing a breakout, and a bullish sign. but from past 3-4 months the stock is following lower highs pattern, and it has sent to its previous red line trend. some possible reasons could be said, one of such could be current market conditions.
THE CIRCLED PART(in macd): but finally a red stick shown, had made me to think that instead of breaking the lower highs pattern, the stock is falling majorly, and reaching its greatest support of trend line(6560).
(average macd been followed by the stock was 90, and post corona it should be around 110.)
RSI:
the overall rsi indicator is slowly falling, showing that stock may not be moving as it was moving much before. but this can only be conformed seeing the sector growth.
WHAT AM I DOING: i will wait till the stock reaches bottom, and then start keeping a keen eye on its price movements, if its starts going up, i will make 3 positions 6560, 7300 and 8150(based on the patterns and trends). if falls, then cant tell, but one could then tell the stock is much undervalued. but this will pretty much not happen because NIFTY FIN SERV index, to needs to go up for a long. and same is for this stock.
THANK YOU FOR STAYING TILL LAST. I HOPE YOU LIKED MY ANALYSIS:)

Why PayPal ( $PYPL) is one of my TOP long call "position trades"Why I like PayPal PYPL
Back to 2017 levels, pretty much "recession proof" (give or take). It's almost God sent being down at these levels (undervalued/fair value). There are some strikes that are def. set up for nicely profitable positions if chosen correctly, common shares as well. Though I hid a lot of my indicators for a simple view, there is def. a divergence between price and RSI on both the Daily & Weekly, as well as the Monthly looking pretty bottomed out. I am pretty big into Harmonic patterns , but am not going to share my "secret sauce", at this current time.
I will continue to add to my position and average down (as planned) into further out strike dates. I as well will MOST LIKELY play the short term trends as well, but my overall goal is to see at least $115.00 with my "position trade" call contracts.
I typically leaves these "ideas" pretty brief on Trading View as I don't really have a BIG following on here
If you have any questions about my "idea" feel free to reach out!
(This is a repost as I had some community violations I was unaware about)

SOLANA undervalue areas for buyHi guys.
solana ecosystem record a high TVL in past month and have a potential to grow in coming months.
but we are in a downtrend now and altcoins loss their marketcap in this cycle.
after SOL reach strong resistance in 45$ react and go down again and cant support in 40 support level.
so we reach under this level and we have a good support in around 35$.
i think we will see a strong support in this level and a good area FOR BUY ONE STEP.
after that if we see demand signs we could buy another step or if not we buy a step in lower prices like 28 or 25$.
remember the ecosystem TVL growing and have a good potential too pump up after FOMC place its interest rate and market
eat it :)


Tellurian Daily Time Frame Analysis 5/10/22Todays wick shows good resistance off the 200ma. I am looking for a gap fill as shown on chart, especially with the anticipation that we hear good results on the consumer price index(CPI).

ALI BABA : SELL OR BUY ??The last time that the price was around 100 $ was at the IPO (2014) and then between AUG 2016- JAN 2017
TOTALL ASSET :
IPO(2014) : 41.27 B
2016: 73.55 B
2017: 114.01 B
2020: 257.86 B
2021 :276.25 B (UNTIL Q3)
GROSS PROFIT :
IPO(2014) : 8.12 B
2016: 14.05 B
2017: 20.66 B
2020: 42.09 B
2021: Q1 + Q2 +Q3 =37.25 + Q4(9.03)(IF WE CONSIDER SAME AZ Q4 OF 2020) = 46.28 B
P/E FORWARD = 7.40 !!!
P/S =2.12 !!!
P/CASH FLOW = 0.10
P/B = 1.79
RETURN ON ASSET = 3.86%
QUICK RATIO = 1.65
DEBT / ASSET RATIO = .08
All these items show the prices are not permanent.

Buy Modern Dental HK$3.4 Target Over HK$ 7.5Good Day Fellow investors!
When looking for a company that is
1. Globally Diversified
2. Highly undervalued from a free cash flow perspective
3. Has decent growth potential (Over 10%)
choices are limited! However Modern Dental does meet all of these criteria..
1. Revenues are globally diversified with about 35% coming from Europe 25% USA and 40% Remainder of the world including a larger and larger share coming from mainland china.
2. Trading at about a P/E Ratio of 9. EV/EBITDA about 6. Free Cash Flow yield of about 15%.
3. Growth outlook is great. Chinese revenue grew at a rapid pace over the past couple of years but the outlook is even better.
I am loking at this from a long term perspective and believe we can easily trade at HK$ 7.5 over the next coouple of years (And likely even sooner)

BNPL for 90%SOFI could be benefited for all the world caos, the BNPL model let the people a chance to buy thing now, an express credit when there is a liquidity crisis, improved performance, technically you can find different patterns that let you know how big this upside could be, we are oversold, we are pre IPO

From 28% to 40%I love under armour the company is always innovating, and the sales are strong every quarter, so this we have a good one here, 2 Flags, the movement should be relatively faster.

TSLA is currently not a buy neither a sellTSLA volatility increased heavily since Oktober 2021, this makes it more worth for Daytrader but less for Investors.
Technically we are in a regression and we need to watch the mark $950 a lot. It seems we are creating a new channel between the two yellow lines, this means currently TSLA is overvalued at $950+ and undervalued at $750-.
But due the volatility this is only meaningful if we keep the channel, the situation can rapidly change if we break one of this lines, as I said, not a nice situation for long term Investors.
So keep on watch.

FUV MOST UNDERVALUED ASSET ON EARTHBounce from 4ish was almost a 2X. awesome trade for me. bought back the dip hard and this spread looks massive especially combined with news catalysts new factory new product and market stabilizing. This movement could be major IMO.

Gujarat Industries Power Co Ltd (GIPCL)Gujarat Industries Power Co Ltd
Book Value ₹ 195
CMP :79
Undervaued Stock
Sales more than market cap
Debt Free Stock
Dividend yield
EPS last year 12.1
Reserves ₹ 2,791 Cr
this canbe a big multibagger

XRP - The Worst Is Behind Us As BTC has corrected it pulled the rest of the market with it, as expected of course. BTC dominance is still mostly the same which indicates that the at season is still to come. XRP has hold $0.50 coming down as low as 0.55. Not all of the alts has held summer lows, but that does not mean tha they are not in a bull run. XRP did hold summer lows however and that is what s most important here.
I expect btc to still re-test its lows so i have to have same expectations for XRP. Alts likely will not go anywhere before BTC starts to go into a retracement. Expect all this to start somewhere next week or so. We still have to work those lows a bit but after that XRP should explode with the rest of the alts that are THAT undervalued. We've been coiling up sooo long with the price that having expectation for the parabolic rise very soon is not an over exaggeration.
I am not a financial advisor so non of this should be taken as a financial advice.
BINANCE:XRPUSDT

Roblox looking good at these levelsHello Friends!
I’m liking Roblox here at these levels. The average analyst PT for 2022 is $105. IMO this is set up nicely for a short term trade and/or long term hold.
My price targets for the short term are…
#1: $71.90
#2: $77.82
#3: $85.96
Support price is $54
As always thanks for your follows, likes, and comments. Let’s learn and grow together. Cheers!

KADENA WILL ENTER PRICE DISCOVERY! UNDERVALUED PROJECTHello Traders!
Today we will consider the trading pair KDA/USDT
First-off, from a fundamental point of view, Kadena is a solid project with appealing Use Cases
Launching one of the world's first scalable ready for application,
Public braided blockchain,
Delivers Security & throughput, with a mission to unite public applications, private blockchains, and other interoperable blockchains in one place, driving traffic to the high-bandwith computer at the heartof the Kadena public blockchain.
Ohh, Forgot to mention it processes more transactions per second than solana. 480,000 transactions/second compared to Solana's 2,777 all thanks to it's braided chains.
Moving to the Technical Aspect of things, the chart above suggests Kadena is undervalued coupled with it's fundamentals.
Bullish Divergence formed complicated things, therefore we consider multiple scenarios if not all.
Currently in a large degre 5-way impulse move(orange), price action is yet to complete the 3rd wave.
3rd wave consisting of a smaller degree 5-way impulse move(blue) looks to be either in the 4th (correction) wave still, or on coure for it's 5th impulse wave to complete the larger-degree 3rd wave.
(Still holding it's ascending trendline, white pathway looks valid for the time being)
Highlighted are pathways price could follow, each following the rules of the wave count.
DCA zone/240(1) support is a good area to grab some irrespective of which scenario plays out.
Blue support zone down at the D4 support area(0.618 support) is the best place for large buys and to go long.
Green confluence zone is a take profit area with confluence irrespective of which scenario plays out,
Blue Resistance zone is Main target should wave 5 be much longer than wave 1.
Either way, Wave 3 looks to be the longest making this a Third Wave Extension.

BTC undervalued under 39kLog regression indicates BTC's fairvalue is about 39k. Anything below that would therefore be undervalued. Above, overvalued. We're close to fairvalue, awaiting the next significant move back to the upside or down.

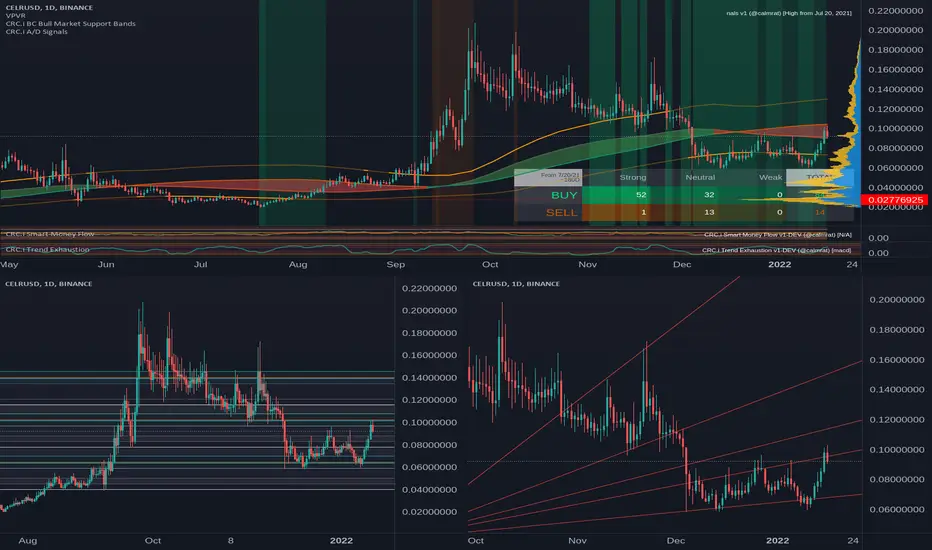
CELR getting dirty with SupportLike LINKUSD, SOLUSD, ENJUSD, all trading within their bull market support bands, CELR is a first mover towards the upside too.
Continuing to put along in this accumulation zone between .06 and .09, it seems the whales have been fed and are ready to go home for a nap. With strong support at .092. Which aligns with the bottom of the bull market support bands -- 20w sma, 21w ema. There's good support growth between 0.08 and 0.06, unpleasant as it's been to get through it.
If CELR can hold these levels, ideally move up to market high resistance at 0.13, as BTC and ETH trade sideways or rise, we're gold. Moving towards liquidity at $0.11 seems like a good first step, ideally slicing through higher market ristance level at $0.13 and never slowing down. Always dreaming...
FIB Golden pocket on the downside is near .065. Not surprisingly, I can see a way where we are right at it's door. Same goes for Gann. A 0.65 CELR would be fibulous! ;)
There's been a lot of good days to buy these past months. Nothing lasts for ever...
Are you buyin' CELR?