Retail breaking outOn the news we could see some re-openings of the economy in certain states.
Retail is breaking out of a 2-week consolidation channel; after a double bottom April 3rd.
RSI @60, is in an uptrend. (Bull)
OBV is still consolidating (Bear)
We are testing the 50% fibonacci retracement line at $36.5 (closing price will be important)
Undervalued

CDEV DOUBLE BOTTOM :)
Cdev bounced from double bottom and is directing to high numbers now.
MACD and RSI + mfi look great!
Looks like it can go straight to 0.59$ or then even to 2$.
Veeery undervalued company when looking on price / booking value etc.

Bullish on AMC stockBears have dramatically discounted this already over-discounted stock... Honestly I'd definitely look to buy anything below $4.60 (if you can!). I don't see these prices lasting long.
As with any stock that is bottoming, don't go all in thinking it's at a bottom and then panic sell because it drops (or goes up) 10 or 20 cents. That is exactly what caused this to keep dropping in the first place! You want to see a bottom form and a fast (or steady) move upward. Then wait for the dip and start buying at the support level or just above/below.

Value Investment - BATS - Defensive StockAll comments and likes are very appreciated.
_________________________________________________________________________________________________________________
Fair Value and Profit Drivers
Our fair value estimate for BAT’s ADRs is £46, which implies 2020 multiples of 15 times earnings, 12 times EV/EBITDA, a free cash flow yield of over 6%, and a dividend yield of 4%. These are roughly in line with historical valuations and are sandwiched between those of Philip Morris International, BAT’s closest comparable with slightly higher implied multiples, and Imperial Brands. This is appropriate, in our view, because it reflects the companies' relative positioning in the heated tobacco category.
The key underpinnings of our valuation are the pricing power of the combustible business and the sustainability of operating margins. We assume a midcycle organic sales growth rate of 2%, below our 4% benchmark assumptions for consumer staples but roughly in line with that of Philip Morris. The growth rate is driven entirely by pricing power, boosted by BAT's wide economic moat. We forecast an annual volume decline of over 2% on average over the next five years, with price/mix of 5%, a touch below the levels of recent years.
On an adjusted basis, and excluding equity income, we forecast a normalized EBIT margin of 43%. This is 5 percentage points above the margin achieved in 2018, boosted by the integration of and synergies from the higher-margin Reynolds business (it achieved a 45% EBIT margin in its final year of independence) and in line with our assumption for Philip Morris International. BAT has guided to synergies of $400 million per year within three years by management, and from BAT’s own cost-efficiency efforts.
We assume a stage II EBI growth rate of 3.5% and a discount rate of 7.4%.
________________________________________________________________________________________________________________
There were few surprises in British American Tobacco's preliminary 2019 results, with volume and revenue roughly in line with our forecasts, although operating profit was a little light. We are reiterating our GBX 4,500 fair value estimate and wide moat rating. The stock is materially undervalued in our opinion, and we think the market is pricing in too pessimistic a scenario, but the realization of the upside to our fair value estimate may depend on an improvement in total nicotine volume trends, a factor that these results show remains uncertain.
BAT's revenue grew 5.7% on a reported basis and by a similar amount on a constant currency, adjusted basis, slightly above our forecast. The modest beat was entirely due to strong price/mix, with volume in line with our expectations. Our expectations were not particularly ambitious, however, and we would like to see stabilization in the 4.4% decline in full year tobacco volume. Developed markets are the drag, with volume in both the U.S. and the Europe and North Africa segments down 6% in 2019. By category, combustibles declined at a rate slightly faster than 6% in both regions, mitigated by double-digit volume growth in vapour and triple-digit growth in modern oral and heated tobacco. These categories remain too small to move the needle in the top line, however, and the group volume decline of 4.4% is below BAT's recent historical average, and implies a contraction in the nicotine market as a whole. A continuation of that trend is what we think is being priced into the stock.
The critical issue for investors is whether volumes can normalize. At present, very strong price/mix (of 10% in 2019) is supporting revenue and earnings growth, but we worry that sustained pricing at this level will eventually lead to increased price elasticity and slow revenue growth. Our valuation assumes a growth algorithm that is more balanced between volume and pricing.
Business Strategy and Outlook
The advent of e-cigarettes has created the most significant change in the industry since the 1960s. Early forms of e-cigarettes have existed for a generation, but with the consumer arguably less brand-loyal and more aware of health issues than ever before, the industry is on the cusp of a seismic shift to next-generation products. It seems likely that conventional tobacco will remain the driving force of the industry profit pool for at least the next decade, but Big Tobacco manufacturers are nevertheless placing their bets on the new categories most likely to win share of smokers.
To date, British American Tobacco probably has the most hedged position across the emerging categories. Its Vype brand has gained some traction in the U.K., while the acquisition of Reynolds gives it access to Vuse. The company's total 2018 research and development spending of GBP 105 million is well below the $383 million (GBP 295 million) spent by PMI last year, and the $2 billion (GBP 1.6 billion) of capital expenditures its rival invested in its heated tobacco facility in Bologna, Italy. In heated tobacco, BAT's Glo has taken tobacco market share of around 5% in Japan in 2018, although it lags PMI's iQOS. We believe heated tobacco is the category most likely to successfully attract smokers, but we do not regard the first-mover advantage as being sustainable in the long term, and it is possible that BAT will regain share through next generation products over time.
BAT has doubled down on the combustible business with its acquisition of Reynolds American. We see Reynolds as an incredibly strong asset in a market with plenty of remaining potential for raising prices, and we view the deal positively from a strategic standpoint. The Newport brand is experiencing volume declines at a much slower rate than the rest of the U.S. industry and retains very strong pricing power in the midsingle digits. Nevertheless, it is this aquisition and the increased exposure to the menthol category that is a key reason for the recent weakness in BAT's stock, and the overhang of potential menthol regulation is not likely to ease in the short term.
I and/or others I advise hold a material investment in the issuer's securities.
_________________________________________________________________________________________________________________
All comments and likes are very appreciated.
Best Regards,
I0_USD_of_Warren_Buffet

BNB, Resist @ $26.25, $30, $35, $43 – eventually $200I started buying BNB when it was around $2.50 but had sold all my holdings last year to pay for software development. I recently started buying back in as BNB broke out of a 7 month descending pattern at the beginning of February. But it was more than just breaking out of a 7 month descending pattern that is worth noticing. BNB had also crashed through the 2 year ascending trendline in a clear retention of the 7 month descending pattern over the 2 year support. It should be noted this very closely mimics BTC which had an almost 7 month descending channel, saw a bottom on the same day (16.Dec.2019) but BTC broke out of its descending channel mid-January, 2 weeks before BNB. There are still numerous others reaching breakout points soon, BTC willing.
As of yesterday, 9.Feb,2020, we managed to surge back up above the two year trendline but we were stopped at a fairly strong historical horizontal resistance around $26.25. Not shown completely in this chart, this line also is the cap of a previous ATH along and as acting support last summer. This could be a fairly tough resistance to break and we haven’t even fully established that we will retain our position back on top of the major ascending trend line yet. This seems to leave a fairly good opportunity for a small wedge to form here. In the event that we do wedge here, look for a break out very early march.
We could keep running up from here but just as we stumbled at $26.50, we can expect a good chance of another noticeable hiccup at $30 where we see $30 logical resistance, some recent previous soft resistance/support and a potential diagonal trend resistance. Past $30 we will see 2x or 3x soft resistance at $35 and then a potential hard resistance at our previous ATH around $43.
I believe gauging against similar traditional market valuations, not even counting future growth, BNB is hugely undervalued and really should be around $200 a piece, conservatively. So what to expect next, -A fairly significant resistance at $26.25 , less but notable resistance at $30 , a small hiccup at $35 and a fight for the ATH after that. In the short term keep an eye on that 2 year resistance, if we fall back under and find it as resistance again, it’s a strong sell signal. Long-Term, I see a hold to $200 then re-evaluate. It may take a couple years but $200 is coming . (See fundamentals overview below)
Fundamentals:
I can trade BNB long with confidence because I have a great deal of faith in its long term price action. There is a lot of angst against Binance in the crypto community but not only did/does Binance provide a lot of projects liquidity that they needed to get this far, they have worked tremendous legislation efforts enabling numerous countries a gateway into crypto. Binance has also have been buying back and burning BNB with some of their profits every quarter. And lets talk about those profits, $1Billion profit a year with a $3Billion market cap. Schwab and TDA trade at a 30 P/E and here, BNB is literally the only crypto traditional markets can valuate with a 3 P/E, its valuated at 1/10th of traditional stock brokers. It should also be noted not only do they own the majority of the lucrative and ever growing crypto exchange market, they now have a BAAS chain to compete with Ethereum, they have also started making a lot of really smart acquisitions, making them closer to a “google of crypto”. I think that this is one of the provably most undervalued crtypto’s in existence today.
This is not investment advice, merely observations from my point of view, DYOR.
Also please consider looking at depth metrics at vcdepth.io, we have partnered with TV to bring TV charts to the site. Here is a snapshot showing how we often see a prelude to a price drop when there is a spike in bids that is not directly related to a price run.

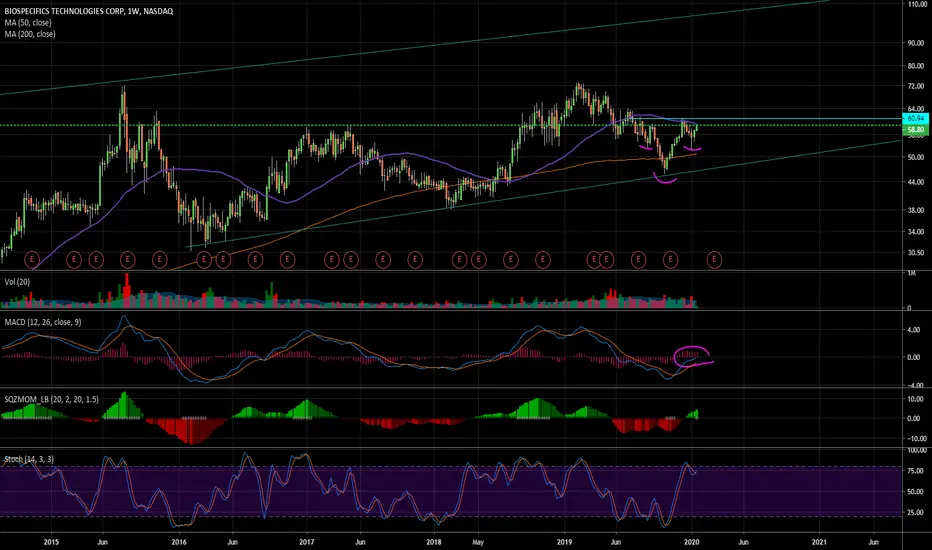
Undervalued Growth5 Yr EPS Growth 313%, Intrinsic Value
@ 0 growth= $39, @10%: $130. W/ PE of 13.5, makes this stock super cheap!
Inverse Head and Shoulders formed on daily over 5 month period. Nearing golden cross on 50 and 200 DMA on daily as well.
Undervalued Growth5 yr EPS growth 313%, Intrinsic Value @ 0 growth=39, @10=130.
W/ PE @13.5 makes this stock super cheap!

Undervalued GrowthLast 5 yr EPS growth =183%, Intrinsic Value @ 0 growth = 50, @ 5%=109. Pretty good for PE of 13.

Undervalued GrowthBuying opportunity! PE of 5.7 for 140% EPS growth annualized last 4 years. Intrinsic Value @ 0% growth= 44, DCF fair value = 44; 53% margin of safety. WOW!
SP currently sitting looking for support at bottom demand line.

Possible turn around for Columbus - Long PositionDanish Midcap IT firm Columbus normally avoids public radar, which might allow some upside here.
Considering the past 6 months' development, I don't believe the major price fall is completely justified and I believe a turn around is possible.
The recent development in the stock price shows strong support in 8.70 DKK, whereby this might be a long term bottom and hereafter support for positive development. During December increasing volumes have shown, while weekly RSI is still low despite increases.
When comparing P/S Ratio and P/E ratio to local (larger) danish peers (Columbus=green), Columbus is strongly underpriced considering their Q3 YTD.
I will go long when the price is 9.50-9.60
Stoploss 9.25
Target A 10.54 (1st possible strong resistance level )
Target B 11.60 (2nd possible strong resistance level )

UndervalueChart presenting beautiful setup opportunity. Intrinsic Value @ 0% growth over next 5 years values company @ $23/sh. DCF FV = 19 or 25.9% Margin of Safety.
Undervalued, grower with low PE.

UBER Technologies -undervalued Technical analysis
DI+ > DI- cross was made on December 16 . Since then, we have stayed above the 50sma.
Since the IPO lock-up (November 6th), OBV has trended upwards on higher highs; RSI is following as well.
Fundamental analysis by MorningStar Analysts
On Dec. 24 Uber announced: Travis Kalanick, Uber's co-founder, will no longer be on the board of the company at the start of 2020.
Kalanick has sold nearly 95% of his holdings in Uber since the firm’s IPO lockup expired on Nov. 6. In comparison, Uber’s other co-founder, Garrett Camp, has sold only around 12% of his Uber stock.
Kalanick being pushed out could benefit the stock in two ways :
1. Without the presence of Kalanick on the firm’s board, Uber’s reputation could improve a bit more quickly as Kalanick’s missteps, which included ignoring the company’s culture of sexual misconduct and not addressing accusations of internal racial discrimination, tainted the firm’s name and may have helped Lyft gain market share.
2. Kalanick’s continued sale of his holdings likely pressured the stock since Nov. 6. From then through today, we estimate that Kalanick’s trades on average represented around 7% of the stock’s average daily trading volume. Without such pressure, the stock could trade higher toward the firm’s $45 IPO price and possibly our $58 fair value estimate. Of course, the stock’s performance will be based mainly on the firm’s progress toward GAAP profitability, which we have projected will be in 2024.

BreakoutOn Gap-up this morning. Lots of bullish activity on multiple time frames for this chart. MACD crossing waterline on daily, signal cross on weekly, SP crossing 50 DMA on daily. PT
Also, undervalued by 25% and 3* on M*.

On WatchPattern neutral until decisive breakout
≈21 undervalued and a 3 star on M* Great ROA compared to industry.

Downtrend breakout1 Yr downtrend breakout; chart presents great setup for a good run if the SP can get over 50 DMA on daily.
Decent ROA compared to industry, has 3* on M*, ≈26% undervalued and has an 11.38% divi yield.

Inverse Head and Shoulders breakoutBreakout in progress!! After a significant SP drop MACD is trending up and breaking out of downtrend, as you can see the 50 DMA and that gap make for nice targets; enjoy.
Also, TUP currently way undervalued w/ a PE of 2.63 and good ROA in industry.

Overlooked silver explorer-developer with no debtGolden Minerlas Company ($AUMN)
This is a Delaware corporation based in Golden, Colorado. The Company is primarily focused on advancing its El Quevar silver property in Argentina, as well as acquiring and advancing mining properties in Mexico, Nevada and Argentina.
The following is not investment advice, but simply captures my personal observations:
The market seems to have completely forgotten the stock; The most recent seeking alpha articles date back from 2014, for example. Current valuation reflects this, with a face-ripping 99% drawdown from its peak.
Management, however, has invested in expanding the resource base during the depth of the PM bear market, and now just entered in a new JV agreement with the potential to broaden their resource base even further (see: www.marketwatch.com)
That news seems to have sparked a break-out.
Now we see this breakout being backtested. I don't see increased volume, and I suspect silver bugs are mostly overlooking this stock still. Its marketcap is tiny at only 30M, so it won't take much to start making waves and get noticed....

BTSUSD ready for 13000% BTS has retrace 98% from its ATH. It is one of the fastest blockchains out there. Created by Dan Larimer of EOS + Steem + Block One +Voice, token weighted governance, decentralization, instant, a bank, projects created on it like BEOS (EOS+BTS middle chain, jurisdictional agility, satellites in space, created by Stan Larimer, RUON). Bitshares pump could be epic.

Undervalued ALNAEvery day I pick a few stocks - the most undervalued stocks in AMEX, NYSE & NASDAQ with lowest RSI and other technical analysis (200-day moving average action and volume change), to trade for the next day. Charts for ALNA is looking great for a 1-day long play (for tomorrow)
More Details:
youtu.be

Undervalued GEREvery day I pick a few stocks - the most undervalued stocks in AMEX, NYSE & NASDAQ with lowest RSI and other technical analysis (200-day moving average action and volume change), to trade for the next day. Charts for GER is looking great for a 1-day long play (for tomorrow)
More Details:
youtu.be

Undervalued VLYEvery day I pick a few stocks - the most undervalued stocks in AMEX, NYSE & NASDAQ with lowest RSI and other technical analysis (200-day moving average action and volume change), to trade for the next day. Charts for VLY is looking great for a 1-day long play (for tomorrow)
More Details:
youtu.be

Undervalued ESTC Every day I pick a few stocks - the most undervalued stocks in AMEX, NYSE & NASDAQ with lowest RSI and other technical analysis (200-day moving average action and volume change), to trade for the next day. Charts for ESTC is looking great for a 1-day long play (for tomorrow)
More Details:
youtu.be

Undervalued MGI Every day I pick a few stocks - the most undervalued stocks in AMEX, NYSE & NASDAQ with lowest RSI and other technical analysis (200-day moving average action and volume change), to trade for the next day. Charts for MGI is looking great for a 1-day long play (for tomorrow)
More Details:
youtu.be
