(1D) eRSDL preparing something?So today for eRSDL I've got good news it looks fired up for massive rally to retake the .10 level expect a lot of volatility on this low cap gem because it has relatively low volume most of the time and low volume : high volatility always comes as a pair.
For the charting aspect of unfederal reserve has risen above the Fibonacci base line which indicates a possible trend change. the Ichimoku cloud indicating the volatility is shrinking it is usually a pattern I observed happening frequently preceding massive upward moves when the cross happens which might be in a couple of days if it continues to behave. On top of that there is the fact that the daily chart looks like it wants to form a classic C&H pattern which we all like seeing because of its bullish premonitions.
Do what you want but since this is a low cap I would not put more than 5% of my Portfolio in this one because as I said earlier Low volume = High volatility.
As always DYOR it's the most important thing you need to do to be successful especially in crypto and even more in these low caps. This is NOT financial advice but a forecast based on my interpretation of the chart.
Be safe out there fam :D
Unfederalreserve

ERSLD USDT LONGERSDL seems to find the bottom. RSI looks good.
First target .14
pull back old support 0.11-010
second target .25

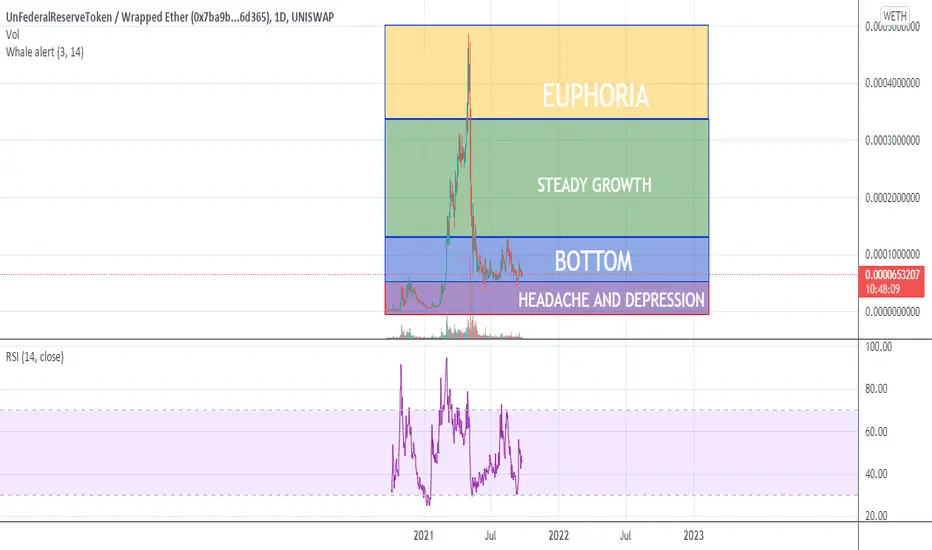
ERSDL is at the bottomThe ERSLD price has shown some interesting things. It helped me to analyze market phases. I have divided the market into four parts:
1. HEADACHE AND DEPRESSION - Purple rectangle represents the phase. I highly doubt that this phase will come. There are two reasons why I think so.
1.1 The purple rectangle was rejected two times by the price.
1. 2 unFederalReserve reserve is growing and developing.
But the price could still go into the purple rectangle. The reasons are:
1. 3 The Whole crypto market could go down and it will lead to ERSLD price decrease.
1. 4 If the Defi company will be hacked.
2. BOTTOM - Blue rectangle represents the phase. The price is now there. ERSLD will quickly move up from the figure if the company keeping the promise.
3. STEADY GROWTH - Green rectangle represents the phase.
4. EUPHORIA - Yellow rectangle represents the phase. The price Will go into there if the company keeping the promise. Nobody knows how big the yellow rectangle will be because the price discovery will begin.