UNI done correcting or ready for another leg down?UNI dumped 39% after the bearish Supertrend Ninja - Clean signal on the 3th April (red vertical line on the background). The Supertrend Ninja - Clean gave 2 bullish signals in 2020 (with the biggest 1065%). In 2021 it gave 2 bullish signals, with 1 bullrun (33%). In 2022 it gave 1 bullish signal, with no follow up.
Whereas UNI corrected at least 22% - 66% after each bearish Supertrend Ninja signal (based on the last 4 signals).
Let's have a look at the other indicators. The Stoch RSI is in oversold levels, pointing downwards. K is below D, which is a bearish sign.
UNI is still in the Bearish Zone of the Ichimoku Cloud , which is bearish .
The RSI is almost in oversold area at 34 (40-60).
If we take a look at the Average Directional Index ( ADX DI) its bearish . The +DI (Green Line) is below the -DI (Red Line). While the Trend Strength is becoming stronger. Since the ADX (Orange Line) is above its 9 Period EMA (Black Line).
Currently UNI is also below its Bollinger Bands Middle, Band Basis 20 Period SMA and the Least Squares Moving Average ( LSMA ). Which are bearish signs. Going down here, the next support is at 5.85 USDT. Supports and Resistances are highlighted as grey blocks.
Conclusion: UNI moving sideways or going downwards. I'll wait patiently on a bullish Supertrend Ninja signal, before entering a long.
Thank you for reading.
Namasté 🙏
Disclaimer: Ideas are for entertainment purposes only. Not financial advice. Your own due diligence is highly advised before entering trades. Past performance is no guarantee of future returns.
What Indicators Do I Use:
In the chart I am using the "Supertrend Ninja - Clean", which is a trend-following indicator (Green and red vertical lines on the background). When the background of the candlestick closes green (vertical line). It indicates a possible bullish (up)trend. And red for downtrends.
UNI

Uni sawp /usdtHello
UNI swap chart in 3-hour timeframe
...
Pay attention to the support range
In addition, there is a possibility of breaking the downtrend in rsi and price
what is your opinion ?


to the targethere we are again
the market now gives a chance to make some profits
please make sure you do SL
Happy flying

UNI resistance breakoutprobably buying if this 4h candle (which is also the last 1D) closes above the 4h resistance rectangle I drew
TP1: 10.8
TP2: 11.2
SL: 8.85
leave a like if this was helpful!
let me know what you think in the comments ↓

Uniswap Price Analysis — April 15Following its 25% slump to the $9.00 low on Monday, UNI has formed a mild but steady bullish pattern, as the broader market struggles to keep bears at bay.
UNI currently trades within a tight upward channel and currently tests the base of this channel, with a possible bullish reversal in view in the near term. The next rally should take Uniswap to $10.00 again, possibly over the weekend, before posting a mild correction to $9.65, followed by a bullish breakout above the $10.00 level.
However, bulls need to stall bears over the next few hours to secure the channel.
Meanwhile, my resistance levels are $10.00, $11.00, and $12.00, and my support levels are $9.00, $8.00, and $7.00.
Total Market Capitalization: $1.86 trillion
Uniswap Market Capitalization: $6.5 billion
Uniswap Dominance: 0.35%
Market Rank: #23

Uniswap shortUniswap bounced off the resistance level. Asset bounced down off the bearish trendline. Decline to support level at 8.9 is expected to happen.

$UNI UPUNI might just take a BULLISH TURN. Although, reconfirmation may be required but i see Bull movement for the week.
It just my thoughts

UNIUSDTHello Crypto Lovers,
Mars Signals team wishes you high profits.
UNI/USDT, Daily time frame
After breaking above the white line, the price is nearing the next obstacle on ist way(R1). As S1 acted an area of support a few times, we consider a similiar reaction one more time. However, in case of losing this support line, we consider a deeper decline, which we see as the less probable scenario though.
Warning: This is just a suggestion and we do not guarantee profits. We advise you analyze the chart before opening any position.
Wish you luck

UNI (Uniswap) Token Analysis 02/04/2022Fundamental Analysis:
Uniswap is a popular decentralized trading protocol, known for its role in facilitating automated trading of decentralized finance (DeFi) tokens.
An example of an automated market maker (AMM), Uniswap launched in November 2018, but has gained considerable popularity this year thanks to the DeFi phenomenon and associated surge in token trading.
Uniswap aims to keep token trading automated and completely open to anyone who holds tokens, while improving the efficiency of trading versus that on traditional exchanges.
Uniswap creates more efficiency by solving liquidity issues with automated solutions, avoiding the problems which plagued the first decentralized exchanges.
In September 2020, Uniswap went a step further by creating and awarding its own governance token, UNI, to past users of the protocol. This added both profitability potential and the ability for users to shape its future — an attractive aspect of decentralized entities.
Uniswap DAO
The Uniswap DAO has over 310,000 members that can vote over the $1.6B treasury, governance and roadmap of the DEX by holding UNI governance tokens. Any UNI holders can submit a proposal, however it must garner up to 25,000 yes-votes before it can be eligible for further deliberation. The next phase is the consensus check, where the proposer has to highlight the core changes and garner at least 50,000 yes-votes. Finally, the governance phase has to attract 40M yes-votes for the proposal to be adopted. Uniswap was the most dominant DEX in 2021 in terms of trading volume, and the top ranked DAO in terms of the amount held in the treasury. However, it is currently ranked second, behind BitDAO — a DAO focused on funding and investing in emerging crypto projects. Check out our deep dive on Uniswap DAO and other top DAOs and how their governance systems work.
Uniswap exists to create liquidity — and therefore trading and the value that trading provides — for the DeFi sphere.
One of the major AMMs in operation at present, the protocol functions using a formula for automated exchange — X x Y = K. Founder Hayden Adams describes himself as the inventor of the particular implementation of the formula on Uniswap.
Uniswap is not just a decentralized exchange; it attempts to solve the issues that platforms such as EtherDelta experienced with liquidity.
By automating the process of market making, the protocol inceventizes activity by limiting risk and reducing costs for all parties. The mechanism also removes identity requirements for users, and technically anyone can create a liquidity pool for any pair of tokens.
According to Uniswap, their governance token (UNI) was created in order to “officially enshrin Uniswap as publicly-owned and self-sustainable infrastructure while continuing to carefully protect its indestructible and autonomous qualities.”
Uniswap V2 launched on Nov. 2, 2018, and introduced new features like ERC-20 pairs, price oracles, flash swaps and more. The latest version — Uniswap V3, launched on the mainnet on May 5, 2021. It features greater capital efficiency for liquidity providers, better execution for traders and enhanced infrastructure. Uniswap price reached an all-time high (ATH) of $44.97 leading up to the mainnet launch of V3. Since it’s launch there has been substantial interest in it’s UNI to AUD and UNI to EUR price pairs.
Uniswap is a decentralized protocol for trading, and UNI is its in-house governance token. UNI is an ERC-20 token, meaning it requires Ethereum to function.
ERC-20 merely defines a set of rules for tokens, as well as security considerations mainly related to the strength of the Ethereum network. For example, congestion can hike the price of gas needed to perform transactions, leading to delays and abnormally high transaction fees, which impact all participants.
Separately, smart contracts can cause security issues that could lead to DeFi traders losing funds; in fact, hackers have already succeeded in stealing millions of dollars in DeFi’s short lifetime as of September 2021.
Uniswap’s UNI governance token is available for trading on major exchanges against other cryptocurrencies, stablecoins, fiat currencies and more.
These include Binance, Huobi and Coinbase Pro, along with, naturally, Uniswap’s protocol itself — Uniswap (V2) and Uniswap (V3).
Uniswap came about as a plan to introduce AMMs on Ethereum to a wider audience. The platform’s creator is Ethereum developer Hayden Adams.
Adams worked in various projects while finalizing Uniswap, and his work was informed directly by Ethereum creator Vitalik Buterin. Buterin even ended up giving the protocol its name — it was originally known as Unipeg.
Adams has also said that the original inspiration for the Uniswap platform came from one of Buterin’s own blog posts. His original idea to focus on Ethereum came after a friend convinced him to begin researching and understanding the protocol in 2017.
The total supply of Uniswap’s governance token, UNI, is 1 billion units. These will become available over the course of four years, after which Uniswap will introduce a “perpetual inflation rate” of 2% to maintain network participation.
Token distribution currently consists of the following: 60% to Uniswap community members, i.e. users, 21.51% to team members, 17.8% to investors and 0.69% to advisors. The latter three distributions will occur according to a four-year vesting schedule.
Out of the majority set to go to users, 15% can be claimed by those who used Uniswap prior to Sep. 1, 2020. These even include users who submitted transactions which were never successful — they are eligible for 400 UNI.
The UNI token serves the purpose of enabling shared community ownership in the growth and development of the decentralized protocol. This allows UNI holders to participate in the governance of the Uniswap protocol and wider ecosystem, in a neutral and trustless manner. The success and adoption of Uniswap products will positively impact Uniswap price, hence incentivizing token holders to contribute to the self-sustaining development of the ecosystem.
Four years after the UNI token launch, in September 2024, a perpetual inflation rate of 2% annually will take effect. This is to ensure that participation in the Uniswap ecosystem continues, by disincentivizing passive holders.
The current CoinMarketCap ranking is #24, with a live market cap of $8,210,903,997 USD. It has a circulating supply of 689,033,313 UNI coins and a max. supply of 1,000,000,000 UNI coins.
UNI Market Capitalization Analysis:
Technical Analysis:
There exist Bullish Divergence of Price Value and MACD, which the sign of bearish trend reversal and start of the new Bullish trend which may lead to the new Economical Cycle.
There are Total of 3 Targets defined by the Average Confluences of the Fibonacci Expansion and Fibonacci Trend Base Extension. these confluences Points can even be counted as the Major Pivot Points .
The 3 TP gets its confirmation as the Bullish trend Triggers the 2 TP followed by some Price correction and Reaccumulation. on its Up Formation rally.
Currently the Price Value is at 78.6% Fibonacci retracement level; it means it has broken the 78.6% Fibonacci Retracement as the Resistance level and had rechecked it backed and it has been Proved to be the support area.
The Fibonacci Tools have been Drawn From 0$ to the ATH, so the Specified Levels are well Defined and Proved.
The Asset is at the Accumulation Level Currently, which means soon the smart many will Flow in it and the Price Value will get Pump and Appreciates
Probably we may not again see this 78.6% Fibonacci Retracement Level or bellow in the current cycle.

UNI (Uniswap) Token {Market Cap} Analysis 02/04/2022Fundamental Analysis:
The total supply of Uniswap’s governance token, UNI, is 1 billion units. These will become available over the course of four years, after which Uniswap will introduce a “perpetual inflation rate” of 2% to maintain network participation.
Token distribution currently consists of the following: 60% to Uniswap community members, i.e. users, 21.51% to team members, 17.8% to investors and 0.69% to advisors. The latter three distributions will occur according to a four-year vesting schedule.
Out of the majority set to go to users, 15% can be claimed by those who used Uniswap prior to Sep. 1, 2020. These even include users who submitted transactions which were never successful — they are eligible for 400 UNI.
The UNI token serves the purpose of enabling shared community ownership in the growth and development of the decentralized protocol. This allows UNI holders to participate in the governance of the Uniswap protocol and wider ecosystem, in a neutral and trustless manner. The success and adoption of Uniswap products will positively impact Uniswap price, hence incentivizing token holders to contribute to the self-sustaining development of the ecosystem.
Four years after the UNI token launch, in September 2024, a perpetual inflation rate of 2% annually will take effect. This is to ensure that participation in the Uniswap ecosystem continues, by disincentivizing passive holders.
The current CoinMarketCap ranking is #24, with a live market cap of $8,210,903,997 USD. It has a circulating supply of 689,033,313 UNI coins and a max. supply of 1,000,000,000 UNI coins.
technical Analysis:
The market Cap is currently at the Accumulation Phase which is the phase of Smart Money Inflow and lets the Institutional and High Net Worth investors to Step in which leads the Cycle and Push the Price Value of the said Asset to higher levels.
There exist Bullish Divergence of Total Value and MACD which the sign of bearish trend reversal and start of the new Bullish trend which may lead to the new economical cycle.
There are Total of 3 Targets defined by the Average Confluences of the Fibonacci Expansion and Fibonacci Trend Base Extension. these confluences Points can even be counted as the Major Pivot Points .
The 3 TP gets its confirmation as the Bullish trend Triggers the 2 TP followed by some value correction and Reaccumulations, on its Up Formation rally.
Currently the Total Value is at 78.6% Fibonacci retracement level, it means, it has to break many resistance levels and shall rechecked them backed and it has to Prove them to be the Accountable Support Areas.
Probably we may not again see this 78.6% Fibonacci retracement zone or bellow...
66B $ is a fare target for this assets Market Capitalization.

UNI trading setup idea! 💡UNI trading setup idea! 💡
Enter the trade by checking yourself. 💥
Do not put more than 2% of your capital at risk! ❌
This is for spot traders and holders. 👀
Low risk. 🟢

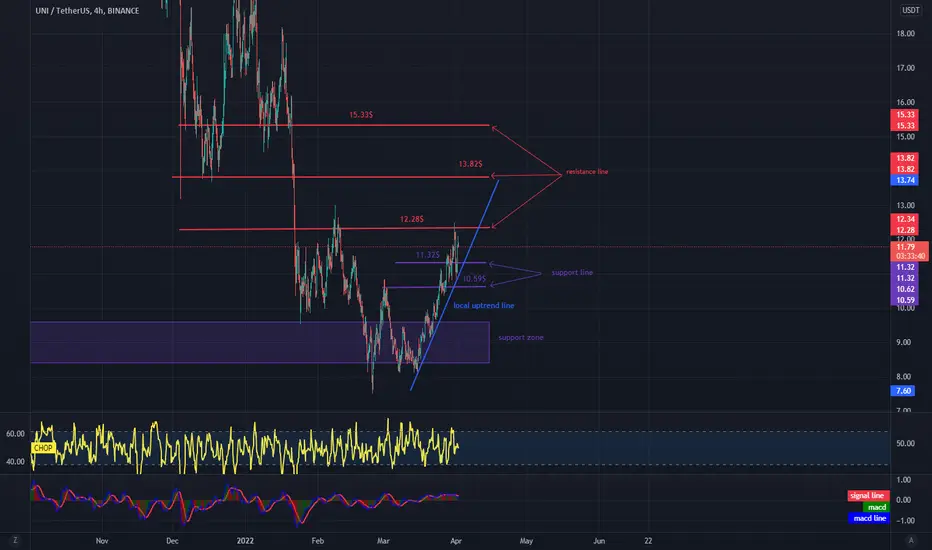
UNI is climbing the local uptrend lineHello everyone, let's take a look at the UNI to USDT chart over the 4 hour timeframe. As you can see, price is moving above the local uptrend line.
Let's start with the designation of the support line and as you can see the first support in the near future is $ 11.32, if the support breaks down, another one is $ 10.59, then we have a support zone from $ 9.60 to $ 8.38.
Now let's move from the resistance line, as you can see the first resistance is $ 12.28, if you can break it the next resistance will be $ 13.82 and $ 12.28.
Looking at the CHOP indicator, we can see that in a 4-hour period, despite the last move, we still have some energy in the near future.
Uniswap UNI - will people take profit again?Uniswap - will people take profit again?
Last time at current price level 79.29k addresses (27.73%) have been in profit as sell-off occurred.
Today 89.13k addresses (30.65%) are in profit.
Furthermore people might sell since their positions are at break even after days of loss.
What do you think - can UNI change the picture?
Drop me a nice comment if you'd like me to analyze any other cryptocurrency.
*no financial advice
do your own research before investing

Uniswap vs Bitcoin Looks Better (125% to 300% Potential)The UNIBTC chart looks better than the UNIUSDT chart, as a chart setup for trading.
That is because this one is trading closer near support.
We like the pairs near support because if things go south, we have less risk and it is also possible to have higher potential on the way up.
UNIBTC (Uniswap) has been challenging EMA50 for the past ~7 days.
We are seeing a break above this level today.
The MACD and RSI are looking ready and strong.
We have very low risk here...
With high potential reward.
Namaste.

Uniswap Prints Same Bottom Pattern as Waves (250% Potential)I don't know if you remember my WAVESUSDT chart but in it we spotted a "W" bottom pattern just like this one...
WAVESUSDT then went to break its All-Time High and continues growing everyday... (Still growing today!)
Chart:
Now we are looking at Uniswap (UNIUSDT) and its price has already conquered EMA50, EMA21 and EMA10.
What can follow is really strong bullish action, just as we saw with Waves.
Additional details on the chart.
Namaste.

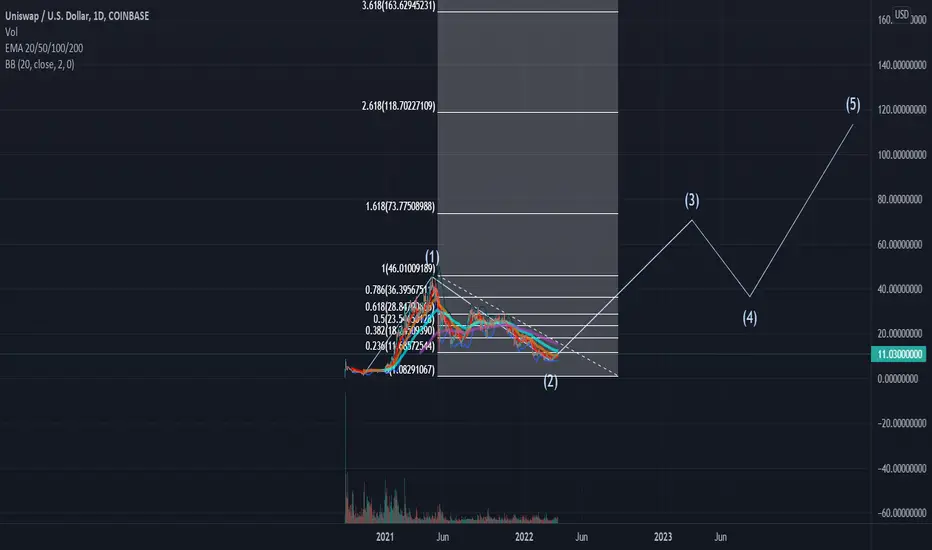
UNI/USDTesting/tracking elliot wave theory. Please do not trade off idea without S/L. Not financial advice.
Link to previous chart:
If you press play on the previous chart; you'll see that we went a bit further down from what I thought was the bottom. This is exactly why I say no one can time the top and bottom perfectly. $12 was what I thought to be the bottom as we touched the 0.238 fib however we got another leg down. If this is one of your favorite coin, then the play would be to dollar cost average in. If you were willing to buy at $12 and it went lower to $7.5 then you should add more because this is a 40% discount. I do not recommend doing this to all of the coins you like, but only to your favorite ones; unless you have infinite money. This is not financial advice.
LONG ANC - Anchor ProtocolAnchor Protocol, the popular savings app on Terra_money, is now the 3nd-largest dApp in DeFi.
With $14.5B in TVL, it represents over half of all assets locked on Terra.
Anchor has now surpassed almost all of Ethereum’s ‘blue-chip’ DeFi assets, including the lending protocol Aave, Uniswap, and Compound. As for Terra, it now has a TVL of $27B, making it the No. 3 smart contract network.

$UNI Probably following the rest of the Alts $UNI #Uniswap
Probably following the rest of the Alts
2D UCTS Buy closing today (usually strong) while Volume remains shy but slowly rising..
normies will buy your bags, let it fly
#UNI
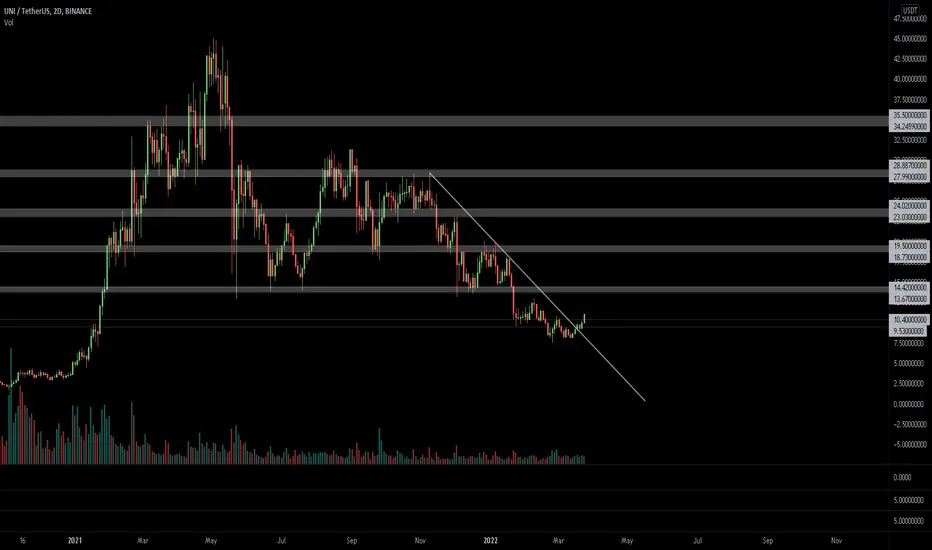
Uniswap longUniswap broke trough the descending trendline. Asset broke trough the resistance level. Bullish movement to support level at 11.5 is expected to happen. If the next resistance level will be broken up the Uniswap is supposed to reach 12.5.

UNIUSDT - SETUPUNIUSDT price is moving positively by the bulls and retaining. Now we are expecting an HL formation and then the price will continue its momentum up to the next resistance zone. So buying on dips will be a good strategy.

Is UNI preparing for a breakout?Hi!
As you see in the chart, UNI is touching its downtrend line. Obv is kinda breaking out of its downtrend line with a nice volume. For now ema100 Daily acts as resistance (uni ema100D =10$).
If btc goes well too, we can see a pump in UNI
Thanks
Dyor and stay chilled AF!

