UNI/USDT (Uniswap, DeFi) Main trend. Pivot zones. UnlocksLogarithm. The main trend (all trading history). Time frame 1 week. The main trend to understand the main trend and cycles.
Long-term position work in the spot (you don't need to hold your coins on the exchange, so you reduce the risk). If you are not working locally, there is no point in holding coins on exchanges, which can appropriate your funds in case of "force majeure" circumstances under the general market situation. If you work long term, then you will sell some part of it after a few months (the probability is no more). Then buy back most of the profits and some of it already in the main distribution cycle, that is, in a few years (1.8-2.2 years, the peak of the market).
It is worth noting that in 2023 there is quite a lot of unlocking of coins on this cryptocurrency.
Shows the percentage of price growth from the main reversal zones from the key support/resistance levels in the case of retention or on the contrary breakout. The work with martingale in case of a negative scenario (averaging, predetermined amount of money).
This is what it looks like on a line chart (without market noise).
This non-logarithmic chart was published about a year ago at the beginning of the accumulation (sideways) channel formation.
UNI/USDT Main Trend. Time frame 3 days.
News background now: Uniswap Labs announced the launch of Uniswap v4
UNI

#UNI --- Uniswap to soar back into the 20'sAs a brand
how do u compete with a leader
Uniswap being the leader of on-chain exchange
Coke is the brand to invest in
(what stock did Buffet buy?)
not Pepsi
not RC cola
Do you get where I'm coming from
And I am not getting into to who, what or how
they have been infiltrated
but clearly they have
As an investor
you MUST pick the best of breed
That has historically been the best route to success.
UNI to rip is my prediction

UNI/USDT Crucial area. Could Break this area or rejected ??💎 UNI has recently demonstrated notable market dynamics, currently encountering resistance in the supply and Bearish Order Block (OB) area.
💎 A breakout above this zone is necessary for sustained upward movement, probability leading to significant price appreciation and the attainment of our target area.
💎 However, if UNI fails to break out above the supply area, it may face rejection and retreat to the support zone around 5.61 to gather new bullish momentum.
💎 Upon reaching the support area, UNI needs to bounce back upwards to resume its upward trajectory and attempt to breach the supply zone once again.
💎 Should UNI break below the support level, it would signal a shift in market sentiment towards bearishness, potentially leading to further downward movement towards the demand area or even lower.

Uniswap's L2 Transaction Volume Hits $200B ATH, UNI Price ReactsUniswap's Layer-2 (L2) ecosystem has achieved a monumental milestone, with its transaction volume surging to an all-time high of $200 billion in February 2024. This remarkable feat underscores Uniswap's pivotal role in revolutionizing decentralized exchanges and automated market makers.
Uniswap's L2 Transaction Volume Hits Historical High:
Data from crypto analytics platform Dune has confirmed the unprecedented success of Uniswap's L2 ecosystem, encompassing platforms such as Arbitrum, Polygon, Optimism, and Base. The cumulative transaction volume has skyrocketed to an astounding $208.11 billion, marking a staggering 280% increase compared to the previous year.
The surge in transaction volume has elicited a positive response from the crypto community, particularly towards Uniswap's native token, $UNI. The announcement of a proposal by the Uniswap Foundation aimed at upgrading protocol governance, coupled with the redistribution of protocol fees to CRYPTOCAP:UNI token holders, has catalyzed a 15% increase in the value of $UNI. However, despite a temporary slowdown, UNI continues to demonstrate resilience, trading at $12.22 with a 5% increase within the past 24 hours.
UNI's Multiple Milestones:
The exponential growth in Uniswap's transaction volume signifies the robust performance of its decentralized exchange ecosystem. Anticipation mounts for the launch of Uniswap V4, the exchange's forthcoming non-custodial, non-upgradeable, and permissionless automated market maker protocol, slated for release by Q3 of this year.
Furthermore, the unveiling of Uniswap V4 has fueled additional excitement within the crypto community, propelling CRYPTOCAP:UNI 's price to new heights. The recent surge in CRYPTOCAP:UNI 's value, including an outstanding gain of 70% on February 23, can be attributed to the decentralized exchange's strategic changes in fee mechanisms, benefitting UNI token stakers.
CRYPTOCAP:UNI 's meteoric rise not only signifies a paradigm shift in the DeFi sector but also underscores Uniswap's pivotal role in shaping the future of decentralized finance. As attention shifts from traditional financial paradigms to DeFi innovations, UNI emerges as a beacon of transformative potential, leading the charge towards a more inclusive and decentralized financial ecosystem.
In conclusion, Uniswap's soaring success, marked by its monumental transaction volume and UNI's price reactions, reaffirms its status as a trailblazer in the ever-evolving landscape of decentralized finance. As Uniswap continues to push the boundaries of innovation and adoption, the possibilities for decentralized finance are limitless, heralding a new era of financial empowerment and autonomy.

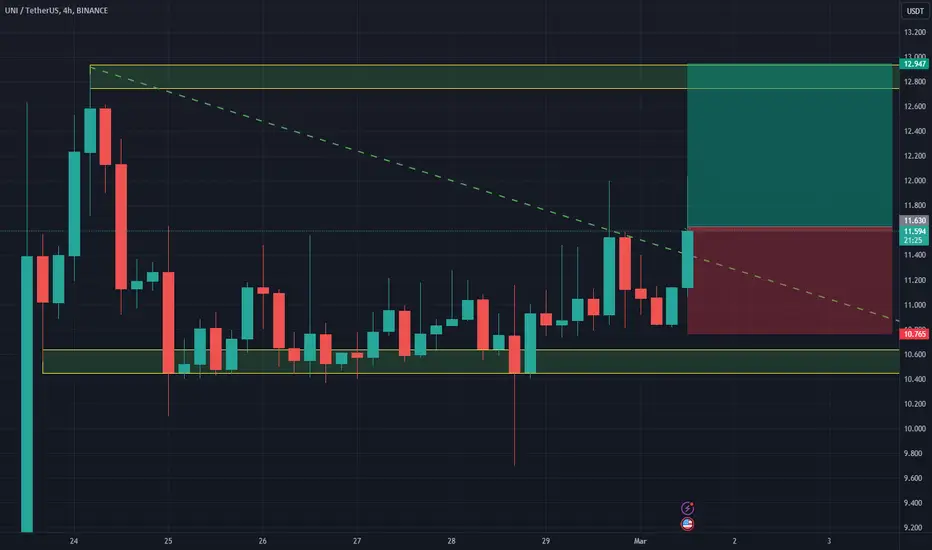
long UNIUNI broke through the descending trendline. The bullish trend is expected to continue and reach the resistance level at $12.94
Market Update - March 1 2024
BTC Surges to 2-Year High: The price of bitcoin (BTC) has soared past $59,000 after weeks of consolidation, setting the stage for a potential challenge of its record high of $69,000, driven by institutional demand, anticipation of the upcoming halving, and other catalysts, with MicroStrategy adding 3,000 BTC to its holdings.
ETH Surges, Outperforms Bitcoin Amid ETF Launch Optimism: The price of Ether (ETH) continues upward, outpacing BTC as it approached 0.06 on the ETHBTC pair but ultimately facied resistance. It remains elevated at around $3,350, amidst anticipation of a potential approval for a spot ETH ETF.
UNI Price Soars on Governance Reform Proposal: Uniswap's (UNI) value surged dramatically after the Uniswap Foundation released a proposal for overhauling its governance system, with UNI token holders potentially receiving rewards, leading to a remarkable price increase of over 50% in a day, hitting $12.86, its highest point in more than two years.
AR Gains +75% On Testnet News: On Tuesday, Arweave (AR) announced the release of the public testnet for Arweave AO. According to the Arweave team, this will be a scalable blockchain network, built upon the foundation of its existing data storage platform, promising substantial scalability enhancements compared to other blockchains. AR has emerged as one of the standout performers in the past seven days, trading up +75%.
🐂 Topic of the Week: What makes a bull market?
👉 Read more here

UNI/USDT Break the key resistance area. Bullish Momentum ???💎 UNI has been a focal point in the cryptocurrency market, having recently achieved a significant breakthrough by surpassing a key resistance area and breaking out of a bullish pennant pattern.
💎 This advancement indicates a potential retesting phase at what was previously resistance, now serving as support. Successful retesting could pave the way for continued upward movement, with the next target being a strong resistance area.
💎 During this retesting phase, it's crucial for UNI to demonstrate a robust bounce off the support area to maintain its upward trajectory. Failure to hold this support level could result in UNI retreating to the demand area, specifically around the $6.1 mark.
💎 The $6.1 demand zone becomes a critical point for UNI. For the asset to resume its upward path, a strong rebound from this level is necessary, aiming to surpass and sustain above the former resistance level.
💎 This action is vital for continuing the upward movement towards the strong resistance. Conversely, if UNI fails to hold this demand level and breaks down, it could signal a shift towards a stronger support area.

UNI/USDT Bullish Surge from Key Demand Zone? 🚀UNISWAP💎 Paradisers, get ready for an exciting trading prospect with #UNIUSDT, as it shows promising signs of a bullish continuation from its demand zone.
💎 Exploring #UNISWAP trajectory, we've observed its ascent from a significant supply level at $7.727. After a brief deceleration, our focus shifts to a potential bullish leap from the demand level of $7.232, where an abundance of liquidity further bolsters the case for a reversal. Remaining steadfast at this point could set the stage for the bullish expedition we're envisioning.
💎 If momentum for #UNI starts to wane, our eyes are on a rejuvenating rebound from the firm demand level at $6.916. However, a descent below this pivotal level could signify the beginning of a more pronounced bearish trend.

UNIUSDT Trade Idea (4RR: +20% Pump??)This is not financial advice and you can risk serious money if you take this trade.
Check out my previous call on UNIUSDT, this trade idea is just an update from that.
- Retracement on Daily TF
- 1H MMBM
- 1H MSS
- 1H FVG
Rally Higher With Respect To HTF Trend.

UNI/USDT breakout after two year consolidation- UNI/USDT Accumulation for 658 days is over
- Strong breakout on increased volume to FIB 0.236 lvl
- Strong fundamentals, a lot of important updates these days
- CRYPTOCAP:UNI target zone is 24.16-29.13

The last squeak of the bearsTo date, the market has worked out clearly according to the main scenario without surprises. The attempt to rebound from 3k to the reversal of the month at the change of the weekly candle was completely absorbed against the background of a weakening dollar and the opening of the second half of the quarter above 2600. We also successfully took 2750, which, as I emphasized, significantly reduced the activity of sellers and gave the signal for the test of 3250. The bears still have a few days left for a new blow for the turn of the month, which should be prepared from 3250 and 3500. With the current market situation, the probability of sales this month has decreased significantly and the probability of opening a new month above 3500 prevails, which will provide strong support to the market in the new month.
The eth/btc pair also continues to grow, according to which I marked the target on the test in the range 0.100-125. In this situation, the ground for viola breakouts continues to improve. I am mainly paying attention to the vip cup deep oki ax asr tm, for which goals up to 100%+ remained unprocessed.

UNIUSDT Long; Second Pump To Pushing Above $13 EASY BIG GAINS!!!Looking for UNIUSDT to push above $13 into a monthly PD Array.

Uniswap (UNI) Rally Faces Uncertainty Amid Team Selloff
Uniswap ( CRYPTOCAP:UNI ), the decentralized exchange (DEX) protocol darling of the DeFi world, has been on a rollercoaster ride lately, with its price soaring by a staggering 76% in recent weeks. However, the excitement surrounding CRYPTOCAP:UNI 's meteoric rise is now met with caution as reports suggest a potential selloff by the Uniswap team, signaling a possible end to the mega rally.
Team Selloff Dampens Sentiment:
Analytics firm Lookonchain (x.com) revealed that a Uniswap team wallet recently offloaded 90,000 CRYPTOCAP:UNI tokens, worth approximately $1.03 million, amidst the token's impressive rally. This move follows a period of significant accumulation, where the wallet amassed millions of CRYPTOCAP:UNI tokens, hinting at a potential shift in strategy or profit-taking.
Ripple Effect on DeFi Ecosystem:
CRYPTOCAP:UNI 's rally has reverberated across the decentralized finance (DeFi) landscape, sparking a broader surge in DeFi protocols like Compound (COMP), SushiSwap (SUSHI), and Aave (AAVE). The heightened trading volumes and price increases observed across these platforms underscore the interconnected nature of the DeFi ecosystem and its sensitivity to UNI's performance.
The Road Ahead:
While CRYPTOCAP:UNI 's rally has fueled optimism within the DeFi community, the recent team selloff introduces an element of uncertainty. Traders and investors are now left speculating about the future trajectory of CRYPTOCAP:UNI and whether a correction is imminent. With the looming specter of profit-taking, the market braces for potential volatility in the near term.

#UNI/USDT#UNI
The price has been moving in a downward channel since August 2022
The price is now on its way to a downward trend
The price now is 5.47 $
First goal 6.63 $
Second goal 7.73 $
Third goal 9.0 $
Which represents 210 % of the current price
With significant oversold and upward momentum
We also find that the MACD indicator is highly oversold
All of this supports the falling channel pattern, whose upper trend we are about to reach
We have a big support area on the chart at the price of 4.5 $

#UNI/USDT #UNI
We have a decline with the market falling. The price is expected to reach the support level of 5.23.
Where there is Moving Average 100 support
Then it bounces up to break the bear flag 8.78
With a target level of 8.87

UNI/USDT: UNI descending triangle, possible breakout ?UNI is currently trading inside the descending triangle and we can expect some movement inside the the triangle.
if the current momentum continues we can expect the upward moment and we will enter a long trade when price breaks upward.
if the price breaks the support then the trade invalid. price could settle in the next support at around 4.8
Entry Price: 6.222
Stoploss: 5.583
TP1: 6.571
TP2: 6.954
TP3: 7.685
TP4: 8.277
Don't forget to keep the stoploss. Like and follow us for more similar trade ideas.
Cheers!
GreenCrypto

UNI - FollowupCRYPTOCAP:UNI
A follow-through on the trendline pointed out before to the range mentioned before.
But most importantly, look at that sexy momentum volume

UNIUSDT Long IdeaUNIUSDT broke out of triangle on 3D.
I'm expecting a pullback and a continuation of the move upwards.

Uniswap (UNI) Surges Over 53% on Staking Rewards ProposalThe Uniswap Foundation has submitted a significant proposal for improving Uniswap’s community governance. This act has quickly influenced the market, thus causing a substantial increase in the value of CRYPTOCAP:UNI tokens. The initiative by the foundation aims to change the fee mechanism to benefit those who stake and delegate their CRYPTOCAP:UNI tokens. As a result, CRYPTOCAP:UNI price has soared and is up by more than 53%.
Proposal to Revitalize Governance
This campaign’s core is the need to freshen the governance architecture in the Uniswap ecosystem. The suggested modifications facilitate a better involved, reasoned, and dynamic role in delegation processes. Through the association of delegation with protocol fees, the Uniswap Foundation seeks for CRYPTOCAP:UNI token holders to choose delegates wisely.
The selection criteria would be performance-based, focusing on delegates’ contribution towards the growth and general success of the protocol. This model is predicted to build a more viable and active governance setting, somewhat altering the delegation pattern and engagement among new delegators.
Uniswap Market Response and Forthcoming Votes
The proposal’s announcement has already created commotion in the cryptocurrency market, and the price of UNI has dramatically skyrocketed. Initially valued at $7.11, the token’s price skyrocketed to $11.09 in less than a short term, which meant an increase of over 53%.
This reflects the market’s favorable response to the proposed governance improvements. The proposal will be put through a snapshot vote on March 1 and then an on-chain vote on March 8. The vote stages are the fundamental phases of realizing the proposed changes.
Enhancements and Innovations
Aside from the governance proposal, Uniswap ( CRYPTOCAP:UNI ) has introduced ‘uni.eth’ subdomains, which exploit the Ethereum Name Service infrastructure. The innovation simplifies the user experience by turning the Ethereum addresses that are hard to comprehend into names that are easy to read, thus making the platform more user-friendly.
This development and the idea to reward staking and delegating still represent Uniswap’s desire to continue to develop its ecosystem to better its users.
Additionally, the hype related to the upgrade of Uniswap v4 is another important factor contributing to the growth of the market performance of UNI. These expectations and the governance amendments will set Uniswap ( CRYPTOCAP:UNI ) for substantial growth and advancement.

DOT Will MOON Like UNI MartyBoots here. I have been trading for 17 years and I am here to share my ideas with you to help the Crypto space.
DOT will have have a nice move in very near future but watch the video to find out when it can moon . Very important information
It has very good structure and price action , it reminds me of how many other coins set up in the last Bull market before it went parabolic and of course similar to UNI that just mooned
Please watch the video for more information
have a great weekend

UNISWAP - UNI Is Going To MOON MartyBoots here. I have been trading for 16 years and I am here to share my ideas with you to help the Crypto space.
UNISWAP is a large player in the crypto market.
UNI looks beautiful and will continue to moon. This pattern is a large base breakout and is very powerful. Its a failed descending triangle.
This chart helps show you ALT Season is about to start.
The ALT Market is in its bottoming phase, be prepared. ALT Season is coming. This is the time when its possible to make life changing money .
Do NOT miss out on this coming bull market
MartyBoots

UNI/USDT - Long and Short PlaysNot really sure about this one, as I'm expecting BTC to do a fat ABC retrace after the Elliott Wave that recently finished playing-out (see last two posts) - If BTC does retrace, ALTs should follow.
Ignoring all timings. I'm only focusing on the Elliott Wave counts and any confluence.
For UNI/USDT, I've got 3 x Elliott Waves to give me short, medium and long terms plays in both long and short directions.
Red EW- Long term (1D).
Blue EW - Medium term (4h).
White EW - Short term (1h).
Short term - White EW
Assuming we've already bounced off the white wave-4, I'm now looking for price to tap wave-5 @ 2.618. However, if wave-4 hasn't hit yet, price could first come down as low as the white wave-1 peak.
Medium term - Blue EW
After the blue wave-3 gets tapped @ 1.618, we should retrace to create wave-4. This could be as low as the blue wave-1 peak.
Once wave-4 is complete, we should head up to wave-5 @ 2.618.
Blue wave-5 also aligns with the Point of Control (POC) on my Volume Profile.
Long term - Red EW
After we retrace from Red wave-1 to wave-2, price should back head up to the red wave-3 range @ 1.618.
I think UNI will top at the red wave-5 range @ 2.618.
Red wave-5 also aligns with the Value Area High (VAH) on my Volume Profile.
I put a fib extension on my Volume Profile:
Red wave-3 taps the Volume Profile's 1.618.
Red wave-5 taps the Volume Profile's 2.618.
Let's see...

