USDT.D Bounce Back After Fakeout – What It Means for Alts?USDT Dominance – 12H Chart Analysis
After a clean downtrend and multiple breakdowns, USDT.D recently attempted to break below a major support zone — but it turned out to be a false breakdown.
This move likely trapped altcoin buyers, who expected USDT.D to keep falling (which usually signals strength in altcoins). Instead, dominance quickly bounced back, showing money flowing back into stablecoins.
If USDT.D continues to rise from here, we could see pressure on altcoins in the short term.
Watch this level closely — the next move will be critical.
Unichartz

Bull Flag Forming on ETH/BTC – Altcoins About to Explode?$ETH/BTC just broke a key resistance line and is now forming a bullish flag — this is big for altcoins.
Why? Because when ETH starts gaining strength against BTC, it often signals the beginning of an altcoin rotation. Ethereum usually leads the pack — and when its BTC pair is bullish, altcoins tend to follow with strong momentum.
The breakout followed by a bull flag consolidation suggests continuation is likely. If ETH/BTC pushes higher from here, we could see capital flow from Bitcoin into altcoins, igniting the next leg of altseason.
Altcoins may be gearing up — stay sharp.

Bitcoin’s Breakout Pattern Continues – Is $120K Next?MARKETSCOM:BITCOIN Quick Update
Bitcoin is showing strong momentum — each time it accumulates, it breaks out to a new level. This "accumulate and explode" pattern has played out cleanly three times already.
Now, BTC is consolidating just under its all-time high. If this range holds, another breakout could be coming soon.
The structure remains bullish as long as price holds above the $103K zone. A clear break above ATH could send it toward $120K and beyond.

BTC Building Strength – Breakout Ahead?$BTC/USDT Weekly Analysis
Bitcoin continues to respect the 50 EMA on the weekly timeframe — a key dynamic support level that has consistently held throughout this bullish structure.
Each time BTC corrected, it found support near the 50 EMA before bouncing back with strength. The current structure mirrors past price action, with price again rebounding from the EMA after a consolidation phase.
We’re also seeing a pattern of lower highs forming a potential descending resistance line. A breakout above this trendline could trigger a fresh rally, possibly taking BTC to new highs.
As long as Bitcoin stays above the 50 EMA, the mid-to-long-term bias remains bullish. A confirmed breakout above the descending resistance could open the door for a strong upside continuation.
DYOR, NFA
Thanks for following along — stay tuned for more updates!

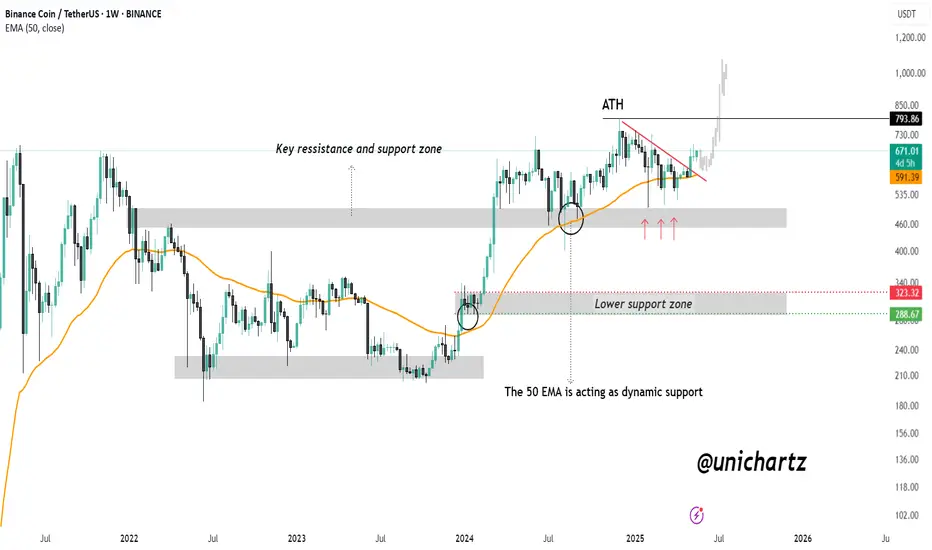
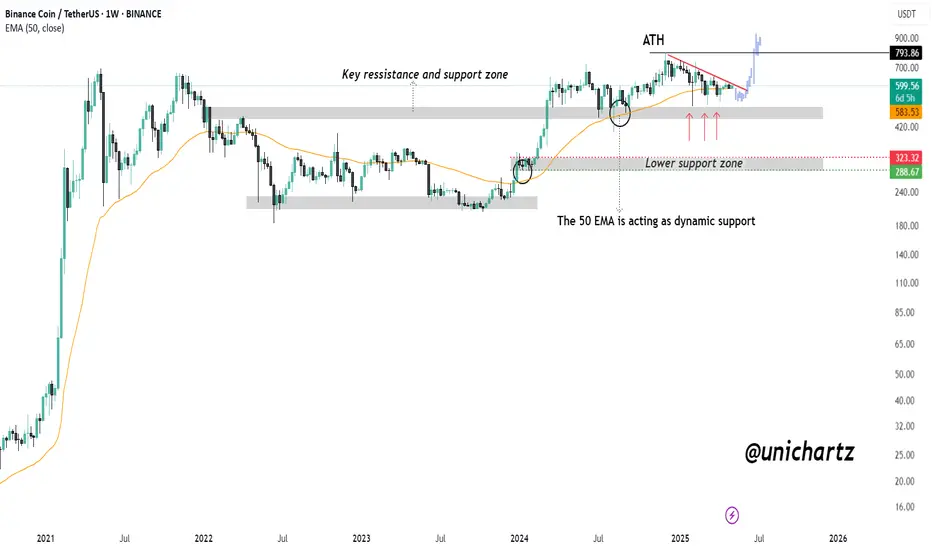
BNB Weekly Breakout: Road to $1,000?CRYPTOCAP:BNB is showing strong bullish momentum on the weekly chart. The 50 EMA is acting as a dynamic support, holding firm during multiple retests and providing a solid foundation for upward movement.
Recently, price action has broken above a key descending resistance line and successfully reclaimed a major support-resistance zone, turning it into a strong base. This area, which previously acted as a battleground for bulls and bears, is now supporting the current rally.
As long as BNB continues to hold above this zone and the 50 EMA, the structure remains bullish. With sustained momentum, a retest of the all-time high zone around $793 is likely, and a breakout above it could open the door for a move toward $1,000 and beyond.
DYOR, NFA
Gold is Heating Up! Breakout + Trendline Support Gold has shown strong bullish continuation after breaking above a key descending resistance line. Once that breakout occurred, price formed a strong rising trendline, which has since been respected as dynamic support.
Additionally, a former resistance zone has now flipped into support, confirming a bullish market structure. Price is currently approaching a major upper resistance zone, where we may see a temporary pause or reaction.
As long as the rising trendline holds, the momentum remains in favor of buyers — and a clean breakout above the upper zone could trigger the next leg higher.

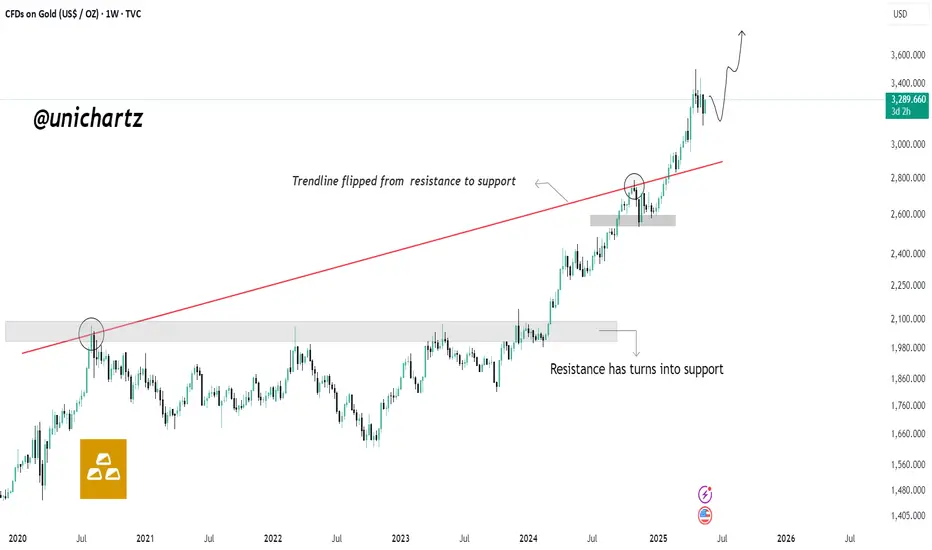
Textbook Trendline Flip: Is Gold Ready for the Next Leg Up?Gold continues its strong uptrend after a textbook breakout and retest of a multi-year trendline. The price previously faced multiple rejections from this rising trendline, but has now flipped it into strong support — a key bullish signal.
What’s more, a horizontal resistance zone has also been reclaimed and is now acting as support, further validating bullish strength. This confluence of former resistance levels turning into support suggests that buyers are firmly in control.
As long as the price holds above this structure, the path of least resistance remains to the upside — with the potential for new all-time highs in the coming weeks.
GBP/USD Breaks Key Resistance Zone – Bullish OutlookGBP/USD has broken above a long-standing resistance zone on the weekly chart, signaling a potential shift in long-term trend. This breakout aligns with a strong rising trendline that has held firm for months, showing growing bullish momentum.
If price continues to hold above the breakout level, the market could be setting up for a sustained upward move. A successful retest of the breakout zone would further confirm bullish continuation. The structure looks healthy, and the momentum is clearly on the buyer’s side.
DYOR, NFA
Thanks for following along — stay tuned for more updates!

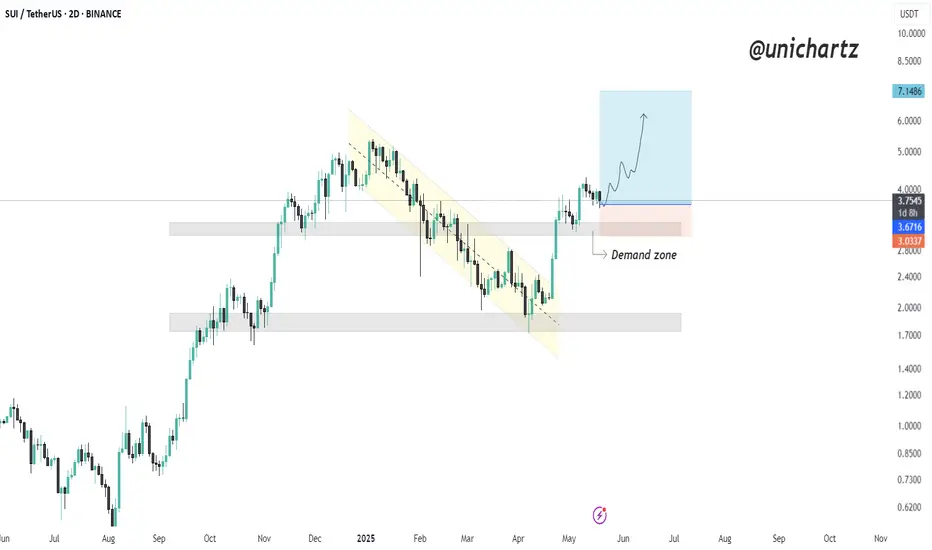
SUI Retesting Demand Zone After Bullish BreakoutSUI has broken out of a downward channel after weeks of selling pressure, signaling a major shift in momentum.
The price found strong support at the demand zone, then made an impulsive move up — confirming bullish intent.
DYOR, NFA
Bitcoin Ready to Explode – Just Like Last TimeCRYPTOCAP:BTC is currently showing a powerful accumulation and breakout pattern, repeating the same bullish structure that led to explosive rallies in the recent past.
The chart highlights three key zones where Bitcoin consolidated before breaking out:
🔹 First breakout from the $81K–$86K zone
🔹 Second breakout above $93K after holding above the 50 EMA
🔹Now, Bitcoin is accumulating again just below a key resistance zone (~$105K–$106K)
This resistance zone has acted as a ceiling before, but the current price action suggests strength. The tight consolidation just below resistance often precedes a breakout — and if it happens here, Bitcoin could explode toward $115K+ in the coming weeks.
Key Technical Points:
🔹50 EMA is acting as dynamic support
🔹Higher low structure remains intact
🔹Each consolidation is followed by a strong upward breakout
Repeating accumulation breakout pattern is visible
Next targets: $111K → $115K → $120K
Invalidation: Breakdown below GETTEX:98K with strong volume
If you found this helpful, don’t forget to like, comment, and repost.
Thank you!
#BTC #BTCUSDT #Unichartz

BTC Dominance – Critical Breakdown ConfirmedBitcoin Dominance has officially broken below the long-standing rising wedge structure, signaling a significant shift in market momentum. This pattern, which had held strong since December 2024, has now failed — and that’s a big deal.
After the breakdown, BTC.D temporarily bounced but was rejected on the retest of the wedge’s lower boundary, confirming the breakdown as valid. This retest-then-drop scenario is a textbook bearish continuation signal.
Not only did BTC.D lose the rising trendline, but it also failed to hold the horizontal support zone near 63%–62%, which acted as a key floor for months. Now, with price heading lower, Bitcoin's dominance is clearly weakening, and that’s bullish for altcoins.
What this means:
Bitcoin is losing control of market share.
Altcoins may start gaining serious traction, especially mid and low caps.
If BTC.D drops below 60%, we could see an acceleration of capital rotation into altcoins — a classic start to an altseason.

$ATOM Breakout Above Key Resistance – Bullish ReversalNASDAQ:ATOM has just broken through a key resistance zone, reclaiming the 100 EMA with confidence and confirming a strong trend reversal.
This move has triggered a powerful breakout, backed by volume and bullish price structure.
DYOR, NFA

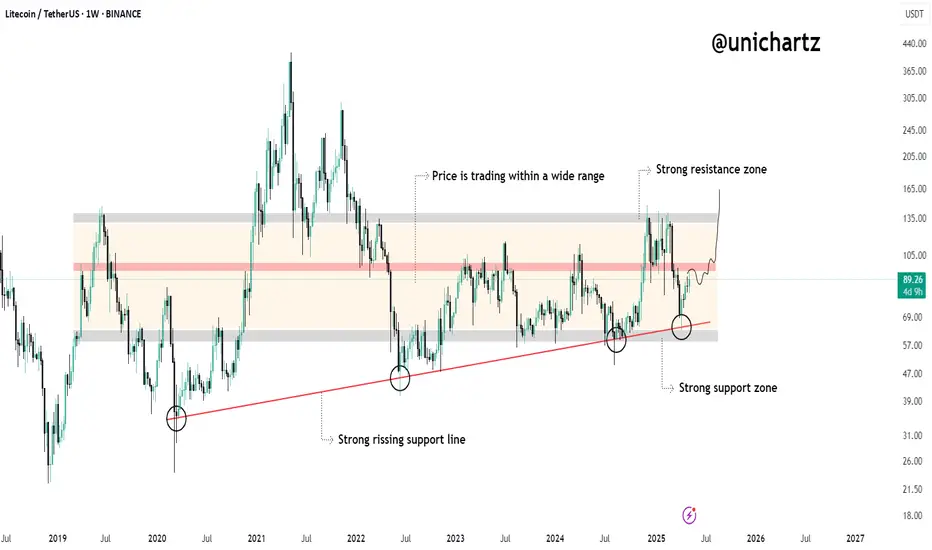
Is $LTC Lining Up for a Breakout Move?LTCUSDT is moving inside a wide range that's been respected for over 3 years — with price bouncing between a strong support zone ($50–$60) and a strong resistance zone ($130–$145).
Key Highlights:
Strong Support Zone:
Price recently bounced off a long-term horizontal support area near $60 — the same zone that sparked multiple rallies in the past.
Rising Trendline:
A clean, rising diagonal support has held since 2020 — each retest has led to upward momentum. The latest bounce confirms this structure is still valid.
Current Structure:
Price is climbing from the base of the range. If it breaks through the mid-zone and holds, we could see an attempt toward the upper resistance around $130+.
DYOR, NFA
BNB Bull Flag Activated — Watching for $794 CRYPTOCAP:BNB is showing strong bullish momentum after rebounding off the marked support zone. This level, which previously acted as resistance, is now holding firmly as support following the breakout.
As long as BNB sustains above this zone, the bullish structure remains intact — and the path toward a new All-Time High (ATH) around $794 is wide open. The 50 EMA continues to act as dynamic support, further strengthening the setup.
DYOR, NFA
CRV Breakout Retest – Eyes on the Next Leg UpLSE:CRV has been trading within a well-defined ascending channel, showing a consistent bullish structure. Recently, the price broke above a key horizontal resistance level and is now retesting it—this is a classic breakout-retest scenario.
As long as CRV holds this support and remains within the channel, the bias stays bullish. A successful bounce from this zone could lead to a strong continuation toward the upper boundary of the channel or higher.
DYOR, NFA

Ethereum Rebounds from Key Confluence Zone$ETH/USDT Weekly Chart Analysis
Ethereum is holding a major long-term uptrend as the price bounces off the ascending trendline support. This level also aligns with a strong historical resistance-turned-support zone, adding more confluence to the current bounce.
As long as ETH stays above this structure, it suggests a potential macro bullish continuation, with eyes on the upper resistance line near $3,200–$3,500.
A strong defense at this zone reinforces long-term bullish sentiment.

Reversal Alert: $ROSE Clears Trendline, Next Stop $0.060?$ROSE/USDT is showing early signs of a potential trend reversal. After months of respecting a strong descending trendline, price has finally broken above it and is now consolidating just below a key resistance zone.
This area aligns with both the previous supply and the 50 EMA, making it a critical level to watch.
A confirmed close above this resistance, backed by strong volume, could trigger a bullish continuation toward the $0.044 and $0.060 levels.
DYOR, NFA

AI16Z Breakout Confirmed – Eyes on $1.15 Target$AI16Z has successfully broken above a key descending resistance line, signaling a potential major trend reversal after a prolonged downtrend.
After the breakout, the price is now testing a minor resistance zone. Holding above this zone could open the door for a strong upside move toward the next higher targets (highlighted in blue).
The structure looks bullish as long as price stays above the minor resistance area.
DYOR, NFA

PEPE Building Momentum – Eyes on 100 EMA BreakoutCRYPTOCAP:PEPE is respecting a rising trendline beautifully, with multiple successful touches (highlighted in yellow), showing strong underlying support.
The price recently bounced again from this trendline, right above a key horizontal support zone. Additionally, the MACD indicator is turning positive, suggesting growing bullish momentum.
Currently, PEPE is approaching the 100 EMA resistance. A clean breakout above the 100 EMA could open the path toward the key resistance zone above.
DYOR, NFA

Accumulation Underway: Bitcoin’s Next Move Could Be ViolentBitcoin has shown a strong recovery after reclaiming the 50 EMA, which had been a major dynamic resistance across multiple levels. After accumulating between $83,000–$87,000, BTC broke out sharply and is now consolidating again just below a major resistance zone at $95,000–$97,000.
The current price action shows another accumulation phase just under resistance — similar to the previous pattern before the breakout.
A clean breakout above this resistance zone could explode Bitcoin toward $100,000+.
On the downside, if rejection occurs, the 50 EMA around $87,000 could act as strong support once again.

CTSI Breaks Major Downtrend – Is the Next Leg Up Here?CTSI/USDT – Bullish Breakout in Play
CTSI has broken out of a long-term descending trendline, signaling a major shift in market structure. After reclaiming the $0.063–$0.068 resistance zone as support, bulls are clearly in control.
Key Highlights:
✅ Downtrend broken after months of lower highs.
✅ Minor resistance flipped to support, confirming strength.
✅ RSI at 75.62 shows strong bullish momentum.
✅ Structure is now forming higher highs and higher lows — a key trend reversal sign.
🎯Upside Targets:TP1: $0.085
TP2: $0.110
Support to hold: $0.063
CTSI is gaining momentum — if support holds, the next leg up could be explosive.

MANTA/USDT – Bullish Structure Forming MANTA/USDT – Bullish Structure Forming
MANTA is showing early signs of a trend reversal, with multiple confluences indicating strength from the bulls. After a prolonged downtrend, the asset has not only broken key resistance levels but also flipped the 50 EMA, a major dynamic resistance, into support.
✅ Key Technical Highlights:
Double Bottom Formation:
The chart has clearly printed a double bottom, one of the most reliable reversal patterns.
This formation suggests that bears are losing control and buyers are starting to step in with conviction.
Breakout Above the 50 EMA:
Price has decisively broken above the 50 EMA (~0.2127), which had previously acted as dynamic resistance during the downtrend.
Notably, the price retested the 50 EMA and successfully bounced, confirming it now as support.
Resistance Flip to Support:
The previous horizontal resistance zone has been breached and retested, reinforcing its role as a demand zone.
Market Structure Shift:
Lower highs and lower lows have now transitioned into higher lows and higher highs, signaling a structural shift from bearish to bullish.
Momentum and Candle Structure:
The bullish candles post-retest show strong momentum with minimal upper wicks — a sign of buyer strength.

ETHFI Breakout Loading? Targets Up to $1.67!$ETHFI/USDT Analysis
Price is currently trading around a key resistance zone after a strong recovery from recent lows. While momentum looks bullish, the resistance has not been broken yet — making this a crucial level to watch.
A clean breakout and candle close above this zone could confirm a potential rally toward the next targets.
🎯 Upside Targets (if breakout confirms):
TP1: $0.881
TP2: $1.291
TP3: $1.677
📌 For now, stay patient. Let the price action confirm before entering — this zone could act as a rejection point if bulls fail to push through.
DYOR, NFA
