Unilever
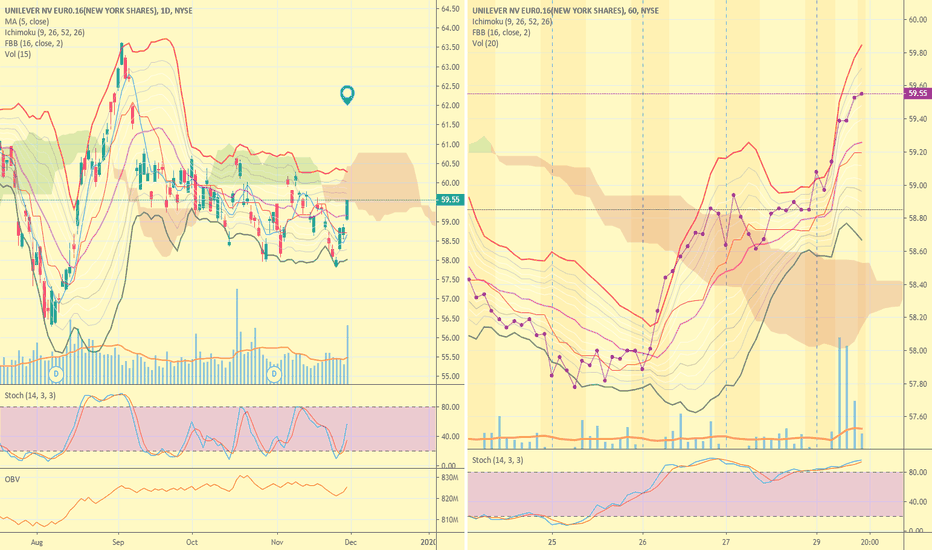
UN Buy signal on the 45min chart We have a few buy signals on the 45min chart for Unilever. First at the top we have a buy signal on the Bollinger bands, while we also have a buy signal on Divergence+ based on these indicators alone we should expect UN to hit $62 a share this week alone.
Also if you look at the MACD you can see weakening bear momentum and the trend lines have met and starting to face up.
The RSI is also at a new low of 32.69. Today I started a position in UN, trade activity will be stated below. Stay tuned for more updates and daily candlestick segments.
Unilever NY shares Short coming!!It's a possible outcome for 1:3 profit margin for every risk. But it may take 3-4 days.
Unilever, a stock we should not miss in this recoveryWe should be entering this time, great stock to own
Unilever looks nice here Revenue : 56.772 B
Income : 10.446 B
Div-Expected : 1.85
ROA : 15.1
( data ref : TraderView Stock Screener )
20+% profitability for such a giant company is a good argument to watch this stock in mid- to long-term perspective. In short-term, there is a significant increase in Volume.
Pay attention to "volume" here. Looks promising for an upward movement.
$UN Longif the daily close above the res line, buy and hold then wait for a break out at the all time high
exit when it's a false breakout
75% partial if faces resistance at prev all time high
High win prob. as the resistance level is clearly identified
unilever longUnilever hsa decreased alot since november, more so then competitors. When looking at the YoY financial statement the decrease seems to be to large in my opinnion. As such we expect unilever to hit throught the resistance on 38. while market volatility is low (aexvix) i expect a rebounce before the market hits 475. This could result in unilever first bouncing back as wel. to counteract this we can either buy a stock now, and a OTM put at 37.5 so that we will get dividend, or buy a put in the money and a call OTM at current level.
Unilever (UNA) ShortA negative pattern was formed on the weekly graph from October 15 to October 16, which led to a downward slope in the price. This price broke the upward sloping support line giving room to further drops in the price level. I would look for this to continue falling to the long-term support line around 36.5 (around fib 0.5). Unilever have come under pressure recently with a drop in their turnover in EM highlighted in their Q3 results, and I see this to continue to be an issue due FX prices making it more expensive to produce goods, with those costs passed onto consumers.
Descending Triangle : HINDUNILVR Weekly - Waiting for BreakoutHINDUNILVR is ranging from 2015 and formed good descending triangle and we can notice that there are 3 touches by price on both the trendlines of triangle.
Measure of Triangle is about 200 pts , So when we fix targets we can expect around 200pts and this is Medium term trade idea, so this can take time to breakout and trade can progress over few months after we enter the trade on breakout direction.
Entry - On the Breakout direction
Stops - Opp. to Breakout Direction or based on ATR
Target - Measure of Triangle's height from breakout candle
Its Trade Idea only, take trades after analysis. Happy Trading !
Hit Likes to Agree..
Comment your views...


