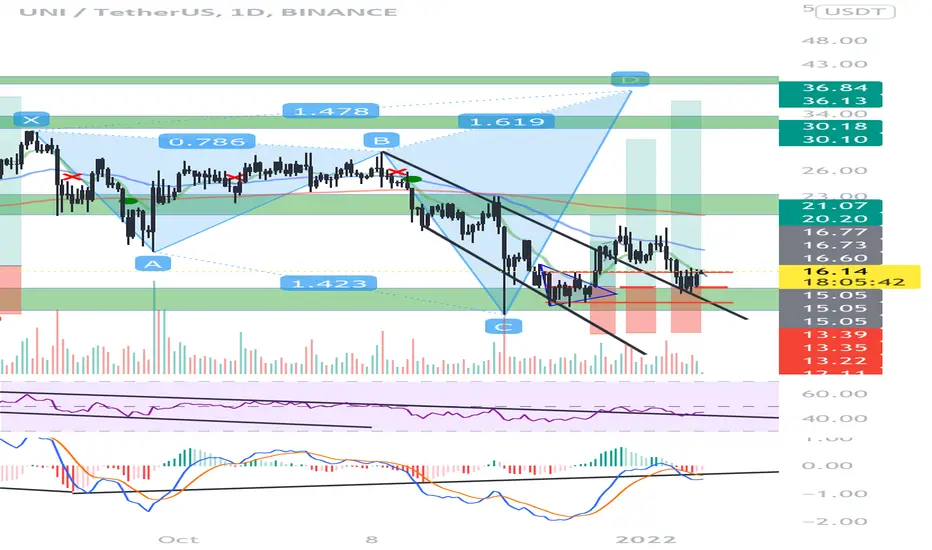
UNIUSD Falling WedgeFalling Wedges usually result in bull breakouts
The yellow bars pattern placed is very speculative. Just assuming that once price breaks out of the formation, bulls will dominate.
Uniswap

UNISWAP !!!! SCALP TRADE !!! ACTIVE !! 2ND TRY!Bearish Shark Pattern on 1 hour.
long on a bullish engulfing candle at the touch of the channel.
looking for 1.618 as the target.
STOPPED YOU OUT THE FIRST TIME IT HAPPEN HERES THE SECOND TRY
Entry: $1818.93
Stoploss: $1811
Target: $1833.50ENTRY: $15.32
STOPLOSS: $15.00
TARGE: $17.40

UNISWAP!!! SWING-TRADE ACTIVE !!!!!Uni swap has pulled back 60%.
Great area for a reversal to occur.
Horizontal level as support.
Bullish engolfing candle as trigger.
Entry : $15.05
Stop loss : $12
Target 1 : $21
Target 2 : $30
Target 3 : $36
Btw I use a modified shark or cypher pattern and trade it to the 1.618. Use your own caution
UNISWAP BEARISH DIVERGENCE 4H TIMEFRAME. SHORT POSSIBILITY!Picking up from where we left on our analysis on UNISWAP yesterday (linked below),
Price looks to have broken above the pennant whilst forming a bearish divergence in the process.
Could be a short opportunity and will most likely be a fakeout until invalidated of course.
Trade Idea;
Wait for price to close below resistance before going short.
Enter with a stop-loss above rejection and target support of the pennant.
If you agree with this idea, pls leave a like as well as your thoughts in the comments section.
As always, feedback is appreciated.

UNIUSD Higher LowUNI is current showing strength for a solid upside move, and BTC is indicating seller exhaustion at that $40,779 area. Thus, I took a long on UNI.
Entry: $15.42
Stop: $13.40
1st Target: 61.8% retrace
2nd Target 78.6% retrace
3rd Target: $29


UNI SMALL BULLISH!Union looks like it is forming a bullish divergence there is a possibility to touch the target
16.7 & 17.6 what do you think?


MahaDAO/Wrapped Ether seems undervalued 22/02/2021MahaDAO, which is releasing ARTH, a decentralized non-depreciating algorithmic token, which derives its value from a basket of uncorrelated assets, the relative weights of which are automatically adjusted by automatic buying and selling in response to changes in the price of each individual asset relative to the others.
MAHA is a governance and utility token that will regulate ARTH value coins — the world’s first non-depreciating crypto token.
some of the key fundamentals that make the $MAHA unique from other projects and showcase why we’re here for the long run. 1. $MAHA is used to fuel the liquidity for $ARTH The MahaDAO stablecoin platform is amongst the first of it’s kind to have liquidity farming built directly into the protocol, creating the world’s first incentivized stablecoin. Those providing liquidity to create $ARTH will be earning $MAHA tokens as rewards. 2. $MAHA is used to pay the stability fees for $ARTH As more and more collateral is deposited into a vault to mint $ARTH; A fee is paid by the vault owner if he/she wishes to. 3. $MAHA is used to make key decisions to the direction of $ARTH As a governance token, $MAHA token holders will get the ability to vote on various parameters that’ll govern $ARTH such as the stability fee, risk parameters of various collaterals, reward distributions, etc. 4. $MAHA is bought-back and burnt as $ARTH adoption grows As the adoption of $ARTH grows more and more, $MAHA is bought back and burnt off to reduce the supply of $MAHA tokens and pay an indirect dividend to all existing $MAHA token holders.
The live MahaDAO price today is $9.57 USD with a 24-hour trading volume of $2,912,617 USD. MahaDAO is down 3.33% in the last 24 hours. live market cap of $5,861,850 USD. It has a circulating supply of 612,451 MAHA coins and a max. supply of 10,000,000 MAHA coins.
The top exchanges for trading in MahaDAO are currently BKEX, Uniswap (V2), Hoo, Gate.io, and Bilaxy.
technical:
as we can see there are 2 TPs above the ATH which we have defined them with Fibonacci expansions.

yAxis Seems to be Very Good for Investment 22/02/2021What is yAxis?
yAxis markets itself as a meta yield farming aggregator that is able to switch the underlying assets when deploying strategies. Yield farming strategies are governed by a DAO, where token holders vote regularly to implement the best strategy out of a selection of strategies provided by multiple yield aggregators.
yAxis price today is $33.70 with a 24-hour trading volume of $3,473,514. YAX price is up 0.2% in the last 24 hours. It has a circulating supply of 800 Thousand YAX coins and a max supply of 938 Thousand. Uniswap (v2) is the current most active market trading it.
What are YAX tokens?
The YAX token is yAxis’s native governance token. As the platform is developed further, YAX tokens will be used to shape the direction of its future.
Among the proposals that the DAO may choose to execute is to alter the emission of YAX or to reward early users of the protocol. Governance may also vote for the protocol’s fees to be distributed to YAX holders.
10% of YAX tokens is saved into a community treasury which could be deployed via a governance vote.
How does yAxis work?
The goal of yAxis is to create a meta yield aggregator which can obtain the best yield by taking advantage of other existing yield aggregating platforms such as yearn.finance or Pickle Finance. In other words, it operates above these platforms and can switch between platforms that offer better yields.
Currently, the product can be divided into MetaVault and governance.
Multi-Asset MetaVault
The multi-asset MetaVault allows users to deposit different types of stablecoins such as USDC or DAI. Users who deposit stablecoins will receive MetaVault tokens (MLVT) to represent their share of the vault. MLVT tokens will accrue value as the deposited funds are deployed to the best yield-aggregating strategy. Depositors will get to save on gas fees as the fees are distributed to all depositors.
Whenever there is a better strategy available, MetaVault will convert the underlying deposits into the appropriate asset to begin yield-farming using the more profitable strategy. Users can choose to withdraw their funds anytime by returning their MLVT tokens for any stablecoin of their choice and interest.
yaxis metavault page
Governance
Strategies are decided by the community by staking YAX tokens on the governance platform. YAX holders can choose from a preselected list of yield farming aggregators, and stake their tokens in the contract which they believe will provide the best return.
Strategy risk, fees, and the overall DeFi market sentiment will be displayed on the governance user interface. In return for voting, the community will reward voters with a share of the MetaVault’s performance fee.
How do I get YAX tokens?
You can obtain YAX by purchasing them from cryptocurrency exchanges such as Uniswap or Bilaxy.
Besides that, you can also earn YAX through the staking section on the yAxis platform. Users can stake their existing YAX to earn a share of farming rewards which are sold to YAX and redistributed back to stakers.
Users may also provide liquidity for the YAX-ETH pair on Uniswap and stake the liquidity provider tokens to earn YAX in the LP section. To know more about this and other yield farming programs, you may head over to our Yield Farming page.
there are total of 3TPs i have mentioned where easily we can achieve them. i have mentioned these levels for those who did not invest on time so you can understand where to jump in the market in case you where interested

UNI/USDT - UpdateThe trade was never validated, as the price formed a swing failure at resistance, resulting in a price drop.
I'll let you know if another opportunity occurs.
<———————————————>
Follow us on our socials for more!
Thanks and happy trading :)

Uni (Uniswap) is Ready to make a move!Our Proprietary Oscillator is breaking above the zero line and UNI is now a Buy/Buy on Pullbacks. Price target is $26 to $28 and notice that our Oscillator is leading price higher.

UNI/USDT by CryptoTradersWWThe price is hovering slightly below previous support, which has now turned into resistance; the value is also low, which is another type of resistance.
My strategy is simple:
after these levels have been broken and held, I will try to buy.
Entry: Looking for 1 and 4 hours candle closes above $20 is ideal
Take Profit 1: $22.4 is the prior daily resistance level to aim for.
Take Profit 2: $25
Stoploss: $18
NOTE: This deal will not be valid until all of the requirements have been met.
<———————————————>
Follow us on our socials for more!
Thanks and happy trading :)

BAT Daily TA : 01.04.22 : $BATAll supports and resistances are marked on the chart. As we can see, the price is in an important range and recommended to keep an eye on it ...
Follow our other analysis & Feel free to ask any questions you have, we are here to help.
⚠️ This Analysis will be updated ...
👤 Arman Shaban : @ArmanShabanTrading
📅 04.Jan.22
⚠️(DYOR)
❤️ If you apperciate my work , Please like and comment , It Keeps me motivated to do better ❤️

UNIUSD Long with tight stopThere is a potential higher low on UNI. This is after the bullish divergence played out. Thus, I'm only hoping for bullish convergence here. BTC might be painting a bullish engulfing candle, and ETH is currently showing seller exhaustion. I believe the potential H&S on UNI will be invalidated and we'll see higher prices.
If not, I have a tight stop loss.
Entry $17.33
Target: $27
Stop: $16.65

UNIBTC to continue its uptrend?we see clear levels on the chart, break the yellow downward trend and we are likely to see a continuation of the uptrend.


Uniswap Price Analysis — December 31UNI recently suffered a sharp -16% correction from the $20.00 region to the $16.75 support between Monday and Thursday, amid a reemergence of bears across the broader market. Despite the recent crash, the cryptocurrency maintains a bullish outlook on my daily chart and remains on course to $21.50. That said, I expect to see a steady recovery towards the $20.00 psychological resistance mark over the coming days. Nonetheless, this recovery could take a while, given the current volume drought in the market as we head into the new year.
Meanwhile, my resistance levels are $18.25, $19.20, and $20.00, and my support levels are $16.75, $15.00, and $14.00.
Total Market Capitalization: $2.21 trillion
Uniswap Market Capitalization: $11.2 billion
Uniswap Dominance: 0.50%
Market Rank: #18

UNISWAP is bullish despite the market weakness $UNI is showing strength by breaking the descending trendline and now is bouncing off the strong support area. This happens because of its fundamental news - Uniswap V3 has launched on the Polygon chain and now is actively growing the trading volume on the platform.

UNISWAP BULL FLAG BREAKOUT, 4 RR tradeAfter retreating to the .382 Retracement level shown by the dashed line, UNI developed bullish divergence on the MACD and bounced perfectly off the 50 mark on the RSI, it has now broken out of the flag and is setting up a very bullish daily close.
Target is 21.5 however 18.93 is a key level to watch.
I entered earlier through my phone and could only post now.

UNISWAP - 2021 Buy OR SELL Signal FORECAST NEXTUNISWAP - 2021 Buy OR SELL Signal FORECAST NEXT
DAYLY trend chart
Technically we are still overall bearish and here are the two possible scenarios:
Buy level - $12 - $16
Stop loss $10. 40
Take profit 1 - $30
Take profit 2 - $40
Right here is price in a descending triangle with price about to test the next support level .
If price does not break the demand zone downward, then I expect a rise by 20% to $30.
What do you think?
If you like this analysis, smash the "like button" and leave a comment below to share your thoughts
or let me know what crypto you want to see!
Trading is a reflection of yourself. Learn more daily and be ready for every opportunity.
Have a nice trading!

UNI-USDT Trade Setup#UNI trade setup:
Bough a good bag here. OBV and RSI show strength.
If the price drops and closes below the support, I will immediately exit from this trade.

IOTA, buy spot after confirmationCurrently in a long-term uptrend.
Until green - STRONG - support is not broken (no weekly close below the trendline) we can potentially see a possible breakout to the upside, above the red resistance. Do not buy a spot before the confirmation of current red resistance.
