Uniswap (UNI)Hi everyone,
This is my description:
Purple Lines: Support & Resistance (for a week) “VERY IMPORTANT”
Blue Lines: Support & Resistance (for a day) “IMPORTANT”
Orange Lines: Support & Resistance (for a 4H)
Thanks for your attention.
**IF YOU WANT ME TO ANALLYSIS ANY OTHER CRYPTOS, PLEASE COMMENT THE NAME OF IT FOR ME**
Uniswap

UNI FLY NEXT NEW ATH 50UNI SWAP , NEW LOUNCH COMMING, EVENT, VALUE AND , Now Ready to move new level 1 by 1 touch 50 USD


UNIUSDT Technical Analysis⏳ Spot
💎 UNIUSDT has broken above the triangle and a major resistance. It has been supported by the support line and after the retest it is continuing the Bullish move
🌐 Tradingview
🏁 Short & Medium Term
💵 Invest Only 5% of your Portfolio
🎳 Entry at Market or at 25.14 - 25.48
☕️ TP1 27.02
🍺 TP2 28.02
🍻 TP3 29.97
🍾 TP4 32.51
🍷 TP5 35.50
🍸 TP6
🍹 TP7
🎁 TP8
🚫 SL 24.00
Good Luck 🎲
Check the Links in Description and If you LIKE this analysis, Please support our page and Ideas by hitting the LIKE 👍 button. ❤️ Your Support is really appreciated! ❤️
Traders, if you have your own opinion about it, please write your own in the comment box. We will be glad for this.
Feel free to request any pair/instrument analysis or ask any questions in the comment section below.
We will have more FREE forecasts in TradingView soon
Have a profitable day 😊👍🏻

Uniswap Bullish BreakooutUni has broken out from the triangle pattern and retested. It could be a good idea to go long.
Risk Reward Ratio - 2:1
Target Price is placed near future resistances, while Stop Loss is placed below major supports, 200 Moving Averages and previously lower trendline.

Uniswap (UNI)Hi everyone,
This is my description:
Purple Lines: Support & Resistance (for a week) “VERY IMPORTANT”
Blue Lines: Support & Resistance (for a day) “IMPORTANT”
Orange Lines: Support & Resistance (for a 4H)
Thanks for your attention.
**IF YOU WANT ME TO ANALLYSIS ANY OTHER CRYPTOS, PLEASE COMMENT THE NAME OF IT FOR ME**

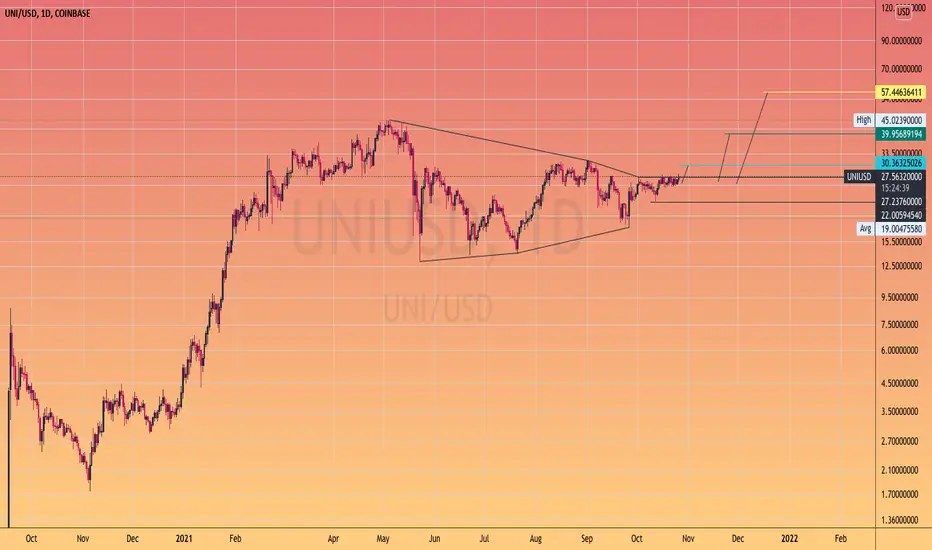
UNIUSD and ETHUSDAn idea comparing two points. One that is in progress (UNI) and one that has already occurred (ETH)
The coins begun there lives with a V shaped structure that can be seen across the two (white rectangle)
The pattern though I believe is continuing further.
UNI gains would be massive if this is considered a viable comparison

UNISWAP Time to BUY!Hey traders,
Everything is marked on chart!
Do not forget to use Stop loss.
Please like and share.
Thank you.

Morpheus Network rejects from channel bottom 2X expectedHi,
Short update as we have a 2X potential on MRPH vs ETH on Uniswap. Looks like pretty strong rejection on the bottom of the channel.
If we retest the channel top, it will be an opportunity to double your ETH
See chart.
Close under the channel would negate this hypothesis.
dyor

HEX USDC Uniswap 1DTesting support from the beginning of this run up. Last time it broke down below the 99 day MA was in March. I would be surprised if it breaks much lower from here, considering Pulsechain launch coming up and historically HEX does not stay below the 99 day MA for long. If it breaks below the red box then expect an extended accumulation phase.

Is UNI Breaking out ? It seems like that we are going to close above the trend line wich can indicate an upper move. Let's keep an eye on it.

$UNI/USDT 4h (Binance Futures)Descending triangle break & retestUniswap is up-trending and looking good for another bounce on 50MA support, let's catch next dip!
More information on that DEx (Decentralized Exchange) and DeFi / BSC token on uniswap.org
Current Price= 25.782
Buy Entry = 25.757 - 24.971
Take Profit= 27.834 | 29.419 | 23.381
Stop Loss= 23.381
Risk/Reward= 1:1.25 | 1:2.04 | 1:3.07
Expected Profit= +29.22% | +47.97% | +72.03%
Possible Loss= -22.26%
Fib. Retracement= 0.786 | 0.883 | 1
Margin Leverage= 3x
Estimated Gain-time= 3 weeks

UNI/USD - Breakout in progress, $30 next! 😍As you can see, UNI broke above the pennant... bullish.
Continuation is expected and higher price levels, such as $30 and then mid $40 if the rally picks up where we also find the ATH.
For some reason decentralized exchanges are pumping today, 1inch pumped 50% (see below).
Chart looking good!
Like and follow if you liked my idea!
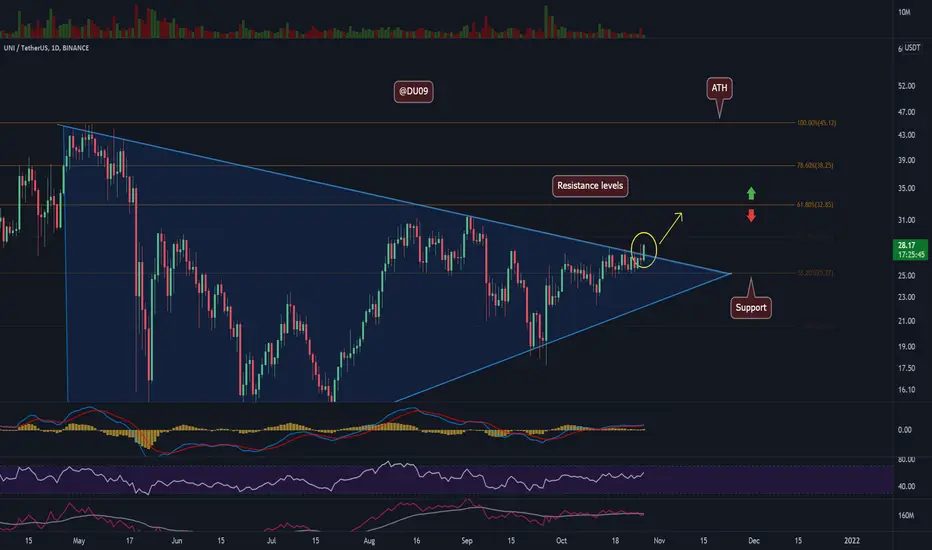
$50 - UniSwap is ready to goUNISwap forming the a solid ascending triangle and will test it is ATH soon. Buy the breakout or buy at support.

$UNI building out a move higherWith the down trend line broken and price above all key exponential moving averages, I expect a move to the upside soon.


UNI /USDT ALL OF THE PATTERNS SHOW TO RISEwhat if head and shoulder or three angle, there is no different, all of the patterns show to rise. but, the most important question is this, when?
well, it seems we have to wait for seeing a break out.

#UNI [ UNISWAP ] double bottom & Breakout#UNI/USDT chart looking jiucy after the double bottom & the breakout, W've also detected a Bollinger Band Breakout, Super Trend & Trend Reversal yesterday at 26.55.
UNI/USDT 4H Chart
USDT - Targets
1) 28.94
2) 29.77
3) 30.32
4) 30.87
5) 31.98
6) 32.53
7) 33.08
8) 34.18
UNI/BTC 4H Chart
BTC Targets
Targets
1) 0.0004648
2) 0.0004781
3) 0.0004869
4) 0.0004958
5) 0.0005135
6) 0.0005223
7) 0.0005312
8) 0.0005489

#Uniswap about to pop to $30 then $40again structure is there
uniswap volumes are breaking record highs
so fundamentally bullish as well
(but beware Vc holdings who will likely take profits once the #alt run is nearing the top)
UNI Vol on Floor, Expansion SoonVolatility is on the floor on the UNI 12hr. chart. Bollinger bands tight, we should expand in the next week and I am placing my bet on an upside target of 35.
I have been getting a lot of Ideas very wrong, hoping for a redeemer in this one.

Uniswap is getting ready to move!Uniswap has multiple timeframe squeezes. When the daily squeeze fires we may hit my first target of $38.

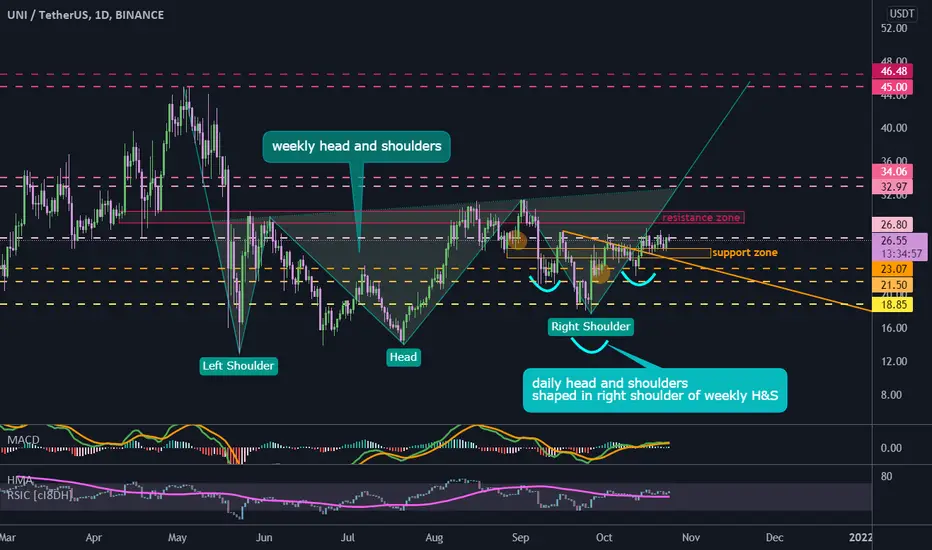
UNI inverted head and shoulders#UNIUSDT
$UNI shaped a head and shoulders pattern in weekly time frame that we can see its fractal in daily time frame in right shoulder, and price broke out from neck line of daily H&S and confirmed it as support.
target of daily H&S is around $32 and $34.
target of weekly H&S is around $45 and $47.
if price break down from support zone, then $23 and $21.5 are the nearest supports.