UNI (UniSwap) might be heading for the 78.6% zone.UNI has visited the 78.6 - 88.6% zone already and seems to be heading there to clean up. Wait for a good push out of the zone before entry.
Uniswap

QUICKQuickSwap is a fork of Uniswap that runs on the Polygon network (formerly Matic Network), a Layer-2 scaling solution for Ethereum. Polygon features lower transaction fees compared to the Ethereum mainnet, enabling QuickSwap to facilitate token swaps at a lower cost relative to exchanges like Uniswap v2.
Last time I traded it - felt like liquidity wasn't there. Took forever to fill limit orders which is a bit attractive. FILL was acting the same way for me back in February before it pumped.
You provide liquidity now and get out when everyone is paying attention. Chart looks ok. Horizontal support and resistance lines work better than diagonal but I always like it when I see a breakout and re-test. Allocating a very small portion towards this trade just because its newer and nobody is talking about it ;)
I also like where RSI is relative to RSI at the same price in the past. Seems like momentum is building.
No targets, yolo trade

MATIC/USDTOh my GOD, I forgot to shared with you my last MATIC trade. As you see, the head and shoulder pattern was broken and now we must leg to the moon.

uniusd daily scalestrong and safe uptrend in next long term cycle.... for long term price 300 is very possible even if we patient more than 3 years.... now in the support of 3 strong and important elements....

[UNIUSDT W1 SEPT 2021]UNISWAP // UNI // UNIUSDT
UNIUSDT
Long Setup
👉🏻 Wedge pattern formed and broken out of, on an ascending trendline, further upside movement if this major resistance is broken and retested.

UNI primeUNI is prime for a move up, 4 h and daily timeframe starting to look oversold. Local HnS formed. Waiting for the breakout of the HnS and the descending wedge.
The most interesting part of UNI price action is the volume of the last few bars. The volume was extremely high which suggest sellers are locally exhausted, they tried to push the prices lower without succeeding creating an imbalance of supply and demand.
I am expecting higher prices with the targets highlighted in the chart.
Also, this high volume is on strong support, which reinforces its strength and the bullishness of the signs.
If you like the content FOLLOW ME, SHARE the chart nad LIKE.
You will help me to grow and other people to improve...I really much appreciate it.
If you have any questions feel free to COMMENT below.


🟢 UNIUSDT(Update) #Buy_Recommendationthe price has reached a good support again and is also valid for #Buy_Recommendation . Targets updated.
In order to buy, the SL (stop loss) and capital management must be observed.
All resistances and TPs (take profits) are marked on the chart.
👤 Arman Shaban
⚠️(DYOR)

UNI/USDT { bullish bearish expanding triangle pattern }!!!!Hello Dear Traders!
There are two possibilities:
1_ The correction wave is likely to be three-part = { ABC} and then the impulse wave begins and finally experience the rising price.
2_ the correction wave is ABCDE and then the impulse wave and then we'll see the price drop.
Tomorrow and the day after tomorrow will make future events clearer BINANCE:UNIUSDT
what's your idea, Leave a comment and share your idea.
thanks 🙏🌹

Uniswap (UNI) Price Prediction: Forever Unicorn!As the market goes green, the majority of assets show bullish signs and Uniswap is no exception. It is going up, and I’m pretty confident that this asset will likely update its all-time-high in a relatively short period of time.

UNIUSDT 4H - Well On Its Path To Break $35, $45 Then Reach $65Continuation of older UNI idea, We will ultimately break these prices around $35-45 , then hit the May ATH, breaking that puts us in clear path for our target of $65 and above.
Not Financial Advice

Uniswap (UNI) - Pennant BreakoutUniswap (UNI) - Pennant Breakout
Target: $39
........................

UNIUSDT UP Binance leveraged token trade.Position up by 19.1% from yesterday. All because of UNIUSDT UP Binance leveraged token. Steady, stable performance.

Matic/USDT 1Day ChartMatic is above the 200 MA. Targets are marked on chart. Currently breaking trend. Waiting on volume Confirmation. Enter on break or enter on retest of trendline

Uni/USDT 1 Day Chart With targetsThis is a mid term Hold idea. There are also targets on this Chart. It’s would be best to look for a retest the move has already started. There is now a clear break above the 200 Moving average on the Daily Chart. This has the absolute most upside. All of the retests look to be over as of right now.


UNI Breaks Out Of Multi Week Falling Wedge, Here Are The Levels-UNI is up nearly 18% over the last week
-Price just broke out of a falling wedge pattern
-The 200MA has been acting as support
Uniswap has brought an amazing solution to the crypto ecosystem as decentralization continues to become more & more used. The ability to trustlessly swap tokens with one another has gained a huge amount of traction over the last year as users continue to trust centralized companies less and less. Uniswap currently accounts for nearly 22% of all decentralized exchange volume with a current 24 hour volume of 1.6B. Given this usage, we must expect UNI to continue reviving as long as BTC allows for it.
Ever since UNI broke the $25 mark earlier this month, price has respected it as support. UNI climbed nearly 120% in less than three weeks & since then it’s been consolidating in between two important levels. Just the past day, UNI managed to break out of this pattern and surge right to its major resistance zone. This resistance zone is found from $29.06-$30.27 & has held UNI down for several weeks now. For a bullish breakout to occur, UNI must break & hold this zone & that will allow it to hit its given targets.
Over the past month, UNI has been held up by its 200MA. This can be used as a good gauge as to whether or not UNI is in a bullish state. While looking at the chart, a potential path is given for UNI to follow. This would be a retest of the previous resistance trend. If this occurs & bulls fail to hold above this trend, UNI may be in for a further fall. In the case UNI breaks below its major support of $27.49 along with the 200MA, we should then expect a fall to $25 to occur at minimum.
While looking at the Stochastic RSI, we can see strength just hit the top value within the overbought region. As long as strength continues above the 80 value, UNI will continue in a bullish push. At any time if strength breaks below, we should expect a pullback to occur. The MACD just crossed above the 0 value for the first time in a week. A pullback to the 0 value is likely as the histogram has started to turn around.
UNI Intraday Analysis
Spot rate: $29.54
Trend: Neutral
Volatility: High
Support: $29.06
Resistance: $30.27

Uniswap Uniswap is prepare them for a next run to 32 a 33 $
fundamentels are pretty strong
all the rules that are comming CEX's are forcing the DEX's to grow

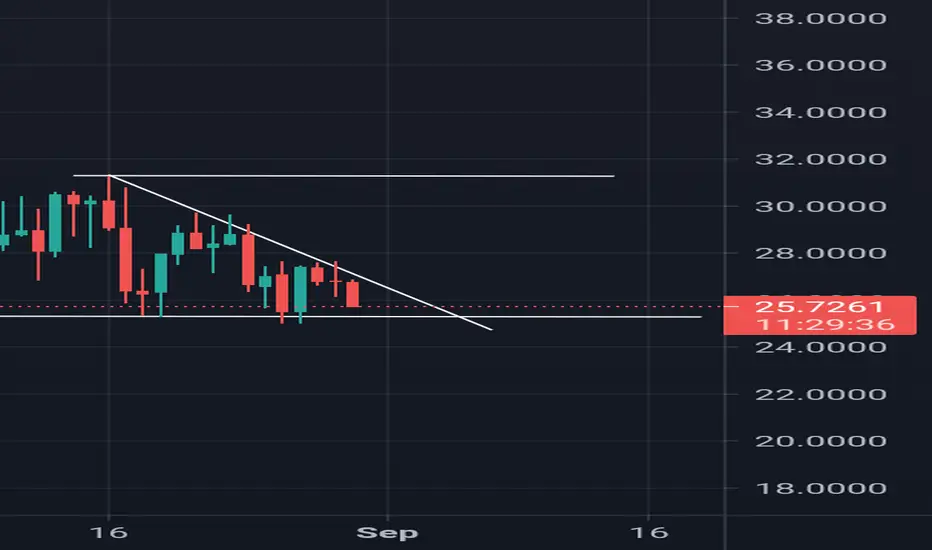
Uniswap with triangle and range25.3 to 31.2 is the range of uniswap on daily chart almost 23%
It is coming to 25.3 again let see how will it behave
Might consolidate and then we can enter if there is bullish pressure again
CRYPTO - UNISWAP - Best set-up ever. Get on it!CRYPTO - UNISWAP - UNI - This could be one of the best examples of a Wyckoff accumulation I have seen. I have filled in all the details for you to show the accumulation. We are in the Sign of Strength. Volume is falling off. STO has bottomed out. UNI is about to Moon. Target 1 = 43 but final destination should have a 5 handle. Nice.

ETH/BTCEthereum looks bullish since it broke the descending triangle, now it's trading inside an ascending rectangle.

UNI/USD double bottom opportunity 22.00000000Best price would be 22.00000000 USD
Area of demand zone exactly in line with previous significant resistance now will become support
Just patiently wait for it

Uniswap (UNI) - August 26Hello?
Welcome, traders.
By "following", you can always get new information quickly.
Please also click "Like".
Have a nice day.
-------------------------------------
(UNIUSD 1W Chart)
If the price is maintained above the 8.75010245-12.92996012 range, the uptrend is expected to continue.
(1D chart)
We need to see if we can break out of the downtrend line by moving towards the 30.64308018-33.25051255 section.
If it falls from the 26.42093574 point, it can touch the 17.75218020-20.86609475 range, so you need to trade carefully.
It is a weak support and resistance point, but should move above the 36.60770033 point to accelerate the uptrend.
-------------------------------------
(UNIBTC 1W chart)
If the price holds above the 0.00035399-0.0041575 range, we expect the uptrend to continue.
(1D chart)
We need to see if we can reorient ourselves by ascending to the 0.00058765-0.00064499 section.
If this continues, we should see support at the 0.00047297 point.
Looking at the big picture, the section 0.00047297-0.00058765 is a sideways section.
If the price is maintained in this consolidation zone, it is expected to turn into an uptrend.
However, in order to continue the uptrend, it must rise above the 0.00064499 point.
------------------------------------------
We recommend that you trade with your average unit price.
This is because, if the price is below your average unit price, whether the price trend is in an uptrend or in a downtrend, there is a high possibility that you will not be able to get a big profit due to the psychological burden.
The center of all trading starts with the average unit price at which you start trading.
If you ignore this, you may be trading in the wrong direction.
Therefore, it is important to find a way to lower the average unit price and adjust the proportion of the investment, ultimately allowing the funds corresponding to the profits to regenerate themselves.
------------------------------------------------------------ -----------------------------------------------------
** All indicators are lagging indicators.
Therefore, it is important to be aware that the indicator moves accordingly with the movement of price and volume.
However, for the sake of convenience, we are talking in reverse for the interpretation of the indicator.
** The wRSI_SR indicator is an indicator created by adding settings and options to the existing Stochastic RSI indicator.
Therefore, the interpretation is the same as the traditional Stochastic RSI indicator. (K, D line -> R, S line)
** The OBV indicator was re-created by applying a formula to the DepthHouse Trading indicator, an indicator disclosed by oh92. (Thanks for this.)
** See support, resistance, and abbreviation points.
** Support or resistance is based on the closing price of the 1D chart.
** All descriptions are for reference only and do not guarantee a profit or loss in investment.
Explanation of abbreviations displayed in the chart
R: A point or section of resistance that requires a response to preserve profits.
S-L: Stop Loss point or section
S: A point or section where you can buy to make a profit as a support point or section.
(Short-term Stop Loss can be said to be a point where profit and loss can be preserved or additional entry can be made through split trading. It is a short-term investment perspective.)
GAP refers to the difference in prices that occurred when the stock market, CME, and BAKKT exchanges were closed because they are not traded 24 hours a day.
G1 : Closing price when closed
G2: Opening price
(Example) Gap (G1-G2)
