[Long] Trend Analysis on Uniswap UNI COINIn has been a good past few weeks for Uniswap. The coin has seen an upwards trend from 28 dollars to 34. Recently after a wave down we can see that Uniswap has leveled out. In this traders opinion Uniswap is now on it's 5th wave up at some point within the next to weeks as it's already saw a recent down from 30 dollars to 34 just in the last day, April 13th to April 14th. Uniswap coin UNI has a long way to grow. This reminds me of a situation like NEO except for the bad downfalls of NEO this coin has potential to go all the way up and because of its decentralized architect it is here to stay. Because of Ethereum Uni coin has grow up fast and hard to 34 dollars and this trader knows that this is just the start having seen it again and again from 2014 with different altcoins. I believe this is the 5th wave up and could see 5% to 10% profit increases in just a few weeks and isnt that what anyone could hope for?
Uniswap

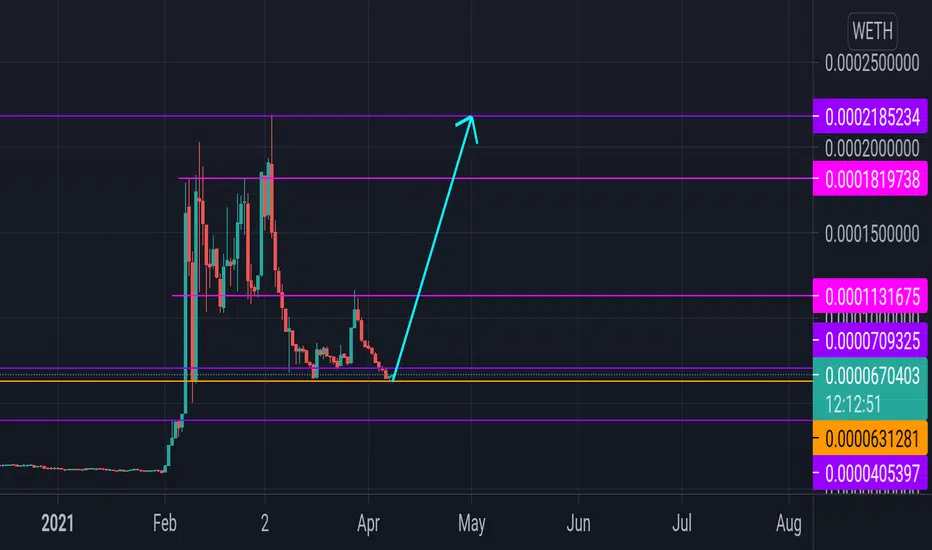
$UNI breaking out here$UNI just broke upward out of the wedge.
Very Bullish on RSI.
Great entry. This thing will run.

DeFi aggregator Troy lifting off NOW. ($TROY)DeFi play TROY is a Smart Hybrid Asset Management System offering yield farming, fixed savings, a liquidity aggregator (for Binance, Huobi, OKex, Uniswap, Curve, Balancer), provider of arbitrage opportunities, etc.
EMA is in a healthy spot with MACD and other important indicators ready to bounce up for the next big jump. TROY softened a little on the last BTC drop but not nearly as much as others like DENT, HOLO, etc., which points to some serious momentum up. This coin hasn't had the massive jump yet that other microcaps have and it's a 10 billion coin circulation not 100 billion like HOLO and others which means a much higher target price .
A few sources say whales have been accumulating. Trust the charts, not the "crowd wisdom" on this one and take your positions now...
Buying information for a very accessable exchange as well as financial disclaimer in the signature.
Good luck.


UNISWAP Targets 50$ RangeUniswap has been consolidating in an ascending triangle pattern. Breaking upwards, it will be targeting the 50$ mark which is also the fib 2.618 extension from the last swing high to swing low.
The low volume inside this triangle is a confirmation of a reaccumulating zone.
Uniswap mainnet V3 launch is scheduled for May 5 which could be the catalyst for the breakout when we reach closer to the apex.
Not financial advice


1Inch to $16-$22 - End of April! 245-350%+ RoiHello Traders,
Having 1inch get listed on Coinbase was a very exciting moment IMO.
I’ve been holding this one for a little while now and I wasn’t expecting this one to get listed anytime soon but it makes sense with all of the other similar projects like Sushi and Uniswap.
I can definitely see 1inch acting like Sushiswap did, I think it is entirely possible for 1Inch to hit a market cap of 2.5 Billon by the end of April.
Good luck!

UNI/USDT price action predictionUniswap needs to break the current small downtrend since early February to continue bullish momentum.
21EMA and 50EMA are getting closer to each other.
Moment of truth incoming.
We will need more confirmation before we know where we're heading

DeFi Summer 2Massive rotation from BSC/samcoins for DeFi Summer 2.
V3 fundamentals are still misunderstood and will pull liquidity from all other AMMs.

UNI have unlimited potential, Already up 2808.5% in 7 months !Today's analysis is about UNIUSDT on 1D timeframe.
UNI is the governance token for Uniswap , just like BNB is for Binance exchange. But UNI has shown about 2800% gains in just 7 months. Uniswap is a decentralized exchange (DEX) that makes it easy for users to swap an ERC-20 token for another ERC-20 token without the need of a centralized intermediary.
Let's talk about the analysis now.
It seems like UNI is range bound for now trading between $20 and $30, and accumulating further. We can see immediate support at about $25, as it has already tried to break the above range three times, hence Triple Top. I am using a ghost feed to show the price projection for both scenarios, if the price holds the immediate support level and breaks the immediate resistance, UNI is going to see another leg upward in the free zone. On the other hand, if price breaks the immediate support level, it might see a downtrend.
I have a bullish bias as I can see a hidden volume bullish divergence, and also MACD is flat but MACD line might crossover signal if volume increases.
Daily analysis gives long term trade ideas, where investors hold their positions for weeks or even months.
I would say, if it breaks the resistance with good volume and also if MACD line and signal line crosses over with a good percentage, it's a good idea to buy some UNI or go LONG on it.
Not a financial advise, DYOR and follow us for more ideas.
HAPPY TRADING

Downtrend The chart appears to be on a downward trend. The chart shows two important supports.
Lower support is drawn in the weekly timeframe, where it breaks its weekly ceiling in the weekly timeframe.

UNI one more drop?Hi traders!
We possibly can see one more drop before start of new bullish cycle for this DEX
🤓Trade safe

UNI BTC DailyUniswap needs to break the current small downtrend since early February to continue bullish momentum.
21EMA and 50EMA are getting closer to each other.
Moment of truth incoming.
We will need more conformation before we know where we're heading.

UNI/USDT still potential for $50 new update #UNI/USDT TA Update:-
$UNI currently trading at $29.7
And I told you to buy between $28-$31
Lower buy order also filled.
Entry:- $28-$31 ✅
Bounce back from strong support $28.
Still good entry zone.
Targets still same.
TP1:- $34.20
TP2:- $40.60
TP3:- $50.10
Why I posting this update now..?
Many messages received so Now I am posting again $UNI Update.
Don’t panic guys.
Support:- $28
Resistance:- $34.20/$40.60/$50.10
Please click LIKE button and Appreciate my hard work.
Must follow me for latest crypto real time updates.
Thank you.

Is Uniswap able to get back its ATH?We have a broken mid-term uptrend and as you see price dropped to the bottom of long-term ascending channel
If UNI could maintain in this ascending channel we expect to attack for its ATH
But if this channel broke , price will retrace to the strong support about 17$

Uniswap Boom ZonesWhen the Diagonal Lines (called Dynamic Resistances) collide with the Horizontal Lines (called Static Resistances) there is often a breakout boom.

#Uniswap - buy now at retest$UNI triangle broke, and retested as a support. buy now #UNI with a great R:R setup.
So many coins showing this breakout pattern, try and find the best that work for you and fundamentals are there to support the long term run.

All alts are mooning, what to buy?! UNISWAP!Update on my previous UNI review and now on a daily time frame.
In short; UNI has seen a big rally in anticipation for its V3 dex and consolidated from 36,6$ (ATH) to 25,3$.
Now, we are in alt mania days and a lot of alts already pumped so you dont wanna chase those, so which one still has a lot of upside potential?
In my opinion this is UNISWAP, why?
- MACD just (!) crossed on the daily
- RSI is healthy, nowhere near overbought; setting a higher low, aiming for a higher high
- UNISWAP V3 dex is coming at the start of May and the price will rally in anticipation to launch
- its alt mania; all alts are mooning and UNI is still catching up
- In case of a very strong rally we could hit 50$ and gain 60+% against the USD and minimum 25-30% against BTC.
I dont see any reason not be exposed to UNI but ofcourse make your own analysis.
You can check other alt coins that are ready to moon on my profile or with the links below.
IMPORANT: trade or invest at your own risk and research.

ALERT: Troy (TROY) crossing to a breakout.DeFi play TROY is a Smart Hybrid Asset Management System offering yield farming, fixed savings, a liquidity aggregator (for Binance, Huobi, OKex, Uniswap, Curve, Balancer), provider of arbitrage opportunities, etc.
Volume and other indicators show a significant trend upward for TROY. This is a low cap gem which may be the next to rise substantially.


EMA 50 supporting UNI for 100 daysI think it will be an uptrend in the daily chart but uni need some volume.
not financial advice!
good luck
