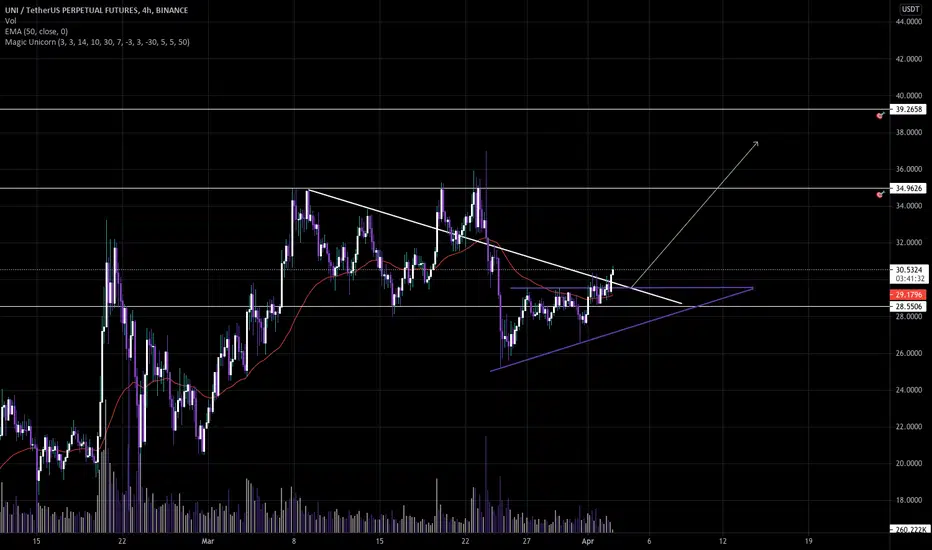
UNI potential next moves??UNI has been forming a nice triangle...
If it´s not too late we could see a breakout to new ATH...
We could also break down and pull back from the trend line...
- this is where I would be making a trade
If we break the trend line we could move to our last big support level around 20.
And also we could also see just consolidation out of the triangle just as ADA did last week.
With enough volume, we could break out... we also need to see what BTC does...
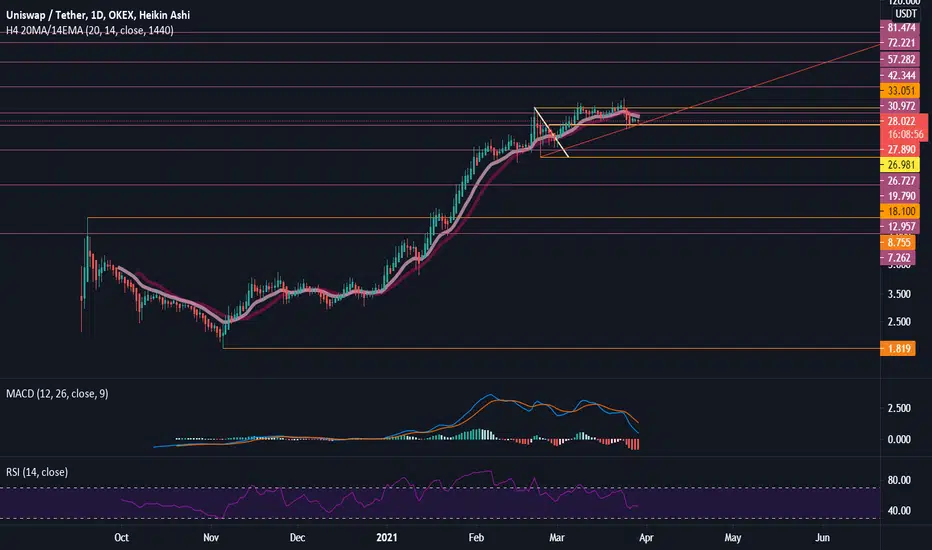
Uniswap

UNIUSDT_ TA _upcoming reistance & supportUNi has good support around $28 , if this support breaks the next support is at $24.25
My upcoming buy & sell targets:
Buy 1: $28.9 with SL : $27.4 & Buy 2: $24.50 with SL : 24.00
Sell targets : S1: 32.51 - 37.03 - 39.29
if you agree , then like my idea nd subscribe
Thanks

UNI/USDT now in profit and all buy bid filled now waiting for TP#UNI/USDT Update:-
$UNI $28-$31 bid filled and now in Profit.
Entry:- $29.50 ✅
Hope you not panicked yesterday and I also post messages don’t panic guys.
Hope you happy now.
Now Going to our 1st Target.
Support:- $28
Resistance:- $34/$40/$50
please click LIKE button and Appreciate my hard work.
Must follow me for latest crypto real time updates.
Thank you.

HEX 2.5 CENTS INCOMING!!!!! LIKELY PULLBACK, BEFORE LAUNCHING IF WE ASSUME A LOCAL TOP INCOMING @ 2.5
WE MAY HAVE A PULLBACK TO THE .618 RETRACEMENT
BEFORE TAKING OFF
THIS MAKES LOGICAL SENSE TO ME
AGAIN A PROJECTION IS THAT
A GUESSTIMATION!


A +$50 uniswap is not that far ... last call !!A huge potential in next days, I think a $50 uniswap will be in April.
Don't miss it !
✅ Buy: 27.40 - 30 ✅
🎯TARGETS:
1- $36.22 (21.26%)
2- $49.20 (64.41%)
💵 Trade Size: 5-7% of Portfolio
🚫Invalidation(SL): daily candle close below 24.20
Please click LIKE button and Appreciate my hard work.
Must follow me for latest crypto real time updates.
thank you

UNI/USDT ( Uniswap ) Ready for $50#UNI/USDT TA Update:-
$UNI currently trading at $31 and I am buying here because this is strong support level.
Entry:- $28-$31
Targets:- $34.2/$40/$50
Stop Loss:- I will update.
Now Trading at strong support level.
Support:- $28
Resistance:- $34/$50
Please click LIKE button and Appreciate my hard work.
Must follow me for latest crypto real time updates.
Thank you.

UNI: I'M Bullish But we need to Break $29.5 Resistance - TP1: 34BINANCE:UNIUSDT
UNIUSDT No Sitting on a Interesting Area
1. it's at the bottom area of daily ascending channel and did couple of Reactions to it and now bounced back from 50MA on daily
So basically it's ready to meet $34.5 area
but we're touching the $29.5 resistance area (Yellow box), this Static resistance now is aligning with 50MA and 200MA as dynamic resistances on 4H Chart So need to break it to Being Bullish on it
If that happens I'm going to enter
Targets Are: $34-$35 area (TP1) / $42 (TP2)
Stop-loss: any 4H Candle close below the yellow box
NOTE: I don't recommend Entering now but if you're going to, stop-loss would be any Daily Candle close below $26 (RED box)
Hope You Enjoy

We are approaching the green zoneOur resistance line is in the $ 30.88 area. If our brightly colored candles show the courage to move, we will enter the green zone. Green range $ 32.85 to $ 34.28. Do not forget the stop loss. 45% losses are always lurking in you.

UNI/USDT 🦄Hey hey my friends 👋
Uni looks like its wanting to take off, its alt-coin time anyways we are buying here 🦄
Uniswap (UNI) - April 3Hello?
Dear traders, nice to meet you.
By "following" you can always get new information quickly.
Please also ask for the "Like" clock.
Have a nice day.
----------------------------------
We must see if we can ascend above the 30.64308018 point.
If you decline at 28.83657176, you need a short stop loss.
If it falls in the 19.86829191-22.11036180 range, Stop Loss is required to preserve profit and loss.
The next volatility period is around April 8.
-----------------------------------
(UNIBTC 1D chart)
We have to see if we can rise above the 0.00053565 point and gain support.
If it is supported at the 0.00053565 point, it is expected to turn to an uptrend.
If it falls from the 0.00044983 point, a Stop Loss is required to preserve profit and loss.
--------------------------------------
If you look at the charts of most of the major coins, they are either rising near their previous highs or exceeding their previous highs.
These rises are expected to rise even more when the BTC price rises above 60K and moves towards 70K.
However, if the BTC price fails to rise to 60K, it is expected that it will eventually turn into a downtrend, so careful trading is necessary.
Currently, BTC is in the period of volatility, and the coin market is in the overheating zone.
In this market situation, if you enter along with rising prices, the rate of return may be negative.
The coin price is recording positive, but the yield of the coin I bought is negative.
Therefore, if you are not familiar with same-day trading or short-term trading, it is recommended to enter when the coin price declines and then moves sideways and shows support at some point.
-------------------------------------------------- -------------------------------------------
** All indicators are lagging indicators.
So, it's important to be aware that the indicator moves accordingly with the movement of price and volume.
Just for the sake of convenience, we are talking upside down for interpretation of the indicators.
** The wRSI_SR indicator is an indicator created by adding settings and options from the existing Stochastic RSI indicator.
Therefore, the interpretation is the same as the conventional stochastic RSI indicator. (K, D line -> R, S line)
** The OBV indicator was re-created by applying a formula to the DepthHouse Trading indicator, an indicator that oh92 disclosed. (Thank you for this.)
** Check support, resistance, and abbreviation points.
** Support or resistance is based on the closing price of the 1D chart.
** All explanations are for reference only and do not guarantee profit or loss on investment.
Explanation of abbreviations displayed on the chart
R: A point or section of resistance that requires a response to preserve profits
S-L: Stop Loss point or section
S: A point or segment that can be bought for profit generation as a support point or segment
(Short-term Stop Loss can be said to be a point where profits and losses can be preserved or additionally entered through installment transactions. It is a short-term investment perspective.)
GAP refers to the difference in prices that occurred when the stock market, CME, and BAKKT exchanges were closed because they do not trade 24 hours a day.
G1: Closing price when closed
G2: Cigar at the time of opening
(Example) Gap (G1-G2)


$UNIUSDT - Moves inside an uptrend channelHello everyone!
Uniswap looks bullish inside this uptrend channel.
It is testing the dynamic resistance as support now (bullish flag pattern) and is looking to break above the resistance at $30.
If that resistance is overtaken, it will jump towards $38

UNI usdt - break of the downtrend?Like Sushiswap, Uniswap experienced a pulldown off the back of the bitcoin drop.
Will we see a breakout this weekend?
Price above upturning EMA.

UNI: Coinbase IPO = UNI Target Price of $131Just want to put out a short Fundamental Value note on UNI
UNI is worth $131 considering the relative value of where Coinbase will list its IPO which looks to be at or above $68B in equity value alone.
UNI does very similar daily exchange volumes at nearly ~$2B / day relative to Coinbase and will likely surpass Coinbase in exchange volume in the next 30 days after UNI implements its major upgrade for efficiency and a later upgrade that will focus on reducing gas fees by May.
Public comps like this are god-given gift b/c the value will be visible to anyone and this will attract investors to UNI as it will be clear that it is massively undervalued at $14.5B market cap. If UNI were to trade more in-line with this public comp, that would equate to a price of $131 per UNI. Therefore my PT by the end of April is $131 .
Coinbase will list its shares mid-April.
Source: Coinbase puts its value for Nasdaq Listing at $68 Billion
Coinbase Global, the largest cryptocurrency exchange in the US by trading volume , has registered 114.9 million shares for a direct listing on the Nasdaq stock market.
The company, founded in 2012 by Brian Armstrong, who is the CEO, and Fred Ehrsam, said in a regulatory filing to the Securities and Exchange Commission that recent private transactions had valued the San Francisco-based business at around US$68 billion. The valuation is almost 53 times its revenue in 2020.
In the filing, Coinbase said its stock in the private market traded at a weighted average price of US$343.58 in the first quarter of 2021 to 15 March. In the third quarter ended 30 September, Coinbase’s stock traded at an average of US$28.83 per share for a valuation of US$5.3 billion. According to data platform PitchBook, Coinbase was valued at a shade over US$8 billion during its last private raising of funding in October 2018.

UNI: Coinbase IPO = UNI Target Price of $131Just want to put out a short Fundamental Value note on UNI .
UNI is worth $131 considering the relative value of where Coinbase will list its IPO which looks to be at or above $68B in equity value alone.
UNI does very similar daily exchange volumes at nearly ~$2B / day relative to Coinbase and will likely surpass Coinbase in exchange volume in the next 30 days after UNI implements its major upgrade for efficiency and a later upgrade that will focus on reducing gas fees by May.
Public comps like this are god-given gift b/c the value will be visible to anyone and this will attract investors to UNI as it will be clear that it is massively undervalued at $14.5B market cap. If UNI were to trade more in-line with this public comp, that would equate to a price of $131 per UNI . Therefore my PT by the end of April is $131.
Coinbase will list its shares mid-April.
Source: Coinbase puts its value for Nasdaq Listing at $68 Billion
Coinbase Global, the largest cryptocurrency exchange in the US by trading volume, has registered 114.9 million shares for a direct listing on the Nasdaq stock market.
The company, founded in 2012 by Brian Armstrong, who is the CEO, and Fred Ehrsam, said in a regulatory filing to the Securities and Exchange Commission that recent private transactions had valued the San Francisco-based business at around US$68 billion. The valuation is almost 53 times its revenue in 2020.
In the filing, Coinbase said its stock in the private market traded at a weighted average price of US$343.58 in the first quarter of 2021 to 15 March. In the third quarter ended 30 September, Coinbase’s stock traded at an average of US$28.83 per share for a valuation of US$5.3 billion. According to data platform PitchBook, Coinbase was valued at a shade over US$8 billion during its last private raising of funding in October 2018.

UNI Bullish IF we Break $29.5 ResistanceBINANCE:UNIUSDT
UNIUSDT No Sitting on a Interesting Area
1. it's at the bottom of daily ascending channel and did couple of Reactions to it and now bounced back from 50MA on daily
So basically it's ready to meet the median line of the channel ($34.5 area)
but we're touching the $29 resistance area (Yellow box), this Static resistance now is aligning with 50MA and 200MA as dynamic resistances on 4H Chart So need to break it to Being Bullish on it
If that happens i'm going to enter
Targets Are: $34-$35 area (TP1) / $42 (TP2)
Stop-loss: any 4H Candle close below the yellow box
NOTE: I don't recommend Entering now but if you're going to stop-loss would be any Daily Candle close below $26
Hope You Enjoy

UNI retest 20/22 $ Area?Possible rising wedge on the 4 hour chart. If we lose this wedge, can be possible a retest of the previous resistance on 20/22$ area?
Bearish on the short term.

SUSHI USDT false breakout? good time to buySUSHI is a fork of the Uniswap project. Token was moving in bullish trend, after a false breakout we'll see an obvious rise.

AAVE LONG BIG TIMEAAVE
Blue Chip DeFi token that just broke out from the bearish trend line.
I am personally expecting a major run up especially with Uniswap V3 launch nearing (which with Ethereum constitutes the holy trinity of DeFi imo)
On a more analytical perspective; the fact that the RSI crossed the 60’s level is good sign. We did actually cross all the EMA’s as well, so we can say that we are breaking out of the bear trend.
On the price expectations I would expect a first target around 415 $ at the resistance and second target around 480 $.
My strategy would be to buy a solid bag right now and take some profit at around 520$
Cheers

Uniswap (UNI) Ascending "Unicorn" Formation Before V3 May 2021I'm really liking this ascending triangle formation for Uniswap. We've held a beautiful bull trend line since January 11th and it is still holding nicely. This is only complimented by the fact that Uniswap will have a major upgrade to Version 3 sometime next month in May. This is very bullish news for the all the Uniswap holders out there and for anybody that uses the Decentralized Exchange.
Uniswap has proved to be one of the most important and significant cryptocurrency projects in this ecosystem holding a steady top 10 cryptocurrency position. It is the king of the DEX's. I believe we will continue to see increased adoption and liquidity grow on Uniswap throughout the year especially with the much anticipated upgrades with V3. I personally believe that probably won't see Uniswap under $30 much longer. However I'm no financial advisor. Much peace, love, health, and wealth.

$LABS tokenize real estate ($ETH Pair)1st of its kind, an announcement is being made on the 29th for LP Pairs, and on the 31st a bigger announcement is being made.
Price action sitting at midline, expecting to see a bounce off this level
