UNIUSDTHi my friend
This is my point of view. I would be happy if you follow me and leave your comment
BINANCE:UNIUSDT
Uniswap

UNISWAP about to turn bullishUNISWAP found a support where it made multiple rebounds during the past 48 hours. Price has formed a triangle which in my opinion is about to be broken to continue higher to my indicated targets.

UNI SHORT SIGNAL Hello dear traders
I hope you are well
In the uni currency, the price has hit the swing resistance level in the 15 and 30 minute time frames
Considering the decrease in momentum in the price of this currency, we can think about short positions
The loss limit and final profit limit are specified in the chart.
I hope you use this signal

Could UNI reach 11? I know its pretty optimistic setup, but technical picture looks pretty good and UNI haven't made any major bull trend since January 2022.
These are the few signs that telling me to go up.
1. RSI made Divergence already in 1W TF.
2. Checked 4.046 area twice and able to close candle above in 1W, 1M TF.
3. Now its checking 4.046 area third time.
4. Can not close the candle below red line in 1W and 1M TF.

Big Technical Alert on Uniswap (UNI)These technical data points can be extremely powerful
Its not a holy alert and can change in time too as the current monthly candle has not yet closed. That said the current data offers an interesting bit of potential and very worthy of getting a technical alert on.
When price is able to recover and reverse then the follow thru can be fast
Failed moves fail fast. This can be seen time and time again. Of course it too isnt holy but is a very powerful bit of technical data to look out for. As price recovers and the trend swings then people seem like they want to rush in and catch the changing tide.
Is this happening right now with UNI?
I cannot be sure Im still searching for that damn crystal ball. We interested understand that there can be a big move incoming and keeping an eye out for interesting opportunities that offer low risk can be part of the why were interested.
Keep an eye on how it develops
Could be a different set of circumstances tomorrow.. be like water to the changes in the flow (of data)


UNI SWING SIGNAL WITH TERIGER LONGHello again dear traders
UNI currency is located on a pivot support zone in high timeframes such as daily
Also, a decrease in sales momentum can be seen in the 12-hour time frame with an upward divergence
You can enter long trades with your own trading style with the entry trigger.
Thank you for your support
I would be happy if you could comment your opinion.

UNIUSD - Down Channel UNIUSD on this 4Hr chart is currently within a down channel
Some promise of recovery is possible along the green diagonal line if price decides to double bottom.
Until this happens we are stuck in a down channel.

#UNI/BTC 3D (Binance) Broadening wedge breakout and retestUniswap is pulling back to 50MA support and seems likely to bounce towards 200MA resistance.
⚡️⚡️ #UNI/BTC ⚡️⚡️
Exchanges: Binance
Signal Type: Regular (Long)
Amount: 6.0%
Current Price:
0.0002028
Entry Targets:
1) 0.0002002
Take-Profit Targets:
1) 0.0002669
Stop Targets:
1) 0.0001668
Published By: @Zblaba
CRYPTOCAP:UNI #UNIBTC #Uniswap #DeFi
Risk/Reward= 1:2
Expected Profit= +33.3%
Possible Loss= -16.7%
Estimated Gaintime= 3 months
uniswap.org

UNI goes downIt seems that we will have a fall to the specified support level by meeting the downward trend line.

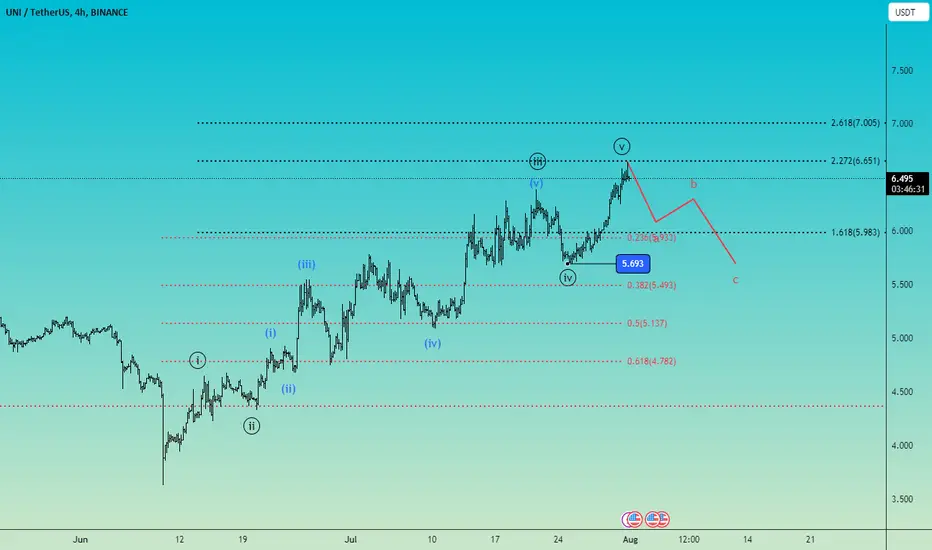
Uniswap intraday 4H, Elliott wave countAfter 5 waves to the upside expecting a correction for wave 2 that may keep the prior 4th wave pivot and than to continue up with a 3rd wave.
Future updates will be posted as updates to this count.
Daily intraday updates on 1H and 4H time frame, don`t miss them!!
Good luck!
UNIUSDTThe conditions of the BINANCE:UNIUSDT are as follows:
Over the past 50 days, we have witnessed an uninterrupted 85% price growth.
Most of the resistance lines we assumed for UNI turned out to be weak, and the price easily surpassed them.
However, now we are approaching the 0.786 Fibonacci retracement level, which is located at a price of $6.75. In my opinion, this point, or $7, could potentially lead the price back to $6, and then $5.30.
At the $6 price point, we have strong support. However, between $5.80 and $5.35, there is a fear value gap(FVG), which could guide the price to those points and cause a price drop.
Also, in the 4-hour timeframe, we are witnessing a divergence in the RSI (Relative Strength Index) indicator, which can be an initial signal of a trend reversal.
But we need to wait and see how the market reacts to the $6.75 price level.
Ultimately, everything depends on the overall market conditions.

UNIUSDTUniSwap is in a good position to sell, the first target is -6%, the second target is -14%.
good luck

good ideaBad idea when i should have bought but waited to get paid... within on month over 400% gains, im waiting for the drop to buy in for these insane gains. Seeing as how (Shiba) is in correlation with (BAD) we can expect a further upside but right now is a good time to short to buy a bit lower.

From Support to Surge: A Look at #UNIUSDT's Ascending Channel💎 Paradisers, the mid-term price action for #UNIUDT remains optimistic, as we continue to observe a pattern of higher highs and higher lows. What's more, #UNI has recently retested and rejected the vital demand zone near $5.7 for the third time in a row. It's evident that the bulls are holding their ground, and this could lead to a powerful surge shortly.
💎 We must also consider the bounce off the 50% Fibonacci retracement level, intriguingly situated right in the supply/demand area. Furthermore, #UNI continues to trade above the 200 Simple Moving Average on the 4H timeframe, once again displaying its bullish intentions.
💎 In terms of immediate resistance, the peak of the ascending channel could be the first area for profit-taking. However, if the price breaks above the channel with robust buying pressure, we could witness a much more potent trend in the upcoming weeks.
💎 Of course, this bullish outlook would be negated if the bulls fail to defend the demand zone, but as of now, #UNI appears quite bullish. Stay tuned for more updates and happy trading, Ladies and Gentlemen of ParadiseClub!

long UNIBME:UNI bounced off the ascending trendline. Bullish movement to resistance level at $6.64 is expected to happen.

Finally Breakout above the Descending Trend Line | New CycleWeekly Chart
UniSwap BINANCE:UNIUSDT was under the descending trend line, you can see that on Weekly Chart
Daily Chart
Last week, Uniswap has broken out resistance and now it's trading at 6.42x
Uniswap has support zones around 6.1
Wait a retest and join Defi's trend

Uniswap UNI price price is accelerating, how long will it last?It seems that in early June, the UNIUSDT price did manage to break out of the prolonged downward trend.
Well, we're keeping our fingers crossed that buyers will be able to accelerate the growth even more. Buyers have a "difficult path" ahead of them, as there are strong liquid zones above, where there will be many people willing to sell their UNI, which is lying around in their crypto portfolio and weighing it down with its price drop.
The first critical level from above is $7.50. This is where the first "serious struggle" between buyers and sellers will begin. The outcome of the battle will determine which route the UNIUSD price will take next - white or blue.
One way or another, the medium-term target, where we believe the price of the Uniswap token will sooner or later reach, is in the range of $12.25-13
_____________________
Did you like our analysis? Leave a comment, like, and follow to get more

short UNIBME:UNI broke through the ascending trendline. Decline to support level at $5.69 is expected to happen.

BUY UNIUNI appears to be a promising buy at the moment. If you decide to invest, consider holding it for potential long-term gains.

UNIUSDT: Potential Trend Reversal Amidst Breakout and Bounce.💎Recently, #UNIUSDT successfully broke out of the descending channel and surpassed the supply zone, confirming a shift in market dynamics. Subsequently, the price underwent a correction and achieved a clean bounce off the 61.8% Fibonacci support level, indicating a potential shift in the trend from bearish to bullish.
💎Currently, #UNI is positioned within the demand zone, which serves as a crucial starting point for the next upward swing and potentially significant price increase. To assess the potential upside, we turn to the Volume Profile and Fibonacci indicators, which highlight three key resistance levels to monitor. The nearest resistance lies approximately 20% above the demand level, while the final resistance is situated around 35% higher.
💎However, the realization of these gains hinges on the avoidance of a new lower low, specifically, a daily close below the critical support level at $4.74. It is important to note that the market may enter a consolidation phase, characterized by range-trading, lasting for another week or longer. While the probability favors an eventual upside move, Paradise Club Members must remain patient.

✴️ Uniswap Clear Bottom Signal, Long-Term Higher LowOk... Let me explain my thinking to you, my dear friend, behind this chart.
✔️ Fundamental analysis
Uniswap is a DEX and that's a point in favor.
Since all the CEX are under attack, people are starting to appreciate the benefits of DEX but that's not all, the chart is what really matters because fundamentals can be good and prices go down, fundamentals can be bad and prices go up; It is more based on market cycle rather than everything else.
But being a DEX is a point in favor specially in 2023 now that the Cryptocurrency market is 14 years old and growing.
Many people have experience and love to diversify, for security, for protection, for ease and peace of mind. Great choice, this is wise.
✔️ Technical analysis
The bottom signal is absolutely clear in June 2022 with the Inverse Head & Shoulders, or simply three drops before a recovery takes place.
Fast forward 1 year, the biggest attack in the history of Cryptocurrency and Uniswap produces a strong red candle 10-June and starts to recover right away.
In the past we had this complex recovery pattern, in the present we get a simple "v shape". The law of alternation once more.
We have multiple days green, straight up and a year long higher low.
Last year the June bounce lead to 193%.
Since we have a higher low in place, this time it can be better.
I want to buy this one with a bunch of X... If you can do it, make a plan and go ahead.
Namaste.

Uniswap outperforming today Uniswap is exhibiting exceptional performance today, showcasing a bullish breakout and setting its sights on reaching the 6.5 level. The probability of achieving this milestone significantly increases if we manage to surpass the critical threshold at 6.22. However, if we fail to maintain stability around the 6.0 mark, it would be wise to anticipate a support retest at the 5.7 level. NFA
