unity Long options octGap fill, uptrend
Should fly soon enough to 150 or more, maybe a pullback to the 129$ before the big run
UNITY

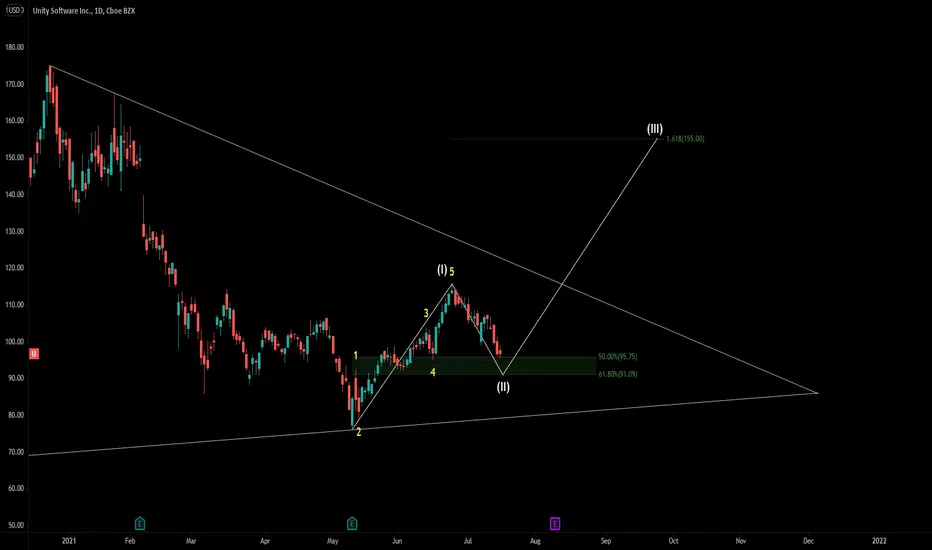
Unity Software in a bullish channel Unity Software is trading in a bullish channel. It has already completed 3 waves and should retrace to around $115, before it resumes its uptrend to $170-$180.
We are currently trading inside an ending diagonal of a fifth wave, which means we will have to retrace deep. TRIX , which is basically a modified MACD histogram, is flashing bearish divergence.
I have outlined the risk and reward for you on the chart. The yellow box is the end of the 4th wave and our target. Once our target to the down side gets hit, we should see run up to the blue box on top of the chart.
Good luck.

Another head & shoulders to look atNYSE:U is probably making the comback. With this head & shoulders I would buy the breakout above $115. Also the price is making a bullish divergence with the MACD but the price is still below the 200 day MA. I think it needs to break that level to actually start a good bull run. I'll be waiting.

Unity Ready for a Mini to Large Breakout50MA is about to catch the 200MA, and if Unity breaks 130, should be able to confirm uptrend to fill the gap above.
Unity made a higher low last Thursday before regaining momentum upwards.
RSI is holding above 50, still in an uptrend
MACD is positive still
4H chart shows hidden bullish divergence


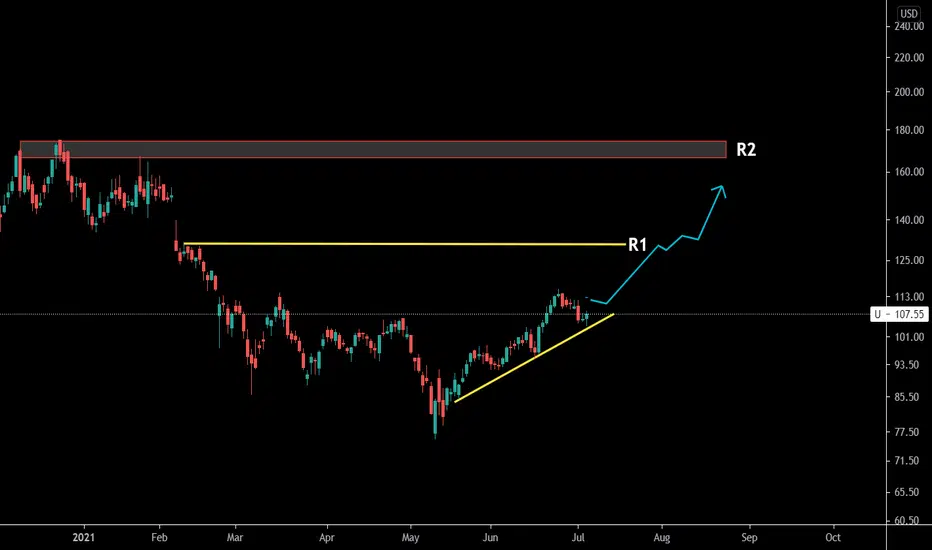
Boxes strategy. $U stock analysis. My plan.Here is my technical analysis of NYSE:U stock using my boxes strategy.
NYSE:U price has broken out of the box recently on great earnings news.
In 2 days it hit a long-term resistance and reversed down.
Price has bounced off of the box ceiling that has become support now.
I see two scenarious for further stock movement.
Scenario #1.
1. Price breaks the long-term resistence level.
2. It comes back to a strong demand zone (preferrably where box level meets the trend line).
3. Then we move higher.
Scenario #2.
1. Price does not break the long-term resistence level.
2. Stock price goes down and misses the demand zone.
3. We continue to move inside the box.
Remember, action at the demand zone of 115.50 is a crucial point to watch.
---------------------------------------------------------------------------------------------------
Disclaimer!!!
This is not financial advise.

Inverse H&S patternInverse H&S pattern
We've got the breakout with very good volume
###NOT FINANCIAL ADVICE###

Unity - Long Unity should end wave 2 soon between now and .618 fin zone. I would place my stop loss slightly under this and wave 3 PT would be 155 if we find a bounce within the .618 fib zone.
Unity/Snow Sequence Unity is following Snow in this sequence and Unity should Rip up this week. Have the 01/21/22 110C's and look to play Unity through earnings next month. GL!
(red) short term levels and (white) mid term levels
$Unity $Snow #Investing #Options #Stocks

Unity - Dropped hard, Coming Back Strong 💪-Unity was one of the stocks that had the biggest on its stock price during the recent tech recession.
-Now is the time for the come-back! Sit tight and enjoy the rise!

Unity $U formming a "low cheat"I usually have a number of stocks that I like because of the fundamentals, and I just wait for the technicals to do what I like. This time NYSE:U is doing it in a very good way. The price is not yet above its MAs but it has a strong divergence with the MACD and the ADX is below 20 points, all this while formming a "low cheat" which is like a mini "cup & handle" (I learned this reading Mark Minervini).
Normally the "cup & handle" pattern is one of the best reversal patterns, adding this with the other technical signals I think this stock is close to a buy point. Still, for my strategy this setup is high risk. I always wait for confirmation with a second base. IBD has NYSE:U in rank 7 in its industry, and a realtive stength rating of 37; not my usual stock.
The thing adding to my optimism is that breakouts have been working better for the last 2 weeks. I even missed a few stocks because I was being cautious. With this one I would add just half my position size and if it goes my way I'll add my full postion.


Unity's Squeeze-Price Inflection oscillation tied to EarningsPremise:
Convergence probably occurred before initial jump to ATH (not drawn)
2nd convergence noticeably begins around the time Momentum Squeeze kicks in for the buildup to Q4 earnings report.
Momentum at breakout was BEARISH, despite P/L changing in the positive direction (earnings much closer to estimate than in Q3)
If this performance holds up, Unity's stock should be competitive against established entities (see background: 700 and ATVI) in the gaming market which looks poised to resume an upward trend.
One Possible Scenario:
The last 2 weeks in March are showing the beginning of a 3rd convergence; will keep updating to see if this pattern holds up.
A new Squeeze indicator along with past experience suggests it will, crucially timed to the earnings release on May 6th.
The sine wave shown here in purple is not meant as a trendline projecting the stock's price level at some point in the future but is simply an extrapolation of past inflection points to identify at what point along the new growth curve the stock will be if and when Momentum breaks decisively in the positive direction.
My conclusion is that Unity will probably continue trading in its current range for some time, possibly even taking another downward turn this month as public sentiment on the stock has been increasingly bearish as its clear it isn't poised to rocket back to 150.
That would be the time to buy and hold, if the enthusiasm for Unity among developers is to be taken seriously, or at the very least, place your May-21 calls.

Unity Software AKA U has a great potential and RRThe current price bounced from 0.786 Fib level (Daily) and yet to fill the gap at $148 zone. In my opinion they are a long term buy. also broke the trendline plus double bottom on daily.
chart says it all, they do have earnings announcement in May.

$U - Unity: Beaten up, but determined to go LONGI like $U. I like the stock. But right now, it's getting beaten up. I'm looking to go long.

Unity might be a good entry now
Disclaimer, this is only for entertainment and education purposes and doesn't serve by any means as a buy or sell recommendation.
Personally I hold both long term long positions and occasionally short term short position, for disclosure purpose.


$U Time to long UnityUnity seems to have finished an a-b-c correction wave after earnings and seems to be on course to new highs. I wave 2 has been put in to the T of these fib levels, then we should see 180+ by the end of August/September.


LONG UExpecting bounce from extremely oversold weekly and daily levels. If stop breached, be prepared to catch new daily reversal on lower levels with a tight stop.

LARGE CAP - SOFTWARE - TECHNICAL - SOLID GAINER - Unity Tech $U U has been a very solid performer in my portfolio, and I think now is a great entry point!
Today Cathie Wood added 195k shares for ARKK. Her buy is a great alert as any. She owns about 5M~ shares across her ETFs.
FA:
- One of the 2 kings of animation software. Until Epic Games (Unreal Engine) goes public, U is basically a tech monopoly.
- ER in 83 days
TA:
- Nice support level, at 0.5 Fib
- Bottom of Bollinger
- Made morning star reversal candle
- MACD converging, signaling bullish reversal
- RSI oversold, U never stays at these levels for long
- Nice ratio Gartley
- Gap to fill to 150~
Bear scenario:
- Looks like it can possibly go down to 0.382 Fib levels depending on broader market conditions... around 106
Strategy:
- TP1: 150
- TP2: 175
- SL: 86
- RRR: 1.77
- Timeframe: 83 days
- Long term PT: 240+ EOY
The RRR isn't too great, but I post this because this is such a solid hold IMO. My friends and I all love this one. GL and Enjoy!
