UNI IS ON THE VERGE OF ANOTHER LEG-UPPlease support with your likes or comments if you find the video useful. Thanks!
UNIUSD

UNI failed Ascending Triangle BreakoutAfter failing to confirm an ascending triangle breakout, UNI painted a mini rising wedge and a head and shoulders pattern. The breakdown target of the head and shoulders is 27.94, and the breakdown target of the ascending triangle is around 25.3. I will wait for a confirmed breakdown of the ascending triangle to enter a short position.

UNI Ascending TriangleUNI is in an ascending triangle. Breakout upside target is 34.87, which is a ~13% long opportunity.

UNI rejected from major resistanceUNI analysis:
UNI get multiple rejection the major resistance of $29.4-$30.5 area. The local support area are $27 and $25.5 and the major support is $23-$23.6 area. There is also a double top formed at $30 resistance area. We may see a retest of lower support zone of $25.5 to get some fuel before going up. Wait for either the retest of support area or a breakout above the resistance area of $30.5 before opening a position.

Uniswap UNIUSD -1000% is near, Elliott wave + Triangle!- UniSwap looks very strong on the daily / weekly timeframe.
- On the chart we can spot an ABCDE triangle, that is currently breaking out!
- Due to my Elliott wave count, i am expecting next Impulse wave to the upside, which will be huge!
- Next profit target is 1:1 FIB trend-based fib extension.
- For expected duration of the trade, probability, stop loss, profit target, entry price and risk to reward ratio ( RRR ) - please check my signature below ↓
- If you want to see more of these ideas, hit "Like" & "Follow"!

UNI on the way to 30$Hi every one
UNI/USDT
UNI/USDT has formed a Double bottom pattern which means the price shall Increase soon and we must be patient because the pattern has not been broken yet, after the break out happens the price should reach around 30$(as much as the measured price movement).
summery:
-UNI/USDT is in a Double Bottom pattern (bullish pattern)
-Can Increase after the break out happens.
-It should reach around 30$
💎Traders, if you liked this idea or have your opinion on it, write in the comments, We will be glad.
Thank you for seeing idea .
Have a nice day and Good luck

I want to buy UNIUSDUNI is sitting bullishly above the 200MA as it is transitioning through 2.618
I want to buy some, lacking free capital
This is a great entry for a long position
Price can be observed breaking out of the blue circle (1.618)

UNI Reaches 60$ !What I see is that the Uni has a very strong resistance at $ 30.
But if this resistance is broken, it is possible that we will reach $ 60.
I will buy and Hold some in the $ 24 and $ 20 support for the long term and goals of 38-50-60
Note: If the $ 20 support is broken, we may fall to level 14 again

💡Don't miss the great buy opportunity in UNIUSD @UniswapTrading suggestion:
". There is a possibility of temporary retracement to the suggested support line (23.25).
. if so, traders can set orders based on Price Action and expect to reach short-term targets."
Technical analysis:
. UNIUSD is in an uptrend, and the continuation of the uptrend is expected.
. The price is above the 21-Day WEMA, which acts as a dynamic support.
. The RSI is at 69.
Take Profits:
TP1= @ 25.22
TP2= @ 28.72
TP3= @ 31.75
TP4= @ 36.55
TP5= @ 44.83
SL= Break below S2
❤️ If you find this helpful and want more FREE forecasts in TradingView
. . . . . Please show your support back,
. . . . . . . . Hit the 👍 LIKE button,
. . . . . . . . . . Drop some feedback below in the comment!
❤️ Your support is very much 🙏 appreciated!❤️
💎 Want us to help you become a better Forex / Crypto trader?
Now, It's your turn!
Be sure to leave a comment; let us know how you see this opportunity and forecast.
Trade well, ❤️
ForecastCity English Support Team ❤️

💡Don't miss the great buy opportunity in UNIUSD @UniswapTrading suggestion:
". There is a possibility of temporary retracement to the suggested support line (23.25).
. if so, traders can set orders based on Price Action and expect to reach short-term targets."
Technical analysis:
. UNIUSD is in an uptrend, and the continuation of the uptrend is expected.
. The price is above the 21-Day WEMA, which acts as a dynamic support.
. The RSI is at 69.
Take Profits:
TP1= @ 25.22
TP2= @ 28.72
TP3= @ 31.75
TP4= @ 36.55
TP5= @ 44.83
SL= Break below S2
❤️ If you find this helpful and want more FREE forecasts in TradingView
. . . . . Please show your support back,
. . . . . . . . Hit the 👍 LIKE button,
. . . . . . . . . . Drop some feedback below in the comment!
❤️ Your support is very much 🙏 appreciated! ❤️
💎 Want us to help you become a better Forex / Crypto trader ?
Now, It's your turn !
Be sure to leave a comment; let us know how you see this opportunity and forecast.
Trade well, ❤️
ForecastCity English Support Team ❤️

Uniswap UNIUSDT - Breaking out! Triangle + Elliott Wave- UniSwap is looking very strong on the daily / weekly timeframe.
- On the chart we can spot a ABCDE triangle, that is currently breaking out!
- Due to my Elliott wave count, i am expecting one more Impulse wave to the upside.
- For expected duration of the trade, probability, stop loss, profit target, entry price and risk to reward ratio (RRR) - please check my signature below ↓
- If you want to see more of these ideas, hit "Like" & "Follow"!

UNI 2H SupportUNI 2H support is at ~$21
Try to set some buy orders near the support zone
If UNI holds above the trendline,
the Take-Profit target would be $22.2, $23.8, and 25.2

UNIUSD $100Using this top cap indicator for UNI we can plot potential tops
Congruent with my other analyses suggesting an early 2022 end to the bull market, I think UNI will top out late 2021 to early 2022
At this point price will be around $100, which is provided using this indicator
Price now has triple bottomed on the lower blue band
I find this a great entry point for UNI
I am tempted to enter this once my capital allows it


Uniswap (UNI) - July 31Hello?
Welcome, traders.
By "following", you can always get new information quickly.
Please also click "Like".
Have a nice day.
-------------------------------------
(UNIUSD 1W Chart)
If the price is maintained above the 8.75010245-12.92996012 range, the uptrend is expected to continue.
(1D chart)
If the price is maintained in the 15.66272533-22.52822224 range, it is expected to turn into an uptrend.
If the price holds above the 22.52822224 point, it is expected to reorient itself in the 29.39371914-32.82646739 segment.
If it falls in the 12.22997708-15.66272533 section, it is possible to enter the mid- to long-term investment area, so careful trading is required.
--------------------------------------
(UNIBTC 1W chart)
If the price is maintained above the 35399 Satoshi-41575 Satoshi section, it is expected that the uptrend will continue.
(1D chart)
If the price is maintained in the 47297 Satoshi-58765 Satoshi section, it is expected that the upward trend will continue.
However, it should break out of the downtrend line.
If it falls in the 30094 Satoshi-35828 Satoshi section, it is expected to enter the mid- to long-term investment area, so careful trading is required.
------------------------------------------
We recommend that you trade with your average unit price.
This is because, if the price is below your average unit price, whether it is in an uptrend or in a downtrend, there is a high possibility that you will not be able to get a big profit due to the psychological burden.
The center of all trading starts with the average unit price at which you start trading.
If you ignore this, you may be trading in the wrong direction.
Therefore, it is important to find a way to lower the average unit price and adjust the proportion of the investment, ultimately allowing the funds corresponding to the profits to regenerate themselves.
------------------------------------------------------------ -----------------------------------------------------
** All indicators are lagging indicators.
Therefore, it is important to be aware that the indicator moves accordingly with the movement of price and volume.
However, for the sake of convenience, we are talking in reverse for the interpretation of the indicator.
** The wRSI_SR indicator is an indicator created by adding settings and options to the existing Stochastic RSI indicator.
Therefore, the interpretation is the same as the traditional Stochastic RSI indicator. (K, D line -> R, S line)
** The OBV indicator was re-created by applying a formula to the DepthHouse Trading indicator, an indicator disclosed by oh92. (Thanks for this.)
** See support, resistance, and abbreviation points.
** Support or resistance is based on the closing price of the 1D chart.
** All descriptions are for reference only and do not guarantee a profit or loss in investment.
Explanation of abbreviations displayed in the chart
R: A point or section of resistance that requires a response to preserve profits.
S-L: Stop Loss point or section
S: A point or section where you can buy to make a profit as a support point or section.
(Short-term Stop Loss can be said to be a point where profit and loss can be preserved or additional entry can be made through split trading. It is a short-term investment perspective.)
GAP refers to the difference in prices that occurred when the stock market, CME, and BAKKT exchanges were closed because they are not traded 24 hours a day.
G1 : Closing price when closed
G2: Opening price
(Example) Gap (G1-G2)

UNI Breakout Price Target $36.24UNI just broke out of this multi-month consolidation triangle. The measured move price target puts us at $36.24 - that's almost a 2x from where it stands now. Load up your bags!!

UNI is going to break this trend line? 😲Uni/Usdt, as well as Bitcoin, are up 18%, the price has now found local resistance at $20, you can also see there is a trend line, which is also resistance at the moment.
If the price starts squeezing towards the trend line and breaks it, it could be a good opportunity to buy, with the targets noted above.
But be careful, because the market is in limbo now, and a break-down of the trend line could be a trap.
Write in the comments all your questions and instruments analysis of which you want to see.
Friends, push the like button, write a comment, and share with your mates - that would be the best THANK YOU.
P.S. I personally will open entry if the price will show it according to my strategy.
Always make your analysis before a trade

UNIUSD Triple Bottom 1.618UNI has Triple bottomed on 1.618
This will very likely lead to a move higher due to the three rejections on the same level
Very good entry point right now

Uniswap: No breakout of its triangle yetDespite the latest rally, UNI touched its dynamic resistance only to pull back. UNI is still trading perfectly within its triangle. I'm trying to gather evidence about the hypothesis that this triangle (appearing on other crypto tokens as well) may turn out to be bearish. I'm still undecided because there's so much manipulation going on. Yesterday I was sure we had a clear bullish signal but the long wick and shooting start pattern on the daily is worrisome.

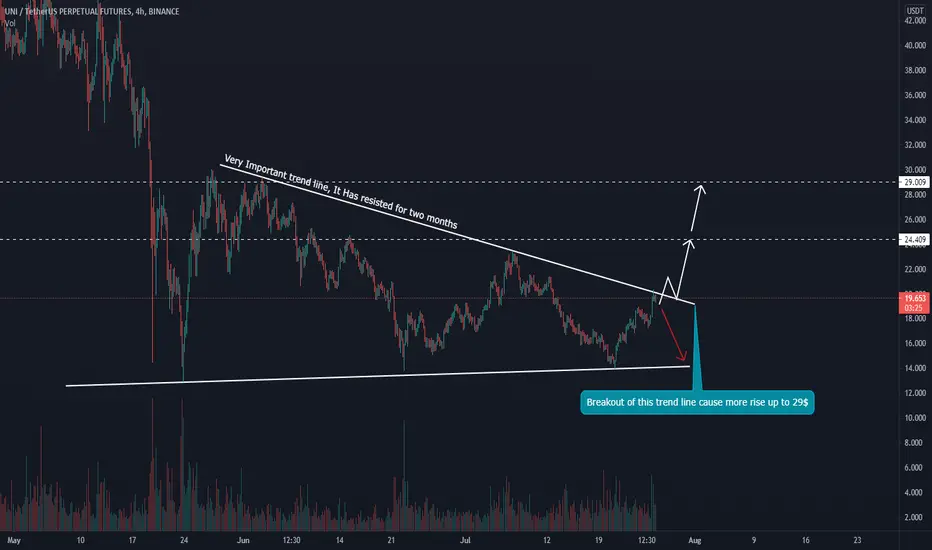
UNI is near an important trend line, Trading setupUNI is near an important trend line which is acting as resistance for two month.
Be ready if breakouts happen or even not!
Friends push like and write your questions here for me.
GOOD LUCK
Uni is going to break through this resistance zone 🤯After yesterday's rise in bitcoin, all altcoins also rebounded strongly, with Uni rising 20% to a resistance level of $16.88, before declining slightly.
The Uni is now declining near this resistance level, which is a signal for a breakout and continuation of the trend.
If the price breaks this level and tests it as support, it would be a good buying opportunity.
Write in the comments all your questions and instruments analysis of which you want to see.
Friends, push the like button, write a comment, and share with your mates - that would be the best THANK YOU.
P.S. I personally will open entry if the price will show it according to my strategy.
Always make your analysis before a trade

UNI 2H BUY and SupportUNI 2H support is at ~$16
Try to set some buy orders near the support zone
If UNI holds above the trendline,
the Take-Profit target would be $17.2, $18.5, and $19.8

