UNI: MOST Important Update - HASH RIBBONS CONFIRMED BUY! PT $387This is a significant day for UNI - UNI just posted a Hash Ribbons buy signal on April 25th and this is the most reliable buy signal in crypto.
The last time UNI posted this Hash Ribbons Buy signal was Dec. 21, 2020. Over the next 124 days, UNI returned 1000% or 11x to anyone who held over those 4 months.
Imho, this next 1000% return in UNI will take less than 124 days considering the bull market was just beginning in Q4 2020 and it takes time to start the compounding.
With V3 set to launch May 5th and EIP-1559 going into effect in July, you will want to be in for this ride... PT $387
Here is my last update on UNI prior to this:
UNIUSD

UNIUSDT (UNISWAP) Resistance Zone BreakoutUNIUSDT (1H CHART) Technical Analysis Update
Resistance zone breakout
UNI/USDT currently trading at $40.00
Buy-level: $39.00 - $40.00
Stop loss: Below $36.70
Target 1: $42.50
Target 2: $45.00
Target 3: $47.50
Target 4: $49.00
Max Leverage: 2X
ALWAYS KEEP STOP LOSS...
Follow Our Tradingview Account for More Technical Analysis Updates, | Like, Share and Comment Your thoughts.


Uniswap (UNI) - April 24Hello?
Dear traders, nice to meet you.
By "following" you can always get new information quickly.
Please also click "Like".
Have a good day.
----------------------------------
You should watch for any movement that deviates from 28.83657176-35.56287172.
In particular, it remains to be seen if it can rise along the uptrend line.
If you decline at the 30.64308018 point, you need a short stop loss.
However, you can touch 28.83657176 point and go up, so you need to trade carefully.
Therefore, you need to check the location of the closing price.
If it falls at 22.11036180, a Stop Loss is required to preserve profit and loss.
----------------------------------
(UNIBTC 1D chart)
61028 Satoshi-73062 Satoshi We must watch for any movement that deviates from the section.
In particular, you need to make sure you can get support at the 63445 Satoshi branch.
44983 Satoshi-48994 If you fall in the Satoshi section, you need Stop Loss to preserve profit and loss.
It remains to be seen if the bullish can continue within the bullish channel.
--------------------------------------
It is advisable to trade at your average unit price.
This is because if the price flows below your average unit price, which was on an uptrend or downtrend, there is a high possibility that you will not be able to earn a large profit due to the psychological burden.
The center of every trade starts with the average unit price you start trading.
If you ignore this, you may be trading in the wrong direction.
Therefore, it is important to find a way to lower the average unit price and adjust the proportion of the investment, so that the money that ultimately represents the profit can regenerate the profit.
-------------------------------------------------- -------------------------------------------
** All indicators are lagging indicators.
So, it's important to be aware that the indicator moves accordingly with the movement of price and volume.
Just for the sake of convenience, we are talking upside down for interpretation of the indicators.
** The wRSI_SR indicator is an indicator created by adding settings and options from the existing Stochastic RSI indicator.
Therefore, the interpretation is the same as the conventional stochastic RSI indicator. (K, D line -> R, S line)
** The OBV indicator was re-created by applying a formula to the DepthHouse Trading indicator, an indicator that oh92 disclosed. (Thank you for this.)
** Check support, resistance and abbreviation points.
** Support or resistance is based on the closing price of the 1D chart.
** All explanations are for reference only and do not guarantee profit or loss on investment.
Explanation of abbreviations displayed on the chart
R: A point or section of resistance that requires a response to preserve profits
S-L: Stop Loss point or section
S: A point or segment that can be bought for profit generation as a support point or segment
(Short-term Stop Loss can be said to be a point where profits and losses can be preserved or additionally entered through installment transactions. It is a short-term investment perspective.)
GAP refers to the difference in prices that occurred when the stock market, CME, and BAKKT exchanges were closed because they do not trade 24 hours a day.
G1: Closing price when closed
G2: Cigar at the time of opening
(Example) Gap (G1-G2)

Oh I want something just like this Terrible Coldplay song, but applicable.
Based off UNI's meteoric rise and extremely resistance support levels against BTC's dump leads me to believe we're going to see a $200+ UNI very soon.
The amazing thing is, a lot of the increase can be attributed to the technical fundamentals in UNI v3's launch.
Please, look it up. BNB? More like crapNB. Why use a Chinese centralised exchange with major vulnerabilities on its flagship chain when you can be on the ground floor of a decentralised Binance & its token?
Make your bets, I don't touch Binance related things. Crypto was meant to be decentralised, and so it will stay.
Love,
Jemkie 🦊
PS: Send UNI or ETH to my wallet xx :)
0x0008eb9764B45b7a7761eB747E1C6a5a55C9d6Ec

UNI closes the gap to $40 despite broad-based crypto retreats
Uniswap leads recovery in the market, posting incredible gains.
Breaking the resistance at $40 could bolster UNI to new record highs.
Uniswap has given a blind eye to the ongoing correction in the market to post double-digit gains over the last 24 hours. The decentralized finance (Defi) token is among the cryptocurrencies that managed to weather down the volatility in the market with ease since the beginning of the week. At the moment, Uniswap teeters at $36 while bulls focus on breaking above $40.
Before the breakout, Uniswap had settled on top of crucial support, highlighted at $30. A ranging channel controlled price action for a short period ahead of the ongoing bullish momentum. Several broken resistance levels set the precedence for the bulls to take control.
Meanwhile, all the short-term technical levels and indicate that bulls are comfortably in control. For example, the Moving Average Convergence Divergence (MACD) hints at the uptrend remaining intact in the short-term.
As the MACD crosses into the positive region, bulls are bound to tighten the grip on the trend. Moreover, the MACD line (blue) has crossed above the signal line, reinforcing the bullish outlook.
The Relative Strength Index (RSI) is leaning to the bullish camp after gradually recovering from the oversold area. Movement into the overbought region would encourage more buyers to join the market, pushing Uniswap beyond $40. Trading above $40 will also trigger the fear of missing out (FOMO), bolstering UNI toward $50.
Uniswap intraday levels
Spot rate: $36.8
Trend: Bullish
Volatility: Low
Support: 50 SMA, 100 SMA and $30
Resistance: $38 and $40


ichimoku trade : long positionin pullback to the ceiling with broke in tenkansen and kijunnsen cross.
buy position at 34.34$
stop loss: breaking the kijunsen

Rumor FUD Equals Extreme Dip Buying Opportunity in all CoinsJust a quick post here. There was a rumor spread about the Treasury and imho looking at the trading action on the 5 minute and 1 minute candles shows a story of how a large institution wasn't in BTC so they created FUD to buy the dip.
Notice I can't post on 5m candles b/c TV won't allow public ideas on small time frames but if you drill down on the 5m candle on Coinbase you will see there is an extremely large green volume candle at the exact bottom which coincides at the exact moment the momentum shifted in this rumor-led sell off . This large green volume candle looks like heavy institutional buying firepower - someone wasn't in btc and they wanted in and now they are.
This is your one time to buy the dip before the next move higher to $76.8k where we could see another shakeout
I highly suggest buying UNI /LINK h ere on this dip. UNI has some extreme near-term bullish catalysts when V3 is released May 5th... price will skyrocket up to and days / weeks after as this will set them as the supreme player in the entire market including relative to Coinbase or Binance once they introduce limit buying and many other additional features.

UNIUSDT- 1H COP (Change of Polarity) test
- 1H TD Sequential perfected buy setup.
- 1H possible latest entry for PB&J
- 1H Hammer
- 1D Pivots Target 3
- 1D EMA 8 support (?)
Entry: 36.4647
SL: 35.58
T1: 43
RR: 7.39


UNI updateOur Uni trade went beautifully. Now let's see where we can go from here.
- Consolidating at the ATH
- Confluence between .272 & .382 FIB
I expect it to consolidate here for a while & and after that at the $40 psychological level. After which we have a clear path towards the 1.618 FIB level that I drew on the last drawback on the daily chart. This puts us around $44.
How are you feeling this UNISWAP run?

UNI long opportunity- Bullish divergence on the RSI
- Came down to the support zone
- Overal bullish structure
Fundamental aspect: UNISWAP V3 launching this month.

UNI - 6h. Buyers have a great chance to test $34.7Once again, the range of $31.3-32.3 is becoming a serious problem for buyers of the UNI market. In the previous idea, we predicted a test of this range and the beginning of the 20th momentum of the fall with a target of $20:
The first part of our scenario worked well, but we had doubts about the second part. That's why we decided to create a new idea.
If we pay attention to the local wave of the fall , which began on March 24, we see that its correction was very long. To continue the wave of decline, sellers need to be more determined on March 31, when they tried to take control of the range of $26.4-27.4:
However, as we can see in the chart, buyers have clearly seized the initiative in the UNIUSDT market and are trying to gain a new position in consolidation to continue growing.
Today's fall in the price of UNIUSD took place within the local consolidation channel. Trading volumes do not resemble the impulse movement of the UNI price. Therefore, in our opinion, the movement in this channel will continue with the first goal of $34.7.
An alternative scenario may begin if the mark of $30.6 test is very weak. However, even this condition will not be enough. For our previous scenario and $20 to be tested by sellers, the new wave of Uniswap (UNI) falls should start with a $30.6 drop aggressively and at excessive volumes.
As long as BTC is above the range of $54200-54500 , there is no point in worrying. however, it is mandatory to closely monitor your positions.
________________________________
We create both short-term ideas (for a local understanding of the market situation) and medium-term forecasts of price movements.
Subscribe to us and get daily concise analytics!

Uniswap (UNI) - April 13Hello?
Dear traders, nice to meet you.
By "following" you can always get new information quickly.
Please also click "Like".
Have a good day.
----------------------------------
We have to see if we can get support at 37.80485161.
If it goes down, you need to make sure you get support at 35.56278172.
In particular, we need to see if it can rise along the uptrend line.
If it falls in the 19.86829191-22.11036180 range, Stop Loss is required to preserve profit and loss.
The next volatility period is around April 22nd.
------------------------------------
(UNIBTC 1D chart)
We must see if we can ascend above the 63445 Satoshi point.
If it falls, we need to make sure it is supported at the 61028 Satoshi spot.
44983 Satoshi-48994 If you fall in the Satoshi section, you need Stop Loss to preserve profit and loss.
The next volatility period is around April 20th.
-------------------------------------------------- -------------------------------------------
** All indicators are lagging indicators.
So, it's important to be aware that the indicator moves accordingly with the movement of price and volume.
Just for the sake of convenience, we are talking upside down for interpretation of the indicators.
** The wRSI_SR indicator is an indicator created by adding settings and options from the existing Stochastic RSI indicator.
Therefore, the interpretation is the same as the conventional stochastic RSI indicator. (K, D line -> R, S line)
** The OBV indicator was re-created by applying a formula to the DepthHouse Trading indicator, an indicator that oh92 disclosed. (Thank you for this.)
** Check support, resistance, and abbreviation points.
** Support or resistance is based on the closing price of the 1D chart.
** All explanations are for reference only and do not guarantee profit or loss on investment.
Explanation of abbreviations displayed on the chart
R: A point or section of resistance that requires a response to preserve profits
S-L: Stop Loss point or section
S: A point or segment that can be bought for profit generation as a support point or segment
(Short-term Stop Loss can be said to be a point where profits and losses can be preserved or additionally entered through installment transactions. It is a short-term investment perspective.
GAP refers to the difference in prices that occurred when the stock market, CME, and BAKKT exchanges were closed because they do not trade 24 hours a day.
G1: Closing price when closed
G2: Cigar at the time of opening
(Example) Gap (G1-G2)

UNI BREAKOUT: +25% / +45% ahead!UNI broke out of its symmetrical triangle + fliiped the 200MA from resistance into support; everytime it did that in the past (green circles) we saw a huge pump. After a long accumulation period, Uniswap is ready to break its ATH and begin a new price discovery. Big fractal is incoming! I was anticpating this for BNB many weeks ago; what happened? 0 interest, what happens now? People are FOMO into a fractal; this is stupid. You want to be before the pump! So you go: UNISWAP, V3 is coming soon. Check my first UNI and BNB updates, my BNB long started at 250$... see for yourself. BNB is closed case now, we move onto the next one. Against BTC; UNI can do +25% in the short term; the next weeks.
IMPORTANT: this is not financial advice, trade or invest at your own riks and research.

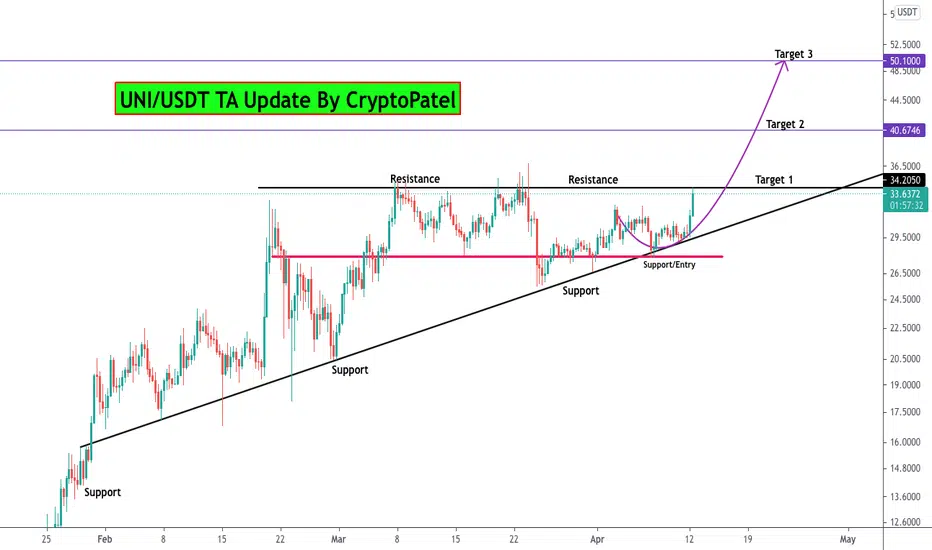
UNI/USDT first Target achieved but still my Target is $50#UNI/USDT current Update:-
$UNI currently trading at $33.40 and went upto $34.30
Our first Target achieved.
Entry:- $28-$30 ✅
TP1:- $34.20 ✅
TP2:- Pending
TP3:- Pending
Still I am expecting $50 $UNI soon
I am still holding for huge profit.
Major resistance is $35 if break out with good volume then next Target is $50
Support:- $30
Resistance:- $35 / Moon
Please click LIKE button and Appreciate my hard work.
Must follow me for latest crypto real time updates.
Thank you.
$UNI breaking out here$UNI just broke upward out of the wedge.
Very Bullish on RSI.
Great entry. This thing will run.


ETH broke the ascending triangle.The supply of ETH is continuously decreasing, suggesting the bear's strength has weakened.
eth also broke the Ascending Triangle
ready to go up. send 2800$


UNISWAP Targets 50$ RangeUniswap has been consolidating in an ascending triangle pattern. Breaking upwards, it will be targeting the 50$ mark which is also the fib 2.618 extension from the last swing high to swing low.
The low volume inside this triangle is a confirmation of a reaccumulating zone.
Uniswap mainnet V3 launch is scheduled for May 5 which could be the catalyst for the breakout when we reach closer to the apex.
Not financial advice

UNI next possible moves?So UNI has been forming this large triangle...
It has been forming a smaller one (blue line) but unfortunately, we broke down (as all ht crypto market).
It has hit double resistance and pulled back to lower prices...
What can happen now??
Well, we could go to the support lane and form a double bottom and see an incredible pump... (yellow)
We could also see an incredible volume and a movement north (green)
But there is always a bearish scenario... (red) we could break the resistance and fall down to a lower price...
Hopefully, we will see BTC moving up and other coins as well...
