UNI/USDT still potential for $50 new update #UNI/USDT TA Update:-
$UNI currently trading at $29.7
And I told you to buy between $28-$31
Lower buy order also filled.
Entry:- $28-$31 ✅
Bounce back from strong support $28.
Still good entry zone.
Targets still same.
TP1:- $34.20
TP2:- $40.60
TP3:- $50.10
Why I posting this update now..?
Many messages received so Now I am posting again $UNI Update.
Don’t panic guys.
Support:- $28
Resistance:- $34.20/$40.60/$50.10
Please click LIKE button and Appreciate my hard work.
Must follow me for latest crypto real time updates.
Thank you.
UNIUSD

UNI potential trade??UNI is in this nice triangle...
Right now it is forming a nice parallel channel.
I am expecting a break of this channel and a potential breakout from this triangle...
The short-term price target is 32.
It could also break down to the resistance... and go visit lower prices

Is Uniswap able to get back its ATH?We have a broken mid-term uptrend and as you see price dropped to the bottom of long-term ascending channel
If UNI could maintain in this ascending channel we expect to attack for its ATH
But if this channel broke , price will retrace to the strong support about 17$

#Uniswap - buy now at retest$UNI triangle broke, and retested as a support. buy now #UNI with a great R:R setup.
So many coins showing this breakout pattern, try and find the best that work for you and fundamentals are there to support the long term run.

All alts are mooning, what to buy?! UNISWAP!Update on my previous UNI review and now on a daily time frame.
In short; UNI has seen a big rally in anticipation for its V3 dex and consolidated from 36,6$ (ATH) to 25,3$.
Now, we are in alt mania days and a lot of alts already pumped so you dont wanna chase those, so which one still has a lot of upside potential?
In my opinion this is UNISWAP, why?
- MACD just (!) crossed on the daily
- RSI is healthy, nowhere near overbought; setting a higher low, aiming for a higher high
- UNISWAP V3 dex is coming at the start of May and the price will rally in anticipation to launch
- its alt mania; all alts are mooning and UNI is still catching up
- In case of a very strong rally we could hit 50$ and gain 60+% against the USD and minimum 25-30% against BTC.
I dont see any reason not be exposed to UNI but ofcourse make your own analysis.
You can check other alt coins that are ready to moon on my profile or with the links below.
IMPORANT: trade or invest at your own risk and research.

UNI: V3 in May | Next Target $40+UNI just had a cross up on the MACD on the 1D chart. Right now, it is stair-stepping up the trend line. As long as we hold above it, I could easily see this going to $40+ (conservatively) this month, especially with the launch of V3 in May.
This is not financial advice. These are just my ideas and opinions.

UNI potential next moves??UNI has been forming a nice triangle...
If it´s not too late we could see a breakout to new ATH...
We could also break down and pull back from the trend line...
- this is where I would be making a trade
If we break the trend line we could move to our last big support level around 20.
And also we could also see just consolidation out of the triangle just as ADA did last week.
With enough volume, we could break out... we also need to see what BTC does...

UNI/USDT now in profit and all buy bid filled now waiting for TP#UNI/USDT Update:-
$UNI $28-$31 bid filled and now in Profit.
Entry:- $29.50 ✅
Hope you not panicked yesterday and I also post messages don’t panic guys.
Hope you happy now.
Now Going to our 1st Target.
Support:- $28
Resistance:- $34/$40/$50
please click LIKE button and Appreciate my hard work.
Must follow me for latest crypto real time updates.
Thank you.

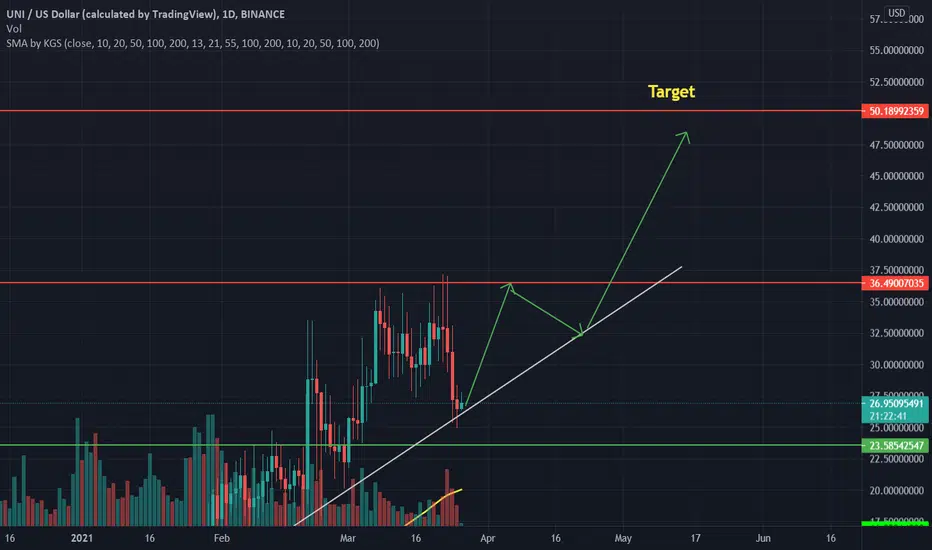
A +$50 uniswap is not that far ... last call !!A huge potential in next days, I think a $50 uniswap will be in April.
Don't miss it !
✅ Buy: 27.40 - 30 ✅
🎯TARGETS:
1- $36.22 (21.26%)
2- $49.20 (64.41%)
💵 Trade Size: 5-7% of Portfolio
🚫Invalidation(SL): daily candle close below 24.20
Please click LIKE button and Appreciate my hard work.
Must follow me for latest crypto real time updates.
thank you

UNI/USDT ( Uniswap ) Ready for $50#UNI/USDT TA Update:-
$UNI currently trading at $31 and I am buying here because this is strong support level.
Entry:- $28-$31
Targets:- $34.2/$40/$50
Stop Loss:- I will update.
Now Trading at strong support level.
Support:- $28
Resistance:- $34/$50
Please click LIKE button and Appreciate my hard work.
Must follow me for latest crypto real time updates.
Thank you.

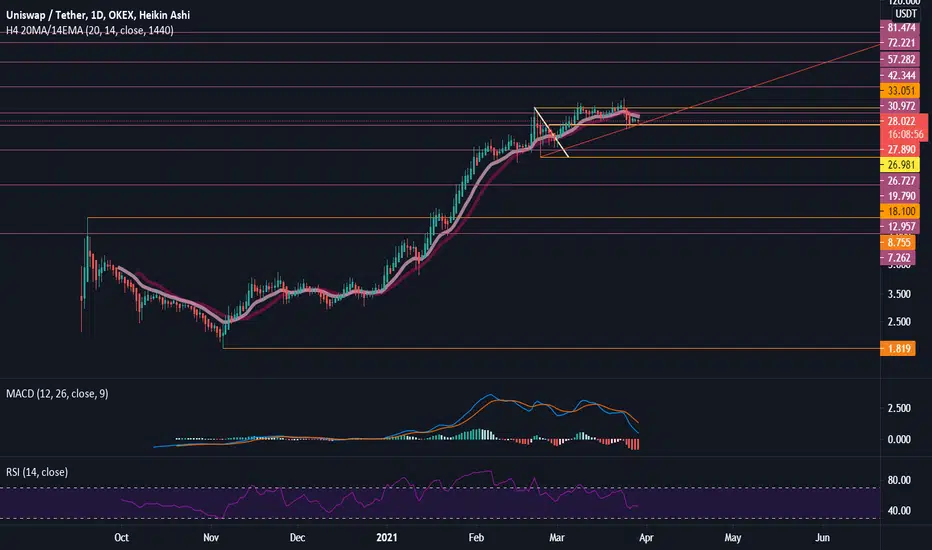
Uniswap (UNI) - April 3Hello?
Dear traders, nice to meet you.
By "following" you can always get new information quickly.
Please also ask for the "Like" clock.
Have a nice day.
----------------------------------
We must see if we can ascend above the 30.64308018 point.
If you decline at 28.83657176, you need a short stop loss.
If it falls in the 19.86829191-22.11036180 range, Stop Loss is required to preserve profit and loss.
The next volatility period is around April 8.
-----------------------------------
(UNIBTC 1D chart)
We have to see if we can rise above the 0.00053565 point and gain support.
If it is supported at the 0.00053565 point, it is expected to turn to an uptrend.
If it falls from the 0.00044983 point, a Stop Loss is required to preserve profit and loss.
--------------------------------------
If you look at the charts of most of the major coins, they are either rising near their previous highs or exceeding their previous highs.
These rises are expected to rise even more when the BTC price rises above 60K and moves towards 70K.
However, if the BTC price fails to rise to 60K, it is expected that it will eventually turn into a downtrend, so careful trading is necessary.
Currently, BTC is in the period of volatility, and the coin market is in the overheating zone.
In this market situation, if you enter along with rising prices, the rate of return may be negative.
The coin price is recording positive, but the yield of the coin I bought is negative.
Therefore, if you are not familiar with same-day trading or short-term trading, it is recommended to enter when the coin price declines and then moves sideways and shows support at some point.
-------------------------------------------------- -------------------------------------------
** All indicators are lagging indicators.
So, it's important to be aware that the indicator moves accordingly with the movement of price and volume.
Just for the sake of convenience, we are talking upside down for interpretation of the indicators.
** The wRSI_SR indicator is an indicator created by adding settings and options from the existing Stochastic RSI indicator.
Therefore, the interpretation is the same as the conventional stochastic RSI indicator. (K, D line -> R, S line)
** The OBV indicator was re-created by applying a formula to the DepthHouse Trading indicator, an indicator that oh92 disclosed. (Thank you for this.)
** Check support, resistance, and abbreviation points.
** Support or resistance is based on the closing price of the 1D chart.
** All explanations are for reference only and do not guarantee profit or loss on investment.
Explanation of abbreviations displayed on the chart
R: A point or section of resistance that requires a response to preserve profits
S-L: Stop Loss point or section
S: A point or segment that can be bought for profit generation as a support point or segment
(Short-term Stop Loss can be said to be a point where profits and losses can be preserved or additionally entered through installment transactions. It is a short-term investment perspective.)
GAP refers to the difference in prices that occurred when the stock market, CME, and BAKKT exchanges were closed because they do not trade 24 hours a day.
G1: Closing price when closed
G2: Cigar at the time of opening
(Example) Gap (G1-G2)

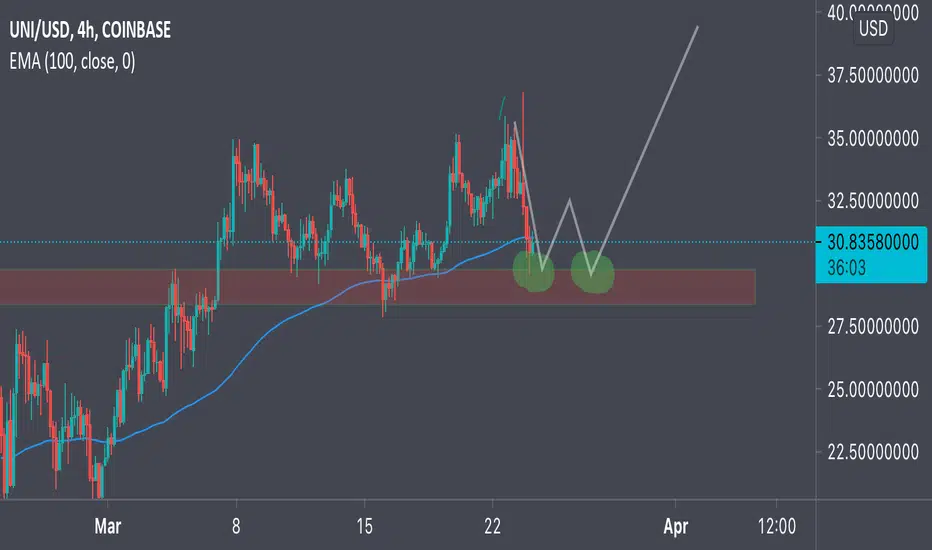
$UNIUSDT - Moves inside an uptrend channelHello everyone!
Uniswap looks bullish inside this uptrend channel.
It is testing the dynamic resistance as support now (bullish flag pattern) and is looking to break above the resistance at $30.
If that resistance is overtaken, it will jump towards $38

UNI: Coinbase IPO = UNI Target Price of $131Just want to put out a short Fundamental Value note on UNI .
UNI is worth $131 considering the relative value of where Coinbase will list its IPO which looks to be at or above $68B in equity value alone.
UNI does very similar daily exchange volumes at nearly ~$2B / day relative to Coinbase and will likely surpass Coinbase in exchange volume in the next 30 days after UNI implements its major upgrade for efficiency and a later upgrade that will focus on reducing gas fees by May.
Public comps like this are god-given gift b/c the value will be visible to anyone and this will attract investors to UNI as it will be clear that it is massively undervalued at $14.5B market cap. If UNI were to trade more in-line with this public comp, that would equate to a price of $131 per UNI . Therefore my PT by the end of April is $131.
Coinbase will list its shares mid-April.
Source: Coinbase puts its value for Nasdaq Listing at $68 Billion
Coinbase Global, the largest cryptocurrency exchange in the US by trading volume, has registered 114.9 million shares for a direct listing on the Nasdaq stock market.
The company, founded in 2012 by Brian Armstrong, who is the CEO, and Fred Ehrsam, said in a regulatory filing to the Securities and Exchange Commission that recent private transactions had valued the San Francisco-based business at around US$68 billion. The valuation is almost 53 times its revenue in 2020.
In the filing, Coinbase said its stock in the private market traded at a weighted average price of US$343.58 in the first quarter of 2021 to 15 March. In the third quarter ended 30 September, Coinbase’s stock traded at an average of US$28.83 per share for a valuation of US$5.3 billion. According to data platform PitchBook, Coinbase was valued at a shade over US$8 billion during its last private raising of funding in October 2018.


UNI - 6h. The market decline is not over yet - we expect a $20Yesterday's continuation of the fall in the BTC market provoked other coins to similar actions. The fall in the UNI price by 15% is an unpleasant event that indicates the weakness of the coin. Of course, almost all coins have been corrected. However, if UNI and DOT fell heavily, then BNB and FIL coin charts look much better.
A large number of sellers of this coin became noticeable when the UNI price tried to break through $34.6. After the first drop in the BTC price on March 22-24, the UNI market looked one of the strongest. The price practically did not drop for BTC and buyers launched a counterattack. But the buyers failed to gain a foothold above the mark of $34.6 even for an hour:
The last attempt of buyers to gain a foothold above this level ended with a sharp response from sellers, and led to a strong fall in the price of UNIUSDT .
At the moment, the UNI market fall looks like it is not over yet. Buyers managed to keep the range of $26.3-27.2. However, the main volumes formed in the range of $31.2-32.2. Notice where the UNI price stopped during an aggressive buyer's attack
In our opinion, this range is a sales area . If buyers fail to take control of this range during the next counterattack, we will expect a new wave of decline to $20.
It is at this mark that two trend lines intersect:
In addition, the last strong consolidation in the period from January 30 to February 20 is located exactly at the $ 20 mark. The cryptocurrency market has changed. Therefore, in incomprehensible situations, it is better to observe longer.
_____________________________
We create both short-term ideas (for a local understanding of the market situation) and medium-term forecasts of price movements.
Subscribe to us and get daily concise analytics!

UNISWAP updateUNISWAP v3 announced.
Price is respecting critical support levels after completing double top.
We can possibly see a double bottom forming if support and 100 ema level hold strong.
One More Shot to Grab More Uniswap at $32 Before It MoonsBuy Zone: $31.80-32
We will likely see one more bounce off the support and then it's new ATHs and this thing will have legs.
I expect it to run all the way to the parallel trend line with little resistance.
I'm not planning to sell any of this for a while. It's about to go on a tear when v2 release is announced.
Stock up next dip down and then go have the best day ever!

UNI: LaunchUNI is very close to passing the previous ATH. If it passes $35 and holds above it, I wouldn't be surprised to see $40 - $50 soon.
*** NOT FINANCIAL ADVICE ***

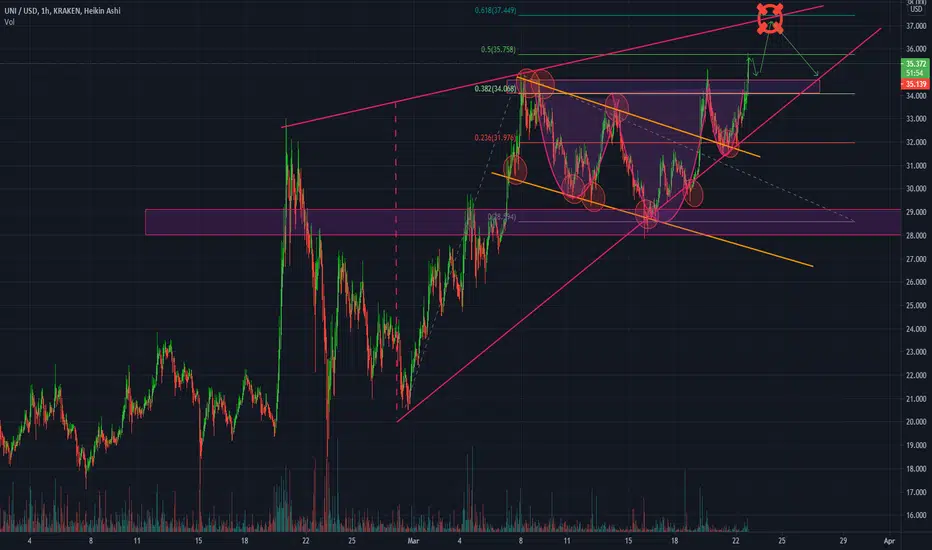
rising wedge uniswap taking some profits on the 0.618 fib extension. If this rising wedge forms it may lead to a breakdown

UNISWAP (UNIBTC) Breakout Long TradePair UNIBTC
Direction Long
Entry 0.00060537
SL 0.00058850
TP1 0.00061127
TP2 0.00061634
TP3 0.00062055
TP4 0.00062561
Signal Rating 3/5
DISCLAIMER: I am NOT a financial advisor and this post is NOT financial/investment/trading advice. I am simply sharing what I am doing, and I will not be responsible for any actions you take based on the analysis and comments that I provide. The cryptocurrency market is extremely volatile, and you WILL lose all your money if you are inexperienced! DO NOT risk any money that you cannot afford to lose and always be cautious and manage your risk!
What are your thoughts? Please leave your ideas and analysis in the comments below! Do give the post a like and a follow.
