Unisusdt March better month for traders or?
This ones been coiling at resistance for like a month now
Should break accumulation sooner or late if it breaks decentralised perpetual protocols should also do very well
Gmx dydx perp and inj are the ones I’m watching
In that order
Dydx has the highest volume and gmx hast the smartest staking mechanism with fees payed out in eth to stakers
Both should outperform from here to 2024
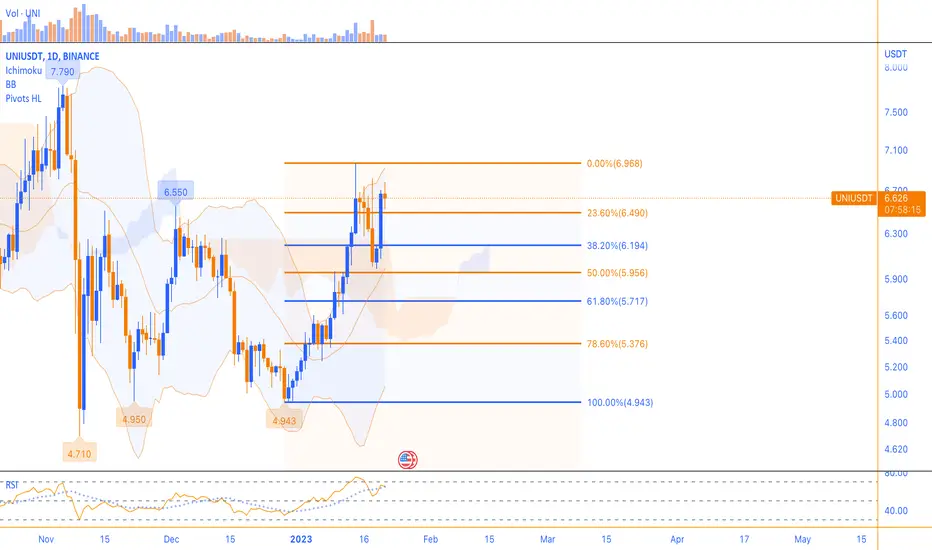
Uniusdt

$UNIUSDT: Uniswap trend reversal spotted Looks like Uniswap finally triggered a bullish trend signal here. I think it's likely a good position to have, specially considering the recent regulatory noise.
Best of luck!
Cheers,
Ivan Labrie.

#Uniswap inside a Rising Wedge, Support At $6.2Past Performance of Uniswap
Uniswap prices are within a rising wedge, consolidating, as visible in the daily chart. The uptrend is valid despite bears having the upper hand in the past few days. Still, traders should watch out for how prices perform. If UNI drops below $6.2, there could be more short- and medium-term losses. Conversely, gains above $7.4 and the expanding wedge may pump Uniswap bulls.
#Uniswap Technical Analysis
UNI is trending, consolidating within an expanding wedge. Overall, sellers appear to be resisting attempts higher. However, with UNI consolidating horizontally, soaking selling pressure, buyers stand a chance. In the days ahead, the primary support lies at $6.2, while resistance is $7.4. Conservative traders can wait for a breakout, aware that losses below $6.2 may see UNI retest at $5. Conversely, any surge above the $7.4 to $7.6 resistance zone may trigger demand, lifting the token to August 2022 high of around $9.6.
What to Expect from #UNI?
Presently, UNI prices are consolidating inside the expanding and rising wedge. There are clear resistance and support levels. However, since there appears to be accumulation, the best course of action is to wait for a high volume break out in either direction before riding the emerging trend.
Resistance level to watch out for: $7.4
Support level to watch out for: $6.2
Disclaimer: Opinions expressed are not investment advice. Do your research.

The bottom of the ascending channel has yet to be brokenOver the past week, UNI has continued its price growth within an ascending channel and has shown a strong negative reaction by hitting an important resistance in the $7.62-$8.
The bottom of the ascending channel has yet to be broken, and due to the solid retracement for this dynamic support, the possibility of breaking this range has increased.
More power is still in the hands of buyers. But if the bottom of the channel is broken, the first valid support is $6.56 to $6.67, and the second support is $5.95 to $6.11. The weekly timeframe candles show that as long as the second support holds, there is potential for another strong up move.
The closest near-term support to the current price is $7-$6.96, which exactly overlaps with the bottom of the long-term ascending channel. So the continuation of the price trend depends on how to react to this range.

UNISWAP Weekly View - February 2023Hello Guys, Weekly Analysis is on the UNIUSDT Symbol in a 4H Time frame, I Hope it Will be Useful for You, Don't Forget to Like, Follow, Comment

UNI : INCREASE VIEWUNI showing depending on low time frame increase view.
we will follow this coin to check the trend out.
🌠We will monitor UNI to see if it shows any upward movement in the lower time frames. If the trend looks promising, we will continue to track it beyond the initial 24-hour period
🗝UNI have good chance to breakout if the trend keep going in trend volume


UNIUSDT Elliott Waves AnalysisHello friends.
Please support my work by clicking the LIKE button👍(If you liked). Also i will appreciate for ur activity. Thank you!
Everything on the chart.(update)
Nothing has changed from my last idea,everything is relevant.
Targets: 7.5 - 10 - 12
Main Target zone: 12 - 15$
after first target reached move ur stop to breakeven
Stop: agreesive 4.8, conservative 3.4 (depending of ur risk). ALWAYS follow ur RM .
Risk/Reward: 1 to 10
risk is justified
Good luck everyone!
Follow me on TRADINGView, if you don't want to miss my next analysis or signals.
It's not financial advice.
Dont Forget, always make your own research before to trade my ideas!
Open to any questions and suggestions.

UNISWAP Weekly View - February 2023Hello Guys, Weekly Analysis is on the UNIUSDT Symbol in a 4H Time frame, I Hope it Will be Useful for You, Don't Forget to Like, Follow, Comment


UniusdtLooks very similar to dydx accumulation zone pre breakout
Largest volume dex by far the 1st and still the best

UNISWAP Weekly View - February 2023Hello Guys, Weekly Analysis is on the UNIUSDT Symbol in a 4H Time frame, I Hope it Will be Useful for You, Don't Forget to Like, Follow, Comment

#Uniswap in a Rising Wedge, Support At Dec 2022 Highs at $6.5Past Performance of Uniswap
Uniswap prices may be wavy, moving in a mix of up and down bears, but the uptrend is clear. Buyers are in control, trading above December 2022 highs of around $6.5. In the days ahead, traders should track how prices react at support, the $6.5, and the middle BB, the 20-day moving average. Sharp gains above yesterday's highs at $7.5 will see UNI climb above November 2022 highs, reversing losses.
#Uniswap Technical Analysis
The path of least resistance is northwards for UNI. Though prices are wavy with bear and bullish bars in the mix, it is until the coin breaks above $7.5 that conservative traders can accumulate. For now, prices are inside a rising wedge, supporting optimistic bulls. Aggressive traders can buy the dips as long as the coin trades above $6.5, targeting $7.5, and later $9.5, if buyers step up in a bullish continuation formation. If not, losses below $6.5 may see the token drop to $6 and $5.5 in an inevitable correction.
What To Expect From #UNI?
Buyers could be firm, but the uptrend will be more solid should a convincing, high volume close above the rising wedge. In that case, UNI may rally to $9.5 as buyers double down.
Resistance level to watch out for: $7.5
Support level to watch out for: $6.5
Disclaimer: Opinions expressed are not investment advice. Do your research.

UNIUSDT Good Buy!UNIUSDT Technical analysis update
Buy zone: Below $7.05
Stop loss: $6.20
Take Profit 1 : $7.70
Take Profit 2 : $8.70
Take Profit 3 : $10.25
Take Profit 4 :$12.00
Always keep stop loss

UNIUSDT consolidation is onUNIUSDT is at the top of the range, which should start inviting short-term sellers. A 10% drop can easily take place unless a new HH is produced.

Uniswap In tight range Formed Symmetrical Triangle In Daily Timeframe
Incase Of Breakout Expecting Move Towards (13 -14 Area )

UNISWAP Weekly View - JANUARY 2023Hello Guys, Weekly Analysis is on the UNISWAP Symbol in a 4H Time frame, I Hope it Will be Useful for You, Don't Forget to Like, Follow, Comment

UNI ready to explode?Hello everyone, today we have #UNI Coin Analysis
It got on our Watch List back in June during the rebound of the market, as it grew stronger than the market. After that, UNI held up just as well during the #FTX scam.
We were able to hold the $5 level and now we are above all the moving averages
#Bitcoin and the entire market in general are looking very strong right now, but we would first expect a good growth in Ethereum and then UNI
Potential Targets $7.5 and $9.5

The possibility of continuing the range trendAs long as the support level of $6.19 is maintained, the potential for a reversal in the daily timeframe will again be provided. The 4-hour time trend will not be bearish as long as this support is held. Due to the high strength of both ranges, the probability of the range trend continuing this week is high. If the strong candle closes above resistance without an upper shadow, the next target will be at $7.5 - $8 area.
UNI viewNFA, DYOR.
This is UNIUSDT on 4H timeframe.
We had an impulsive wave down on PPI data release, that broke the support ascending trendline.
Now we are forming a bearish flag under it, and if it breaks down, as expected, it could quickly go to a measured level down; red box below.
We already took the range high, so lower levels are expected for now.
Stay safe.

UNISWAP the last chance (bottom) and the range market 📖💡👌Hello 🐋
Based on the chart, the price is close to the major support (bottom) or better to say the previous zone that started its amazing pump to the upside ✔️
we
expect to see gain besides the range market is acceptable scenario too 📖💡🚀
and
if the price break the rang area to the upside, we will see more gain 🚀
👌 Notice: pay attention to the price on shortcut chart (located above the main chart with black colour) 📖💡
Please, feel free to share your point of view, write it in the comments below, thanks 🐋

UNI Breakdown!KUCOIN:UNIUSDT
Since posting a few days ago, UNI ran +25% and started to print a flag that developed into a descending triangle.
After the "liquidity run" (see 1-hour) I entered on 5m in the yellow dotted zone for a quick short and ~9%.
PLAN NOW:
1. Bearish Retest of Triangle could provide a further SHORT opportunity to the white pullback zone as a possible target.
2. If the price breaks back into the Descending Triangle look to LONG trapped bears.
This market is dynamic and with patience you can execute laser moves.
As usual Bitcoin rules the direction.
If you liked this idea or if you have your own opinion about it, write in the comments.
The information and publications are not meant to be, and do not constitute, financial, investment, trading, or other types of advice or recommendations.

XMR/USD - Monero: Bearish FlagThere is a symmetrical triangle developing, the price breaks out soon. A symmetrical triangle can be thought of as a specific chart indicator that typically signals a move down once price breaks through the support. There is a probability of a rangebound towards the 6.2 zone on a breach of 6.3.
