UNI UPDATEI think UNI has been an easy chart to guess and follow so far.
As I suggested in my previous update - after losing the trendline and the support at $8ish area. Price retested the area and gave a perfect entry for a short. (hope someone out there took the chance to make some money on this)
Now approaching another strong support area around $6.2 - $6.5. I'de be keen to see the reaction there. I think it would be a nice opportunity to long. Possible target around $8 again. Bu I would keep an eye open until price moves over $7.3
Lose the &6.2ish and price is going to the next level of support.
Obviously keep and eye on the big guy BTC to see how things are going.
As the decline started to possible new lows, we want to see LH and LL forming.
if you decide to long.. USE STOP ORDER! always play safe! ;)
DO NOT FOLLOW MY MOVE BEFORE YOU DO YOUR OWN RESEARCH, THIS IS AN IDEA - NOT A FINANCIAL ADVICE!!
Uniusdt

UNI UPDATETrying to figure it out?? yeah me too..
So it's all relevant to what the big guy BTC will do.
Price is nicely moving within the range for the last few days.
Some really good opportunities for scalping there. Did you take advantage of this so far?? ;)
As we are approaching the range low again it is important to see if the price will bounce. Break the low and lose the trendline and we are probably heading to the next line of support i.. (if you want to short wait for confirmation)
if price starts moving up keep an eye on the EQ and then range high.. No idea if it will go for another heigh or double top. Will have to wait and see. TBH UNI is looking a bit tired in comparison to other alts but who knows.. (if you want to go long keep an eye on BTC as well before you jump in).
Price action has been really bad today... be cautious
Do not follow my moves before you do your own research, This is an ideas not a financial advice.. Play Safe!!

UNI USDT Graph Update 30% down from our mentioned area. More Down movement Expected let's see How it's going to end🥳
Make awesome Profit from here
UNIUSDT can go higher after the breakoutUNIUSDT can go higher after the breakout. The price has formed a Bullish pattern and the last large green candle indicates that the bulls are in control.
💎 UNIUSDT
🔵 Entry zone 9.07- 9.76
🟢 TP1 11.60
🟢 TP2 13.90
🟢 TP3 16.10
🔴 SL 7.97
Good Luck 🎲

Trading opportunity for UNIUSDT UniswapBased on technical factors there is a Long position in :
📊 UNIUSDT Uniswap
🔵 Long Now 9.41
🧯 Stop loss 7.45
🏹 Target 1 11.60
🏹 Target 2 13.90
🏹 Target 3 16.10
💸Capital : 1%
We hope it is profitable for you ❤️
Please support our activity with your likes👍 and comments📝


UNIUSDTHello Crypto Lovers,
Mars Signals team wishes you high profits.
This is a one-day-time frame analysis for UNIUSDT
Here we have R2 and R1 as the resistance areas and they both contain the unsuccessful attempts of the price to rise. And S1 is our support line that represents the support of the price at some points. At the present, we have the fluctuation of price below R1 and we predict a little rise to this line and then here two scenarios will happen for the price. Either it will give us some confirmation candles and start a rising trend to R2. Or it is possible that the price loses the support and experience a fall to S1 or more. Remember that R1 is believed as a good area for saving profits.
Warning: This is just a suggestion and we do not guarantee profits. We advise you to analyze the chart before opening any positions.
Wish you luck

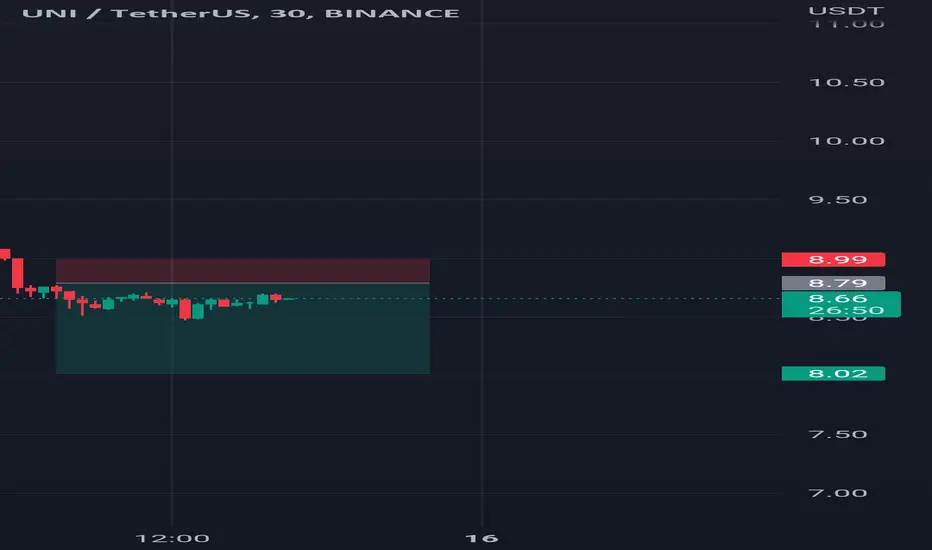
Bitcoin Trend Analytics August 12UNI has jumped out of the downward channel and initially entered consolidation. It has come near to the edge of heavy resistance and trying to breakout and expand the consolidation range.
Although coming out of the downward channel, UNI has not formed a short-term bullish channel.
Short-term bullish, mid-term consolidation
The support of the short-term bulls is at $8.02; $6.16

Uniswap forecast updateFor the next 24 hours, the middle line of the channel is both resistance line and support line in a neutral trend.
------------------------------
Please write any advice or suggestions.
Dear friends, request any cryptocurrency pair, currencies pair for forex, and any index that you want to be analyzed and ask any questions.
Thanks for your attention

Uni Usdt forecast |cryptocurrencyPlease write any advice or suggestions.
Dear friends, request any cryptocurrency pair, currencies pair for forex, and any index that you want to be analyzed and ask any questions.
Thanks for your attention

#Uniswap Rises 180%, UNI may expand to retest $14Past Performance of Uniswap
Uniswap is currently up 180 percent from 2022 lows, inching higher as the crypto tide shifts to favor buyers. UNI is within a bullish breakout formation, adding 10 percent in the past 24 hours to confirm gains posted on July 27. From the daily chart, the odds of UNI further expanding and breaking higher above July 2022 highs remain high.
#Uniswap Technical Analysis
From the daily chart, UNI prices have strong support at the middle BB, bouncing from the dynamic support level and closing on retesting July 2022 highs. The primary resistance is around $9.7; buyers could clear this level, rising to April highs at about $14. Considering this possibility, traders may find entries to buy the dips with primary support at $8 with targets at $14 in the medium term. Any shift in momentum, forcing prices below this week's low and the 20-day moving average, may see UNI dump to $6.
What to Expect from #UNI?
Traders are confident, and UNI holders expect more gains in the days ahead. The rejection of bear pressure and the explosion of prices on August 10, following through on July 27, is massive for Uniswap. Based on the current setup, UNI could have more headroom in the subsequent session following steep, crashing losses in H1 2022.
Resistance level to watch out for: $9.7
Support level to watch out for: $8
Disclaimer: Opinions expressed are not investment advice. Do your research.

UNI USDT forecast / ideaPlease write any advice or suggestions.
Dear friends, request any cryptocurrency pair, currencies pair for forex, and any index that you want to be analyzed and ask any questions.
Thanks for your attention

$UNI - Hidden Bearish Divergence $UNI - Hidden Bearish Divergence
Last time when this got executed, UNI went down 70%.
Let's see how much down it goes or even if this gets execute.

UNIUSDTUNI respect trendline and now completed a Triangle pattern, now we wait for a price movement, either above it, targeting 9.63$ resistance, or downwards, targeting 7.58$ support

long UNI$UNI bounced off the support level. Bullish movement to the resistance level at 9.63$ is likely to happen.

Short uniusdt with entry point, stop loss and target point Short uniusdt with entry point, stop loss and target point

UNI Update - Moving UpFollowing my previews idea. UNI had a good reaction in the box with a nice bounce.. I've marked some areas that I think price might find some resistance.
Do not follow my moves before you do your own research, These are ideas not financial advice,

Uniswap Further Bullish EmphasisVery similar scenarios to the beginning of Uniswap's price history, which was followed by a massive moonshot
I have posted about this before, this is for just emphasis on the bullish state (inverted H&S)

UNI up 83% after bull signal - Now 30% correction incoming?UNI pumped 83% after the bullish Supertrend Ninja - Clean signal (green vertical line on the background). Finding resistance from the grey block. In a possible bearish/correction scenario UNI might possibly drop 30% to 5.50 USD, completing wave 5 of the Elliot Wave (blue dotted lines).
UNI is still in the Bullish Zone of the Ichimoku Cloud. The RSI is at 61, but I expect it to fall back into the range (40 to 60). RSI Brown is at 55. If we take a look at the Average Directional Index ( ADX DI), its starting to be bearish, as the green line is pointing downwards. Currently UNI is above its middle Bollinger Band, Band Basis 20 Period SMA. While it is below the LSMA .
Remember to always take profits and use proper risk management!
Thank you for reading.
Namasté 🙏
Disclaimer: Ideas are for entertainment purposes only. Not financial advice. Your own due diligence is highly advised before entering trades. Past performance is no guarantee of future returns.
What Indicators Do I Like To Use:
I am using the "Supertrend Ninja - Clean", which is a trend-following indicator (Green and red vertical lines on the background). When the background of the candlestick closes green (vertical line). It indicates a possible bullish (up)trend. And red for possible downtrends.

💎 UNIUSDT: 524.39% Profit Potential in Next 6 Months💣💣💣💣last 2-3 weeks we seen huge buying in UNI coin, in upcoming months its to going pump very hard.
entry and targets are given on the chart. Treat this idea as long-term investment
please Like and comment if there are any queries.
#bitcoin #altcoinseason #altcoin #altnews

Trading opportunity for UNIUSDT UniswapBased on technical factors there is a Long position in :
📊 UNIUSDT Uniswap
🔵 Long Now 9.00
🧯 Stop loss 7.45
🏹 Target 1 11.60
🏹 Target 2 13.90
🏹 Target 3 16.10
💸Capital : 1%
We hope it is profitable for you ❤️
Please support our activity with your likes👍 and comments📝

UNIUSDT Bullish (Short term)After a strong breakout and a minor pullback in the 50% area after the last leg as well as giving us a nice double bottom in multiple timeframes, nice bull bars closing at their tops after strong bear bars which will probably be signs of a bear exhaustion gap, seems like a bull flag to me and I expect at least another leg up!
NFA

Clean bullish Wolfe Wave on $UNI.Missed out on the perfect entry on $UNI, but I will start accumulating now (even if we dip a little bit considering Bitcoin has a tendency to misbehave while ranging). Targeting around $8 as a target. Could be worth keeping some for after $8 if the market sentiment turned bullish in general.
