Week 07 | UNIUSDT | Short Position | H1 | 29-07-2022UNIUSDT has made AB=CD bearish harmonic pattern after the retracement from 0.618 fib level. There is strong resitance as well. Bearish inside bar shows that bullish trend has been finished but for confirmation we will wait for the higher low to break. So taking a short position at this level.
Uniusdt

UNI long profit. forecast !UNI was pushed up a lot, the ascending channel was broken, I think we will test it in the near future and fly further!
In order not to miss a buy signal, subscribe and stay tuned for new ideas. Every day I post 10 profitable ideas a day.

UNIUSDT 3D A unicorn appears on the Uniswap chartToday, let's take a look at the UNIUSDT trading pair on the 3-day time frame.
In general, the classic scheme, as for most altcoins - the price has been in a falling channel for more than a year.
But on the UNIUSD chart we see some cunningly hidden power of buyers, it seems to us that something interesting is being prepared around Uniswap.
Maybe some strong fundamental news is on the way?) Share, please, in the comments, because we don't follow such.
In general, the following route looks realistic for the coming month:
- correction in the area of 6 dollars (retest level that did not let up for a long time)
- fixing UNI price in the upper part of the global descending channel.
- rapid growth in the region of $12-13, and this is modest x2)
_______________________________
Since 2016 , we have been analyzing and trading the cryptocurrency market.
We transform our knowledge, trading moods and experience into ideas. Each "like under the idea" boosts the level of our happiness by 0.05%. If we help you to be calmer and richer — help us to be happier :)

UNIUSDTPERPDue to the creation of lower floors and ceilings in the recent steps of movement, with the price coming below the current candle, we can imagine the continuation of the fall for this currency.

UPDATE: UNI UP 43% after bullish daily signal.UNI pumped 43% after the bullish Supertrend Ninja - Clean signal (green vertical line on the background).
UNI broke out of the bullish Zone of the Ichimoku Cloud , which is bullish. The RSI is in the bullish zone at 63. If we take a look at the Average Directional Index ( ADX DI) its bullish. The +DI (Green Line) is above the -DI (Red Line). While the Trend Strength is becoming stronger. Since the ADX (Orange Line) is above its 9 Period EMA (Black Line). Currently UNI is also above its Bollinger Bands Middle, Band Basis 20 Period SMA. Which is a bullish sign as well.
Waiting patiently on a bullish Supertrend Ninja signal, before entering a long paid off.
Thank you for reading.
Namasté 🙏
Disclaimer: Ideas are for entertainment purposes only. Not financial advice. Your own due diligence is highly advised before entering trades. Past performance is no guarantee of future returns.
What Indicators Do I Use:
In the chart I am using the "Supertrend Ninja - Clean", which is a trend-following indicator (Green and red vertical lines on the background). When the background of the candlestick closes green (vertical line). It indicates a possible bullish (up)trend. And red for downtrends.

UNIUSDT is inside an ascending channel 🦐UNIUSDT on the 4h chart is trading inside an ascending channel.
The price is now testing the 4h support and might provide a deeper bearish move.
How can i approach this scenario?
I will wait for a clear break of the support and in that case, i will search for a nice short order according to the Plancton's strategy rules.
–––––
Keep in mind.
🟣 Purple structure -> Monthly structure.
🔴 Red structure -> Weekly structure.
🔵 Blue structure -> Daily structure.
🟡 Yellow structure -> 4h structure.
–––––
Follow the Shrimp 🦐

uniusdt short TAuniusdt potential short formation
Uniswap is a cryptocurrency exchange which uses a decentralized network protocol. Uniswap is also the name of the company that initially built the Uniswap protocol. The protocol facilitates automated transactions between cryptocurrency tokens on the Ethereum blockchain through the use of sma

Uniswap Looks Really Strong (150% Easy Target)This is a very strong chart we have for Uniswap (UNIUSDT).
We can see a long-term higher low.
Nov. 2020 vs Jun. 2022.
The 13-June weekly candle ended in a Dragonfly Doji with the highest bull/green volume ever.
Last week UNIUSDT closed above EMA10.
The RSI moved above 40 (strong on the weekly).
Finally, we have a falling wedge pattern already breaking bullish...
All that is left is for prices to grow.
Below $3.30 is the stop.
And the targets/resistance levels can be found on the chart.
Namaste.

Uniswap Falling Wedge UpdateUpdate on Uniswap falling wedge , a bullish pattern
Price has seemingly broken out at a critical point of this pattern

Uniswap Looks Much Better Based On Moving Averages (85%) If you have been reading the other charts/trade ideas that we share, you can easily appreciate that prices are either trading below EMA10 or just challenging it and if the chart looks good we can see it above EMA10 and sometimes above EMA50.
Now, let's have a look at Uniswap vs Tether (UNIUSDT).
See how EMA50 ($5.53) is already far behind as Uniswap moves above EMA100 ($6.55).
EMA100 is the level at which we saw a rejection back in April.
Another rejection happened 9-July and today we see a candle breaking above.
Confirmation only comes in less than 2 hours when the daily candle closes.
A close above this level, can lead to 80%+, short-term.
Mid/Long-term there can be more.
Namaste.

Uniswap New CycleViewing these inverted H&S patterns we can see that they are the same, just oppositely oriented, meaning we are entering an upward phase similar to that seen in the initial cycles beginning
Very bullish signal as we touch this Fibonacci level

Best unicorn - Dead unicorn🦄 Reasons to take long:
⭐️ Volume appeared
⭐️ Trendline is 24 days old
⭐️ Trendline is clean
⭐️ We are in the end of formation
⭐️ Slowly squeezing local level
⭐️ Volume entered the coin
⭐️ 46 ATR
⭐️ Under VWAP
Scenario will be invalidated if coin squeezes to trendline. Then it would be wise take short
Will enter when price squeezes to the trendline on 5m timeframe, the base will form and the tape will get faster.
If you don't understand the previous sentence, just use swing stop-loss 3-5%
Fix profit by parts:
1% - 1/3
2% - 1/3, stoploss to breakeven
What's left, hold to the maximum
What do you think of this idea? What is your opinion? Share it in the comments📄🖌
If you like the idea, please give it a like. This is the best "Thank you!" for the author 😊
P.S. Always do your own analysis before a trade. Put a stop loss. Fix profit in parts. Withdraw profits in fiat and reward yourself and your loved ones

uniUni in A rising chanel in 4 hour time fram
right now it got rejcted from resistance zone
if we can see more rejection so we should wait for long in trendline area
if we got break out of resistance so its easy to take a llong order

UNI UNISWAP LONG 20220711UNISWAP is in Demand Zone
Risk Reward: 3
UNI, UNISWAP, UNIUSD, UNIUSDT, CRYPTO,CRYPTOCURRENCY
DISCLAIMER
This is only a personal opinion and does NOT serve as investing NOR trading advice.
Please make your own decisions and be responsible for your own investing and trading Activities.

UNI As long as we above 4.6 level we might hit the targets in 4-6 months
good luck everyone
peace :)

UNI/USDTopen Long position
UNIUSDT formed head and shoulder pattern
buy : under $6.23
sell : $7.09
stp : $5.54

Update on our uni it gave 29.37% profitUpdate on our uni it gave us 29.37% profit on spot now assuming u long it with any leverage u are rich
Tho my target is 10$ to 50$ maximum in the next few months let's see what happens before then enjoy happy Sunday

UNI on the verge of breakoutUNI / USDT
Price is forming a massive falling wedge
And reached old accumulation zone where the price made over 2000% in 2021 bullrun year
A breakout from this pattern can produce strong bullish rally
Keep an eye on it !

Ichimoku analysis of UNIis finally out of cloud. However will long once closes above 6.75. Keep eye on the cloud thickness too. It needs to increase and for that there will be some pullback.

BITCOIN 2H TA: New TrendLine SupportAs we can see in the chart, the static support of the trend line has caused the price to increase in these few days, if the trend line is broken, it will cause correction in the coming days, and otherwise, with the price increase, we will have the resistance of $23,000.
Its not Buy or Sell SIGNAL
DYOR
BY : Mohamad Teriz - @AtonicShark


UNIUSDTPRICE ACTION:
• In a downtrend, price action finds first resistance (1) that forms left shoulder's low, where it reverse direction and goes upwards till finding support (2), completing the left shoulder formation.
• Price action reverses direction from that support (2) and goes downwards till finding second resistance (3) that forms head's low, where it reverses direction and goes upwards till finding support (4), completing the head formation.
• Price action reverses direction from the last support (4) and goes downwards till finding third resistance (5) that forms right shoulder's low, where it reverses direction going upwards.
• The pattern is completed when price action breaks the neckline at point (6) upwards.
TRADING THE PATTERN
• Trade entry: the pattern is traded after price action breaks the neckline at point (6), either with an entry after the breakout, or after a -possible- retest to the neckline which turned into resistance.
• Take profit: identified by measuring the vertical distance from head (3) to neckline, that measurement is then applied from the breakout point (6).
• Stop loss: can either be the neckline breaking rate (6), or the right shoulder's high (5).

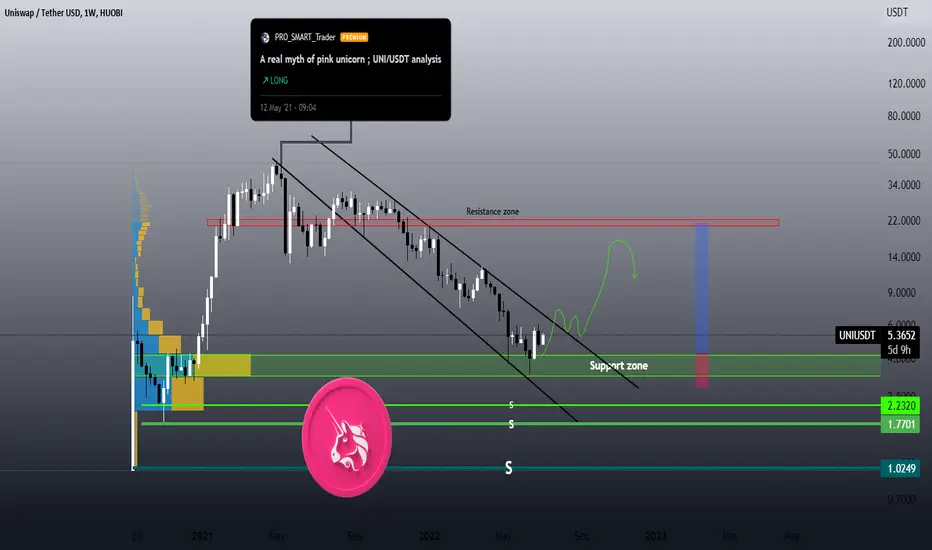
UNISWAP analysis (UNIUSDT) Update 📈📉HEY, what's going on Guys ?!
Since May 12, 2021, when I posted the last analysis for UNISWAP, after reaching my entry point and then little rising wasn't able to go up more than previous ATH and it has peen declining up until now .
but today as you can see on the weekly timeframe for uniusdt , after retesting the strong support zone ,rebounded and In my opinion is more likely aiming to breakout the descending trendline , so then after a nice pulback it can reach the higher red resistance zone . but if it loses the current support zone so then it can even see lower support levels.
✌️ Good luck with your trading and investing and remember: Trade smart…OR JUST DON’T TRADE!
--------------------------------------------------------------------------------------------------------------------
👉This analysis is my personal opinion ,not a financial advice ,so do your own research.
💜 if you're fan of my analyses please follow me , give a big thumbs 👍 OR drop a comment 🗯