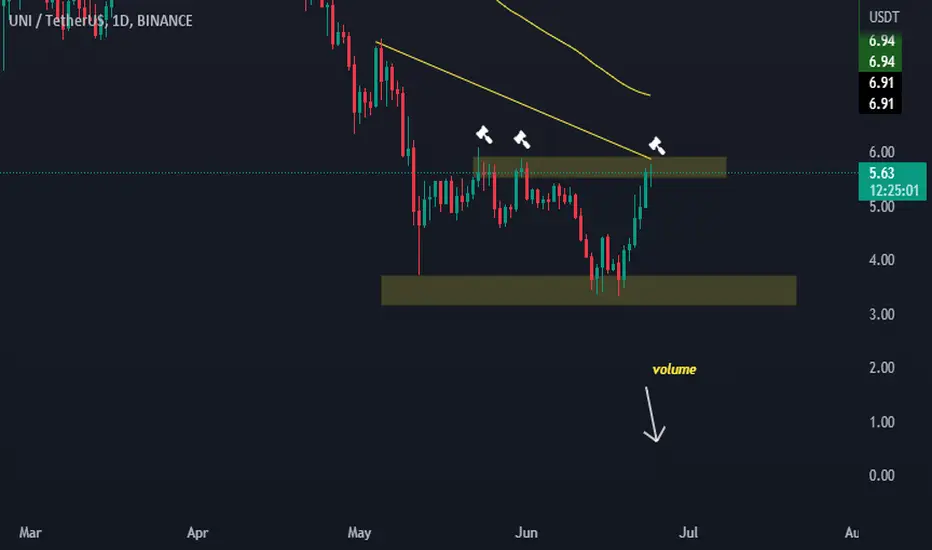
Time to short some pumps!?!bears took advantage of low volume and set up a trap on bitcoin today. if the trap validates ( btc h1 close below 21300 ) we can expect a drop for many altcoins that were on a run for the pas week or so.
my choice is UNI since investors have been taking profit on it.
please
like and share this idea.
Uniusdt

UNI/USDT Secondary trend. Local workShows the secondary trend of this coin. The coin is of the 2nd group. Zones of levels and formations (part of the ascending channel) are shown on the chart to work with.
Coin in the coenmarket : Uniswap(UNI)
For a better understanding of where price is in the main trend, check out this trading idea.
UNI/USDT Main Trend. Timeframe 1 week. Fractal potential

UNI/USDT Main trend. Timeframe 1 week. Fractal potentialThe main trend. Timeframe 1 week. A coin with an interesting purple unicorn symbolism. I think everyone understands that this is not a scam. Group 2 coin. Pretty little history on coenmarket since 18 09 2020 "Twitter army" with 624 thousand subscribers. The coin currently has over 100 trading pairs on over 40 exchanges.
A pronounced uptrend. Fractal incarnation potential. Squeezes can be to the zone of the second specified level 16, it won't break the trend, the main thing that there is no long-term fixation under the trend.
Coin in the coenmarket : Uniswap(UNI)
UNI/USDT Secondary trend. Local work

UNIUSDT
Hello Crypto Lovers,
Mars Signals team wishes you high profits.
This is a one-day-time frame analysis for UNIUSDT
In the current chart, we have R1 which used to be a support area but now it has the role of a resistance area. And S1 is our support area which includes the support of the price at some points although we had a failure in break, the price could recover itself over S1 again. Now the price is fluctuating below R1 and we have a reverse head and shoulders pattern. Our prediction would be a falling trend for the price and then a pull back toward R1 in order to complete the right shoulder. In case the price moves above R1 and fixes there, then we expect more rise. But even it possible for the price to lose the support and fall below S1.
Warning: This is just a suggestion and we do not guarantee profits. We advise you to analyze the chart before opening any positions.
Wish you luck

UNI looks juicyI'm already in another short but this looks a juicy short opportunity. At 1h you can see here RSI at 4h is starting to show some bearish DIV but the real confirmation is the OBV and the volume itself (although we still have 2h until the closing).
I think that if the BTC uptrend continues these bearish signals will be invalidated otherwise this should dump within 26h. If UNI dumps most of DeFi tokens will follow.
Use stop loss unless you're using a small position in an isolated margin <-- that's what I usually do because I don't like being stopped and maybe seeing my target being reached, in a very volatile market like crypto it happens very often. It's a thing I don't advice you to do though, you need to be cold even if you go down a lot and it's very risky!
Good luck

Uni /usdt : Analysishello? Traders, welcome. If you "follow", you can always get new information quickly. Please also click "Like".
Have a nice day!. -------------------
3H chart :

UNIUSDT🔥 150% profit on your depositSubscribe to the channel to receive more new information about the cryptocurrency market✅
Hello everyone👋
On the daily chart, the price of UNI has formed a descending triangle formation, the asset is almost at the very bottom and, if the MM is successfully bought out, it will give a good percentage of the deposit.
I will consider the project as a long-term one.

Uni usdt has a nice plan of good profits 📈Uni has a nice plan of huge profit in the next few weeks
If u can take the risk to follow this step u will make nothing less than 100% profit if btc didn't spoil the plan

UNI/USDTA falling wedge is always a bullish pattern. By definition, a falling wedge always follows a major rising trend and has 3 stages: major rising trend, correction, and continuation of a rising trend.
This pattern is appropriate in denoting a bullish momentum in the market in the future.

UNIUSDT Short PositionThe price has been swinging in a range box for the past 7 days and now the rejection from the upper edge of the box is happening simultaneously with the rejection from the mid-term descending trendline. In addition, there is a hidden divergence in the RSI oscillator while the price did not manage to make a new HH.
Having said that, the price might be seen at around $3.5 again in the next few days.
DO YOUR OWN ANALYSIS.
DO NOT FORGET MONEY MANAGEMENT.
Things you might like:
- Trend Key Points Indicator have been used to draw important key levels and key points.
- You can use Big Moves Indicator to be aware of major moves on the chart by marking them and getting alert for them.
- 🔥 Bitcoin vs Gold

UNIUSDT H2: 75% gains THE BEST LEVEL TO BUY/HOLD(SL/TP)(NEW)Why get subbed to me on Tradingview?
-TOP author on TradingView
-2000+ ideas published
-15+ years experience in markets
-Professional chart break downs
-Supply/Demand Zones
-TD9 counts / combo review
-Key S/R levels
-No junk on my charts
-Frequent updates
-Covering FX/crypto/US stocks
-before/after analysis
-24/7 uptime so constant updates
🎁Please hit the like button and
🎁Leave a comment to support our team!
UNIUSDT H2: 75% gains THE BEST LEVEL TO BUY/HOLD(SL/TP)(NEW)
IMPORTANT NOTE: speculative setup. do your own
due dill. use STOP LOSS. don't overleverage.
🔸 Summary and potential trade setup
::: UNIUSD H2/candle chart review
::: HIGHER RISK SETUP USE TIGHT STOP LOSS
::: short-term recovery / bounce play
::: targeting IHS formation
::: however strong bounce after pullback
::: setup still valid as of today
::: chart is LOG SCALE
::: get ready to BUY LOW later near 4.20/4.40
::: BUY LOW near 4.20-4.40 stop loss below
::: currently expect re-test of resistance near 5.80
::: chart looks good for a decent bounce play
::: for now stay out / wait for better entry price
::: up to 75% gains possible later
::: short-term pullback/correction
::: is possible / likely
::: however chart looks good for BOUNCE
::: SPECULATIVE SETUP
::: do your own due dill
::: and use proper risk management
::: TP bulls is +75% gains
::: details: see chart
::: FINAL TP is +75%
::: recommended strategy: BUY/HOLD 4.20 USD
::: TP BULLS +75% gains final exit 5.80 USD
::: SWING TRADE: BUY/HOLD IT
::: bull run not over yet
::: good luck traders!
::: BUY/HOLD and get paid. period.
🔸 Supply/Demand Zones
::: N/A
::: N/A
🔸 Other noteworthy technicals/fundies
::: TD9 /Combo update: N/A
::: Sentiment mid-term: BULLS/STRONG BOUNCE
::: Sentiment short-term: CORRECTION/5.80USD
RISK DISCLAIMER:
Trading Crypto, Futures , Forex, CFDs and Stocks involves a risk of loss.
Please consider carefully if such trading is appropriate for you.
Past performance is not indicative of future results.
Always limit your leverage and use tight stop loss.

wait for buy trigger in demand zones.it would be better to breakout one of these zones and channels.

Uni shows an inverse head and shoulders.Hello traders!!
After having made a quick analysis i think that it could be a good moment to enter a long position in UNISWAP due to the reversal pattern that shows in 4h time frame.
The inverted head and shoulders pattern signals a book long. The correct entry is when the pattern is confirmed, that is when the price surpasses the neck line.
There is two possibilities one is to enter now and the other is to enter after the breakout of the neckline.
I'm going to take the risk and i will enter now a long at 4.0$ with stop loss at 3.80$ and targets 4.45$ 4.90$ and 5.45$.
When the price reaches 4.25$ i will put the stop loss at entry.
I will be glad to see your opinion in the comments. Please give a like if you agree with me, it helps a lot.

UNI - check it!Guys, do you saw LIT how it pumped? BAND too! I found UNI and it looks also the same, but it has a lot higher market cap, I think it will do not so much gains, but enough to take it ;)
Maybe we see a pump on UNI soon, maybe today?
Get it on your watchlist!
NO FINANCIAL ADVICE | DYOR | HAPPY TRADING


FREE SIGNAL short Positions in UNIUSDT FREE SIGNAL short Positions in UNIUSDT for nautral investment strtegy

Uniswap (UNI) formed bullish Gartley for upto 2043% massive moveHi dear friends, hope you are well and welcome to the new trade setup of Uniswap ( UNI ).
On a monthly time frame, UNI has formed bullish Gartley pattern.
Note: Above idea is for educational purpose only. It is advised to diversify and strictly follow the stop loss, and don't get stuck with trade

be careful with uniWe draw a beautiful massive wedge, but we still have not reached our goals. From a technical point of view, it would be simply ideal to reach the golden ratio of 1.618 and only from there exit the wedge. Of course, when btc goes to 22000, we can break this wedge down and this will be a false breakdown and a selling climax, as well as a strong squeeze below 1.618. Answer yourself, buying now without evidence of growth, are you ready to sit out -40%?

UNI - 1 way ticket🎫 Reasons to take short
⭐️ BTC is bearish
⭐️ Trend bearish
⭐️ Level is 12d old
⭐️ Level is visible on multiple timeframes
⭐️ In the end of formation
⭐️ Multiple close retests
⭐️ False breakout
⭐️ 5th touch
⭐️ Under VWAP
Will enter when price squeezes to the level on lower timeframes, the base will form and the strip will get faster.
If you don't understand the previous sentence, just use swing stop-loss 3-5%
Fix profit by parts:
1% - 1/3
2% - 1/3, stoploss to breakeven
What's left, hold to the maximum
What do you think of this idea? What is your opinion? Share it in the comments📄🖌
If you like the idea, please give it a like. This is the best "Thank you!" for the author 😊
P.S. Always do your own analysis before a trade. Put a stop loss. Fix profit in parts. Withdraw profits in fiat and reward yourself and your loved ones

UNIUSDTHello Crypto Lovers,
Mars Signals team wishes you high profits.
This is a one-day-time frame analysis for UNIUSDT
Clearly the price started its rising trend above the lost support line (Now R2 line) and then it had a rise and there we formed another resistance line (R1) which resembles that the price was not able to move over it and it was rejected at some times. Then by moving in a channel and reaching the end of this channel it had a rise again and we formed another support line (S1) which shows the support of our price at several points. At the moment, we see the price fluctuating over the first resistance line and we believe it will fix its trend and move upward to the second resistance line and will have more increase. On the opposite, if the price loses the support, it will start falling and by having a pull back, it will face more decline toward the second and third support lines.
Warning: This is just a suggestion and we do not guarantee profits. We advise you to analyze the chart before opening any positions.
Wish you luck

UNI/USDT BUYING SETUPUNI Valid retest after breakout ascending triangle pattern. in correction make a broadening wedge pattern and succeed breakout. we can setup entry now or when retest
Buy zone : 5.7 - 5.5 - 5.2
Target : 5.96 - 6.29 - 6.63 - 7
Stop : 5
