UNI/USDTGlobally, the coin has an bullish structure, while locally it is in consolidation. At the moment, it has reached an order block + deviation near the lower boundary of the consolidation, so a long position and spot can be considered.
Growth targets:
Target 1 = 13.21
Target 2 = 15.78
Target 3 = 19.44
Uniusdt

UNI BUY hello friends
Due to the price being corrected, now we can make purchases step by step in the specified areas and move to the specified goals with capital management.
*Trade safely with us*

UNIUSDT | Accuracy is What We DeliverAccuracy is what we deliver. Check out my earlier Uniswap analyses for reference—this one is no different. Let’s keep winning! 🚀
🟣 UNIUSDT.P: Long-Term Trade
Uniswap (UNI) Analysis
Hourly and Main Support Blue Boxes
I know many of you love hourly charts and want me to share them, but let’s face it—hourly reactions often lack strength. Still, I’ve shared the first blue box on the hourly chart that could deliver a modest 5-6% reaction.
Highlights:
Hourly Blue Box: A potential zone for a short-term reaction, offering a quick 5-6% opportunity.
Main Support Box: The real deal is the blue box below, a high-probability area for strong reactions.
Track Record: My previous Uniswap analyses have proven their accuracy, and this one follows the same disciplined approach.
Key Observations:
"The blue boxes are carefully selected using volume footprint, volume profile, cumulative delta volume, and liquidity heatmap. When trading these zones, I will look for buyer activity and upward market structure breaks in lower time frames for confirmation."
Let me tell you, this is something special. These insights, these setups—they’re not just good; they’re game-changers. I've spent years refining my approach, and the results speak for themselves. People are always asking, "How do you spot these opportunities?" It’s simple: experience, clarity, and a focus on high-probability moves.
Want to know how I use heatmaps, cumulative volume delta, and volume footprint techniques to find demand zones with precision? I’m happy to share—just send me a message. No cost, no catch. I believe in helping people make smarter decisions.
Here are some of my recent analyses. Each one highlights key opportunities:
🚀 RENDERUSDT: Strategic Support Zones at the Blue Boxes +%45 Reaction
🎯 PUNDIXUSDT: Huge Opportunity | 250% Volume Spike - %60 Reaction Sniper Entry
🌐 CryptoMarkets TOTAL2: Support Zone
🚀 GMTUSDT: %35 FAST REJECTION FROM THE RED BOX
🎯 ZENUSDT.P: Patience & Profitability | %230 Reaction from the Sniper Entry
🎯 DEXEUSDT %180 Reaction with %9 Stop
🐶 DOGEUSDT.P: Next Move
🎨 RENDERUSDT.P: Opportunity of the Month
💎 ETHUSDT.P: Where to Retrace
🟢 BNBUSDT.P: Potential Surge
📊 BTC Dominance: Reaction Zone
🌊 WAVESUSDT.P: Demand Zone Potential
🟣 UNIUSDT.P: Long-Term Trade
🔵 XRPUSDT.P: Entry Zones
🔗 LINKUSDT.P: Follow The River
📈 BTCUSDT.P: Two Key Demand Zones
🟩 POLUSDT: Bullish Momentum
🌟 PENDLEUSDT.P: Where Opportunity Meets Precision
🔥 BTCUSDT.P: Liquidation of Highly Leveraged Longs
🌊 SOLUSDT.P: SOL's Dip - Your Opportunity
🐸 1000PEPEUSDT.P: Prime Bounce Zone Unlocked
🚀 ETHUSDT.P: Set to Explode - Don't Miss This Game Changer
🤖 IQUSDT: Smart Plan
⚡️ PONDUSDT: A Trade Not Taken Is Better Than a Losing One
💼 STMXUSDT: 2 Buying Areas
🐢 TURBOUSDT: Buy Zones and Buyer Presence
🌍 ICPUSDT.P: Massive Upside Potential | Check the Trade Update For Seeing Results
🟠 IDEXUSDT: Spot Buy Area | %26 Profit if You Trade with MSB
📌 USUALUSDT: Buyers Are Active + %70 Profit in Total
🌟 FORTHUSDT: Sniper Entry +%26 Reaction
🐳 QKCUSDT: Sniper Entry +%57 Reaction
📊 BTC.D: Retest of Key Area Highly Likely
This list? It’s just a small piece of what I’ve been working on. There’s so much more. Go check my profile, see the results for yourself. My goal is simple: provide value and help you win. If you’ve got questions, I’ve got answers. Let’s get to work!

TradeCityPro | UNIUSDT Delay in Crypto Bullrun👋 Welcome to TradeCityPro Channel!
Let’s analyze today’s altcoin during these days when most people are focused on red candles and feeling FOMO, inviting you to stay calm.
I have a feeling that these corrections and the previously released interest rates have caused the bull run we have in mind to be slightly delayed, but this event has also increased its
probability.
🌐 Overview Bitcoin
As always, before starting today’s altcoin analysis, we’ll take a look at Bitcoin in the 1-hour timeframe. We’ve reached the 91830 support level and had a good reaction to it, which further highlights its importance.
However, after this reaction, we formed a lower high and got rejected, moving towards this level again. If you pay attention, exchange orders have significantly decreased, and we can say that no one is making any specific trades, with most people waiting.
If the 91830 support is broken, we can move toward 86,000 USD , In case of breaking this support and Bitcoin moving downwards, if its dominance is also dropping, it’s a good idea to open a short position on Bitcoin.
On the other hand, if Bitcoin dominance is breaking through the 58.11% resistance, altcoins will face sharper declines.
📊 Weekly Timeframe
In the weekly timeframe, UNI has a relatively better position compared to other altcoins and has shown good upward movements, which is not unrelated to its excellent DEX platform.
The weekly candle for this week will close in 3 days. However, what has happened is that last week’s candle has been engulfed, and a lower high has formed, which could indicate temporary profit-taking.
For another entry, this 14.844 resistance, which is currently being rejected, is a good trigger. The main ceiling is 18.865, where you can make your purchase, and your first target would be 42.575.
📈 Daily Timeframe
In the daily timeframe, after breaking through the 9.394 resistance, we had a good upward movement reaching 18.664, which has been a profitable move. It was logical to withdraw your initial capital when your investment doubled, leaving the rest of your coins free of charge.
After rejecting the 18.664 resistance, breaking the temporary 15.289 support, we moved toward 12.501, and after pulling back to 15.289, we formed a lower high than 18.664 and are now back at this critical support.
On the other hand, the 12.501 support zone aligns with the 0.382 Fibonacci level, which is of great importance. If we rebound from here, we can experience a good upward movement. However, breaking this support could lead to lower levels, such as 9.394.
The key point about UNI compared to other altcoins is that it is currently above a higher support level than the rest of the market.
If we fake out the 12.5 support, it’s a good trigger for entry , If we rebound from this support and break the 15.289 resistance, you can buy with a 12.5 stop loss , If you miss these two triggers, buy after breaking the 18.664 resistance with a confirmed 12.5 stop loss.
If none of these three scenarios are activated and the price moves toward lower levels like 9.394, I will update the analysis for you after the downward wave's momentum decreases and provide a new trigger.
Breaking the 12.5 support can also serve as a trigger for opening a futures position in lower timeframes, but don’t forget about profit-taking and small stop-losses. Overall, this is a chart worth having on your watchlist.
📝 Final Thoughts
Stay calm, trade wisely, and let's capture the market's best opportunities!
This analysis reflects our opinions and is not financial advice.
Share your thoughts in the comments, and don’t forget to share this analysis with your friends! ❤️

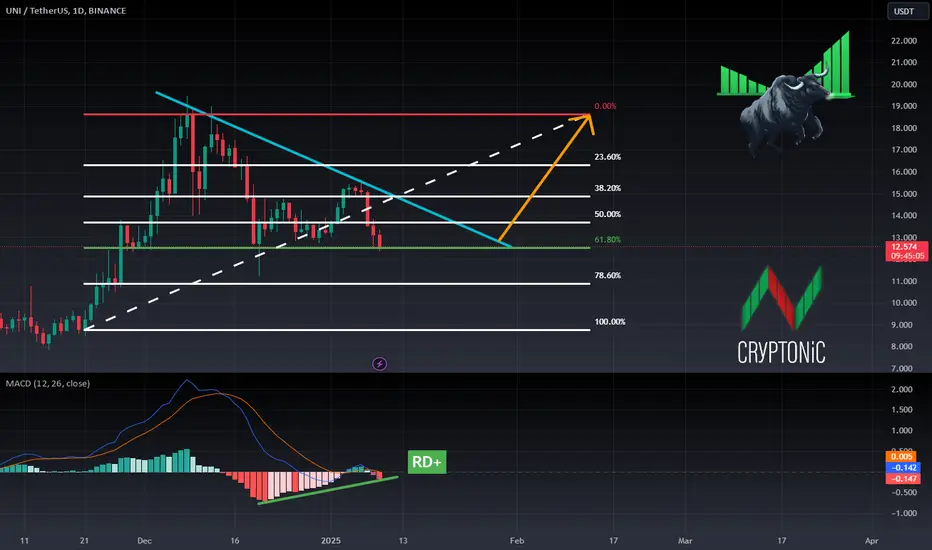
Why I think UNI can be bullish despite the bearish pattern!BINANCE:UNIUSDT
UNI is in a bearish pattern(Descending triangle!) but I think the price will increase cause I see some bullish stuff going on:
1-Bullish divergence on MACD
2-0.618 (61.8%) of the Fibonacci retracement shows a positive reaction for UNI so this might be a turning back point for it!
⚠️ Disclaimer:
This is not financial advice. Always manage your risks and trade responsibly.
👉 Follow me for daily updates,
💬 Comment and like to share your thoughts,
📌 And check the link in my bio for even more resources!
Let’s navigate the markets together—join the journey today! 💹✨
UNI/USDT hit the targets perfectly hooray!UNI/USDT hit the targets perfectly hooray!
Everyone who followed my analysis can now book a whopping profit of 35.3% with 10x leverage. As always, we partially closed our position at every 10% profit milestone while moving the stop-loss to breakeven.
For more free trade ideas like this, follow me here: @wsaetos .
Don’t forget to boost this post if you enjoyed this trade.
Stay tuned for more updates!"

UNI/USDT Short PositionThis chart illustrates a short position on UNI/USDT following a potential bearish breakout from an ascending wedge pattern. The price action has been respecting the upper and lower trendlines, forming higher highs and higher lows. However, the breakdown below the lower support trendline signals a reversal.
Key Levels
- Entry Price: Near 13.90 (just below the breakdown point)
- Stop Loss: Around 14.27 (above the wedge resistance)
- Take Profit Target: 12.12 (aligned with key support levels and pattern height projection)
Technical Insights
Rising Wedge Pattern: Typically bearish, indicating weakening bullish momentum before a potential decline.
Bearish Confirmation: The strong bearish candlestick closing below the wedge support adds confidence to the short setup.
Risk-to-Reward Ratio : This trade offers a favorable R:R, approximately 1:2.5, making it an attractive short opportunity.
Watch for additional confirmations like increasing volume on the breakdown or retests of the former support turned resistance to add confluence.

PARABOLIC STRUCTURE - ETH vs UNI MartyBoots here , I have been trading for 17 years and sharing my thoughts on UNI here.
UNI is looking like its building a parabolic structure, very strong chart for more upside
Very similar to ETH which is up nearly 1000% increase from these levels
Do not miss out on UNI as this is a great opportunity
Watch video for more details

Trendline Breakout on UNI/USDT: Eyeing Key Levels at $14.40-$14.The UNI/USDT chart has broken out of a descending trendline, indicating a potential shift in momentum toward bullish territory.
The price is currently testing a key resistance zone around $14.40-$14.60, which previously acted as a demand area but now serves as resistance.
DYOR, NFA

uniIn the short term, it is circulating in these two areas. If the red box breaks, it can go again to touch the remaining areas in the medium term. If it fails, we will return to the blue line.
Uniswap (UNI)UNI/USDT Analysis 📊
UNI is one of the significant assets in the cryptocurrency world, attracting considerable attention from investors due to its high trading volume and dynamic network. This analysis aims to examine UNI's price movement within an ascending channel and highlight potential trading opportunities:
⚖️ Current Status:
Recent Correction:
After hitting the top of the ascending channel, UNI has corrected towards the 0.5 Fibonacci level (between $11.5 and $11.1), which overlaps with the channel's middle line.
This overlap is significant for traders, as it confirms the strength of support and resistance in this range.
Key Supports:
Two grey zones at the bottom of the chart are considered vital support areas:
$5.2 to $6
$3.6 to $4
These zones are recognized as strong support areas due to the multiple reactions of the price in the past. In UNI's trading history, these levels have successfully prevented sharp declines and have created high demand in these ranges. Additionally, the presence of large buyers in these areas shows their credibility.
RSI and Divergences:
The RSI is currently in an ascending channel, but it recently reversed before reaching the top of the RSI channel, forming a negative divergence. In the past, such divergences have often led to temporary corrections or even trend reversals in UNI's price. These behaviors suggest that traders should pay close attention to these signals, as they could play a key role in trading decisions.
This divergence indicates that a temporary price correction may occur or even a signal for a broader trend change.
🔎 Potential Scenarios:
Bullish Scenario:
If the price manages to stabilize above the red resistance zone (weekly resistance):
Fibonacci targets become attainable:
1.618 Fibonacci: $22 to $24
2.272 Fibonacci: $37 to $41
2.618 Fibonacci: $49 to $61
Bearish Scenario:
If the price fails to stabilize above the red resistance zone:
A correction down to the 0.618 Fibonacci level (between $9.4 and $10.3) is likely.
If the Fibonacci levels break down, the price may drop towards the bottom of the ascending channel (between $7.2 and $8).
⚡️ Key Takeaways:
Price stabilization above the red resistance zone is crucial for continuing the upward trend. Factors like increasing trading volume while attempting to break this resistance and positive news regarding UNI or the crypto market could assist in breaking this level. Indicators to watch include the formation of strong bullish candlesticks, significant volume spikes, and positive divergence in technical indicators like RSI.
Pay close attention to the negative RSI divergence, as it may signal a deeper correction.
The grey support zones will act as primary price defenses.
Traders should closely monitor price behavior near the middle line of the channel.
A strong breakout above the red resistance zone with high volume could confirm an entry signal.
🔔 Summary:
In the UNI analysis, the price behavior at the red resistance zone is key. If this resistance is broken, higher targets are expected. However, if the price fails to break this resistance, a correction towards lower Fibonacci levels and even the bottom of the channel is possible. Additionally, the RSI divergence serves as a warning for traders to follow the market's behavior more cautiously.
🔴 Practical Recommendation:
Traders should enter the market with a risk management strategy, and diversifying their capital can be highly beneficial to avoid unexpected risks. Furthermore, stay updated with analysis revisions.
⏰ Stay tuned for further updates and more detailed analysis!

UNIUSDT | Another Big Opportunity
You can see my latest UNIUSDT analysis here, it's in %60 profit. I told that I will hold till 40$ and I'm still behind it.
Mastery, creates history.
And here is another trade.
Blue box is high probability demand zone.
Price didn't make a new high, it might need some rest.
I keep my charts clean and simple because I believe clarity leads to better decisions.
My approach is built on years of experience and a solid track record. I don’t claim to know it all, but I’m confident in my ability to spot high-probability setups.
My Previous Analysis
🐶 DOGEUSDT.P: Next Move
🎨 RENDERUSDT.P: Opportunity of the Month
💎 ETHUSDT.P: Where to Retrace
🟢 BNBUSDT.P: Potential Surge
📊 BTC Dominance: Reaction Zone
🌊 WAVESUSDT.P: Demand Zone Potential
🟣 UNIUSDT.P: Long-Term Trade
🔵 XRPUSDT.P: Entry Zones
🔗 LINKUSDT.P: Follow The River
📈 BTCUSDT.P: Two Key Demand Zones
🟩 POLUSDT: Bullish Momentum
🌟 PENDLEUSDT: Where Opportunity Meets Precision
🔥 BTCUSDT.P: Liquidation of Highly Leveraged Longs
🌊 SOLUSDT.P: SOL's Dip - Your Opportunity
🐸 1000PEPEUSDT.P: Prime Bounce Zone Unlocked
🚀 ETHUSDT.P: Set to Explode - Don't Miss This Game Changer
🤖 IQUSDT: Smart Plan
⚡️ PONDUSDT: A Trade Not Taken Is Better Than a Losing One
💼 STMXUSDT: 2 Buying Areas
🐢 TURBOUSDT: Buy Zones and Buyer Presence

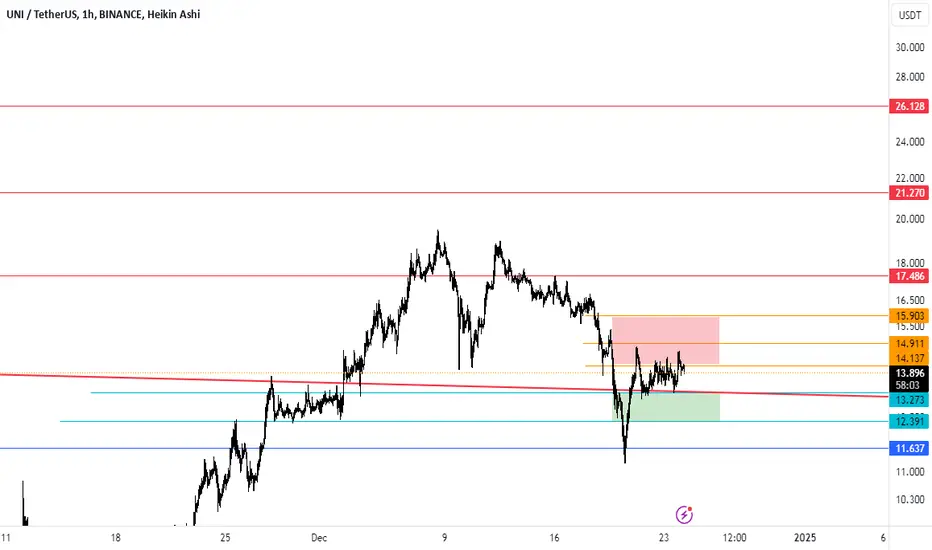
#UNI/USDT Ready to go higher#UNI
The price is moving in a descending channel on the 1-hour frame and sticking to it well
We have a bounce from the lower limit of the descending channel, this support is at 14.00
We have a downtrend on the RSI indicator that is about to be broken, which supports the rise
We have a trend to stabilize above the 100 moving average
Entry price 14.50
First target 15.00
Second target 15.61
Third target 16.35

UNIUSDT 1WUNI Update ~ 1W
#UNI If you still have Conviction on this coin,. Buy gradually within this support block,. With a short term target of at least 20%++. This coin is still in a bullish trend

UNI/USDT : Bouncing back from support, Eyeing a bullish reversalUNI/USDT: Bouncing Back from Trendline Support, Eyeing a Bullish Reversal
UNI/USDT is showing promising signs of recovery 📈 as it rebounds from a critical trendline support zone 📊. This bounce could signal the start of a strong bullish reversal 💥 if momentum continues to build. With market sentiment shifting, this pair is one to watch closely 👀 for potential opportunities.
Key Insights:
1. Trendline support: UNI/USDT has respected a long-standing trendline, which has historically provided strong support. A rebound from this level suggests buyer confidence is returning.
2. Volume uptick: Monitor for increasing trading volume during the bounce to confirm the strength of buyers 🔥.
3. Bullish signals: Momentum indicators like RSI and MACD are turning upwards ⚡, adding to the case for a potential bullish move.
Steps to confirm the reversal:
Look for a series of higher highs and higher lows on the 4H or daily timeframe 📍.
A spike in trading volume during the bounce will reinforce buyer activity 📊.
Watch for price testing the next resistance zone—if it breaks through, it could confirm a trend shift ✅.
Be cautious of false recoveries or sharp sell-offs that breach the trendline ⚠️.
Risk management strategies:
Place stop-loss orders just below the trendline support to protect against unexpected breakdowns 🔒.
Adjust position sizes to fit your overall trading strategy and risk tolerance 🎯.
This analysis is for educational purposes only and not financial advice. Always conduct your own research (DYOR) 🔍 before making any investment decisions.

TradeCityPro | UNI : Maintaining Bullish Momentum👋 Welcome to TradeCityPro!
In this analysis, I’m going to review the UNI coin. The Uniswap project is a decentralized exchange (DEX) with one of the highest Total Value Locked (TVL) in DeFi. It has a native token named UNI.
📅 Daily Timeframe: Breakout of the Key High Wave Cycle Resistance
On the daily timeframe, after the price first reached the 14.895 resistance level, it was rejected and entered a downtrend, eventually hitting the 5.591 support with a Selloff candle.
📈 Once the price reached this support, the market momentum gradually shifted, and after breaking through the 8.403 resistance, momentum turned fully bullish. Even the key resistance of 14.895 was surpassed, pushing the price to the 18.979 zone.
🔽 After initially reaching the 18.979 resistance, the price showed a corrective candle, retracing back to 14.895 as a pullback. Following this, the price rallied again to 18.979, maintaining its upward momentum.
📊 Throughout this upward movement, the volume has consistently confirmed the trend and shown convergence. Additionally, after breaking 8.403, the RSI oscillator entered the Overbuy zone, indicating the bullish momentum is intact.
🚀 If 18.979 is broken, the major resistance levels to watch are 28.968 and 43.088. While there are additional resistance zones along the way, these two hold greater significance.
📉 Correction Scenario
In the event of a correction, the first significant level is 14.895, which has already acted as a pullback zone once. A deeper correction could see the price revisiting the 8.403 support.
✨ If this level is broken, market momentum will likely turn bearish. In such a case, the 5.591 and 3.857 levels will serve as the final strongholds for UNI.
📝 Final Thoughts
This analysis reflects our opinions and is not financial advice.
Share your thoughts in the comments, and don’t forget to share this analysis with your friends! ❤️

ATH for UNI seems doableas per triangle breakout so likely UNI will lead a higher expansion into ATH

Analysis and review of UNISAWPHello dear friends
We are at your service by analyzing and reviewing a coin from the DEFI field.
Coin of the decentralized exchange UNISAWP, which is a very, very potential coin.
This coin has expected movements, as you can see, it was suffering for a long time, now that the decentralized exchanges are speaking first, it was able to get out of the suffering and make an upward movement, but this is just the beginning of the story...
After his rise, he made a good pullback and due to the rounding of the trend, he gives us this signal that a big rise is happening.
If you have this currency, we suggest that you keep it.
But if you are looking for a buying opportunity, you can make a buying step here and wait to buy in the specified areas if the market corrects.
Note that this coin has a good future...

UNI has a very good investment opportunity Hi Everyone;
today we have one of the best risk to reward Investment opportunity
it is more than 500 times the risk and the chart is look very promising.
I expect breaking the previous bear market key point will clear the way to the final target

Easy 3x from here for UniswapWhen it comes to DEFI, what is the go-to website for you?
For me it's Uniswap, with clarity of regulation down the road as Trump takes office, UNI is destined to succeed in my opinion.
The chart looks amazing as well, clear break of asymmetrical triangle, seems like a low risk high reward trade for me.
###NOT FINANCIAL ADVICE###

SasanSeifi| Moving Towards New Targets!Hey there, ✌ As seen in the KUCOIN:UNIUSDT chart, the price has shown a partial rise from the $6 area.
After breaking structure around the $8.50 level, it climbed to $10.
Currently, after a minor pullback, the price has reacted positively from the FVG zone near $8 and is trading around $9.50. The general outlook leans bullish, and it's expected that the price could see significant growth from the $9 range to targets of $12–$14 in the mid-term.
The important support is between $8 and $7.50.
💢 Please remember that this is just my personal viewpoint and should not be taken as investment advice. I’d love to hear your thoughts and share opinions!
Happy trading!✌😎
Sure, if you have any more questions or need further clarification, feel free to ask. I'm here to help!✌

#UNI/USDT#UNI
The price is moving in an ascending channel on the 1-day frame and is sticking to it very well and is about to break higher
We have a bounce from the lower limit of the channel at 6.37
We have an ascending trend on the RSI indicator that is about to break, which supports the rise
We have a trend to stabilize above the 100 moving average
Entry price 7.16
First target 8.90
Second target 10.00
Third target 11.62

UNI | UNISWAP Are we in DeFi Summer?
The price of Uniswap is $6.4 today with a 24hour trading volume of 158 million dollar. This represents a 5% price increase in the last 24 hours and a 28% price increase in the past 30 days
but what is UNI and what is UNI SWAP?
UNI is the governance token for Uniswap. UNI was introduced on 16th September 2020 through a retrospective airdrop to users who have interacted with the protocol either by swapping tokens or by providing liquidity.the UNI token allows token holders to participate in the governance of the protocol. Key decisions such as usage of the treasury or future upgrades can be decided through a governance vote.
Uniswap is a decentralized exchange that makes it easy for users to swap an ERC20 token for another ERC20 token without the need of a centralized intermediary. With a DEX, traders do not have to deposit their tokens on an exchange and be exposed to the security risks of a centralized exchange.
UNI's relative strength index of 63 shows bullish momentum is gathering steam but not yet overheated. The moving averages are aligned for more gains as well, with UNI trading above its 10day, 50day and 200day simple moving averages. Overall, the technical posture looks strong
next targets are 6.5, 6.7 and "6.9" $
whats your top defi token?
