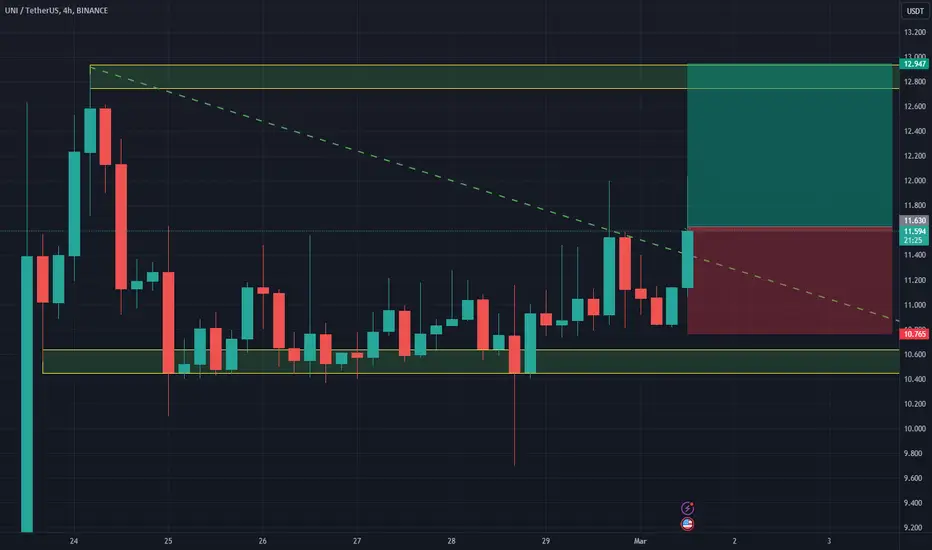
long UNIUNI broke through the descending trendline. The bullish trend is expected to continue and reach the resistance level at $12.94
Uniusdt
UNI/USDT Break the key resistance area. Bullish Momentum ???💎 UNI has been a focal point in the cryptocurrency market, having recently achieved a significant breakthrough by surpassing a key resistance area and breaking out of a bullish pennant pattern.
💎 This advancement indicates a potential retesting phase at what was previously resistance, now serving as support. Successful retesting could pave the way for continued upward movement, with the next target being a strong resistance area.
💎 During this retesting phase, it's crucial for UNI to demonstrate a robust bounce off the support area to maintain its upward trajectory. Failure to hold this support level could result in UNI retreating to the demand area, specifically around the $6.1 mark.
💎 The $6.1 demand zone becomes a critical point for UNI. For the asset to resume its upward path, a strong rebound from this level is necessary, aiming to surpass and sustain above the former resistance level.
💎 This action is vital for continuing the upward movement towards the strong resistance. Conversely, if UNI fails to hold this demand level and breaks down, it could signal a shift towards a stronger support area.

UNI/USDT Bullish Surge from Key Demand Zone? 🚀UNISWAP💎 Paradisers, get ready for an exciting trading prospect with #UNIUSDT, as it shows promising signs of a bullish continuation from its demand zone.
💎 Exploring #UNISWAP trajectory, we've observed its ascent from a significant supply level at $7.727. After a brief deceleration, our focus shifts to a potential bullish leap from the demand level of $7.232, where an abundance of liquidity further bolsters the case for a reversal. Remaining steadfast at this point could set the stage for the bullish expedition we're envisioning.
💎 If momentum for #UNI starts to wane, our eyes are on a rejuvenating rebound from the firm demand level at $6.916. However, a descent below this pivotal level could signify the beginning of a more pronounced bearish trend.

UNIUSDT Trade Idea (4RR: +20% Pump??)This is not financial advice and you can risk serious money if you take this trade.
Check out my previous call on UNIUSDT, this trade idea is just an update from that.
- Retracement on Daily TF
- 1H MMBM
- 1H MSS
- 1H FVG
Rally Higher With Respect To HTF Trend.

UNI/USDT breakout after two year consolidation- UNI/USDT Accumulation for 658 days is over
- Strong breakout on increased volume to FIB 0.236 lvl
- Strong fundamentals, a lot of important updates these days
- CRYPTOCAP:UNI target zone is 24.16-29.13

UNIUSDT Long; Second Pump To Pushing Above $13 EASY BIG GAINS!!!Looking for UNIUSDT to push above $13 into a monthly PD Array.

#UNI/USDT#UNI
The price has been moving in a downward channel since August 2022
The price is now on its way to a downward trend
The price now is 5.47 $
First goal 6.63 $
Second goal 7.73 $
Third goal 9.0 $
Which represents 210 % of the current price
With significant oversold and upward momentum
We also find that the MACD indicator is highly oversold
All of this supports the falling channel pattern, whose upper trend we are about to reach
We have a big support area on the chart at the price of 4.5 $

#UNI/USDT #UNI
We have a decline with the market falling. The price is expected to reach the support level of 5.23.
Where there is Moving Average 100 support
Then it bounces up to break the bear flag 8.78
With a target level of 8.87

UNI/USDT: UNI descending triangle, possible breakout ?UNI is currently trading inside the descending triangle and we can expect some movement inside the the triangle.
if the current momentum continues we can expect the upward moment and we will enter a long trade when price breaks upward.
if the price breaks the support then the trade invalid. price could settle in the next support at around 4.8
Entry Price: 6.222
Stoploss: 5.583
TP1: 6.571
TP2: 6.954
TP3: 7.685
TP4: 8.277
Don't forget to keep the stoploss. Like and follow us for more similar trade ideas.
Cheers!
GreenCrypto

UniSwap- MFI EXTREMLY Oversold. Bulls Load Up. Market Cap 3.1 Billion
Up a nice 2,400% before the RSI Bear Div and the "Incredible Sell" prints.
Price has corrected 92% since and was gobbled up from the 0.786 fib level.
Big Volume Profile in this range with POC around $3.80
Weekly Heikin Ashi Money Flow Index sits at 0.11!
Stochastic Oversold.
Long Term Bulls should now DCA.
Could it drop further? Sure. I don't try timing tops or bottoms.
Speculative Setup, DYOR. Allow 3-18 Months For all Crypto Ideas.
Credit to @without_worries for allowing use of indicators.

UNI - FollowupCRYPTOCAP:UNI
A follow-through on the trendline pointed out before to the range mentioned before.
But most importantly, look at that sexy momentum volume

UNIUSDT Long IdeaUNIUSDT broke out of triangle on 3D.
I'm expecting a pullback and a continuation of the move upwards.

UNIUSDT Elliott Waves AnalysisHello friends.
Please support my work by clicking the LIKE button👍(If you liked). Also i will appreciate for ur activity. Thank you!
Everything on the chart.
Targets: 7.5 - 10 - 12.5
after first target reached move ur stop to breakeven
Stop: ~3.9 (depending of ur risk). ALWAYS follow ur RM .
RR: 1 to 4
risk is justified
Good luck everyone!
Follow me on TRADINGView, if you don't want to miss my next analysis or signals.
It's not financial advice.
Dont Forget, always make your own research before to trade my ideas!
Open to any questions and suggestions

DOT Will MOON Like UNI MartyBoots here. I have been trading for 17 years and I am here to share my ideas with you to help the Crypto space.
DOT will have have a nice move in very near future but watch the video to find out when it can moon . Very important information
It has very good structure and price action , it reminds me of how many other coins set up in the last Bull market before it went parabolic and of course similar to UNI that just mooned
Please watch the video for more information
have a great weekend

UNISWAP - UNI Is Going To MOON MartyBoots here. I have been trading for 16 years and I am here to share my ideas with you to help the Crypto space.
UNISWAP is a large player in the crypto market.
UNI looks beautiful and will continue to moon. This pattern is a large base breakout and is very powerful. Its a failed descending triangle.
This chart helps show you ALT Season is about to start.
The ALT Market is in its bottoming phase, be prepared. ALT Season is coming. This is the time when its possible to make life changing money .
Do NOT miss out on this coming bull market
MartyBoots


UNI/USDT Bullish ride boom from demand?🚀 uniswap
💎 Yello Paradisers! Dive into an electrifying opportunity with #UNIUSDT as it's showing some lively action within a trading range, signaling upcoming price action from the demand zone.
💎 Focusing on #UNISWAP, it's been acknowledging its short-term ceiling at a supply level of $6.630. We're setting our sights on a bullish breakout from the demand area at $5.570, assuming the price continues to rally at this critical level. Achieving this could catapult it through the supply barrier and onto a bullish path.
💎 Eager to seize all possibilities? Stay vigilant for any #UNI downturns below the demand zone. Should that happen, prepare for a strategic play: a bullish rebound from the deeper demand zone at $5.256, buoyed by significant liquidity. Falling further? Gear up for more challenges ahead.

UNI ANALYSIS (4H)structure according to bearish CH And iBOS is bearish.
The previous lows have all been cleared and the price has hit a support.
Now we need a range where there is a significant sell order to continue the decline.
We have marked the good area where there is a sell order on the chart. It is expected that the price will reach this range with fluctuations and then we will see a drop
For risk management, please don't forget stop loss and capital management
When we reach the first target, save some profit and then change the stop to entry
Comment if you have any questions
Thank You

Probability of growth for this currency in daily timeDue to the failure of the growth probability triangle with risk, reward 2 has been determined for this currency, which you can enter with capital management


UNIUSDTUNIUSDT is trading in strong bullish trend . The price was reacting well the support of inclining trendline.
Currently the price is trading at the apex of the triangle and is about to give the breakout of triangle and now retesting the broken level where it is also forming a local support zone and seems like the price may go for another leg higher.
If the breakout sustain to upside the optimum target could be 6.5
What you guys think of this idea?

UNI/USDT 4H Bullish (Long) Breakout
UNI is now trading around 6.0$. UNI is testing the upper resistance line of the descending triangle. So the Possible scenarios are If the price pumps up and breaks out of the triangle, we can see bullish momentum in it.
Otherwise If the price rejects from the resistance line, the price can move towards the lower support zone of the triangle.
Stay tuned with us for further updates

UNIUSD vs ETHUSD Price Relationship: Long PositionUniswap's price is closely related to Ethereums price, but UNIUSD often has a slight lag in price changes in relation to ETHUSD.
Recently ETH has made big gains on the 1D chart reaching previous high levels with indicators showing signs of being overbought; whereas UNIUSD, although making gains recently, is still showing signs of being oversold on the 1D timeframe with the potential for big profit with a well timed long position.
If UNIUSD were to reach previous high levels conservative targets would be ~$37.
