UNI/USDTBME:UNI Cup and Handle pattern target is $7.382
DEX coins can see a big run up, and BME:UNI is like the Bitcoin of all DEX coins.
Uniusdt

$UNI Uniswap's Falling Wedge... Break out?BME:UNI Uniswap's price action has been dwindling in a falling wedge...
Current price: $4.5
Only Two things can happen:
Uniswap can remain in the falling wedge and retest support around $3.2 or
BME:UNI Price action can break out of falling wedge to seek resistances: 5.9, 7.5, 9.8, 12.2

UNI ANALYSIS🔮 #UNI Analysis
💰💰 #UNI is perfectly trading in a descending triangle pattern.Also we can see a huge volume in last few weeks. And If there is a breakout in #UNI then we will get a huge bullish move. 🚀🚀
💸Current Price -- $5.398
📈Target Price -- $8.891
⁉️ What to do?
- We have marked crucial levels in the chart . We can trade according to the chart and make some profits. 🚀💸
🏷Remember, the crypto market is dynamic in nature and changes rapidly, so always use stop loss and take proper knowledge before investments.
#UNI #Cryptocurrency #DYOR

Long trade setup for UNIUSDTFor the BINANCE:UNIUSDT.P Long Trade Setup, the following values are suitable for our interval trade:
Entry: 1.340
Target: 1.393
Stop: 1.306
Cost Reduction: -
The profit is reasonable relative to the risk.
*This is not investment advice; you can lose money. Crypto AI Signals is not responsible for any trades. 🚫💰

Uniswap (UNI) Fluctuating Between The Support Level Despite Uniswap (UNI) exhibiting a rather muted response to Bitcoin's October gains, it has seen a significant uptick in the last few days, surging 20% and setting a new local high at $4.92.
UNI is currently fluctuating between the support level of $4.48-$4.57 and a resistance corridor of $4.78-$4.92. If this positive trend continues, echoing Bitcoin's chart movements, Uniswap's token is likely to maintain its ascent.
The next targets for buyers are the psychological level of $5 and the $5.2 mark. In case of a correction, UNI could test the support levels at $4.31 and between $4.10-$4.22 without disrupting the prevailing uptrend.
UNI: Channel Down BreakoutUniswap (UNI) technical analysis:
Trade setup : Bullish breakout from Channel Down pattern could signal that buyers have absorbed all the supply from sellers and price is ready to resume an uptrend. Conservative traders could wait for confirmation: price breaking above 200-day moving average ($5.00). Upside potential to $6.50 next. Uniswap is the biggest DEX – see On-chain data, and has been a beneficiary of the FTX fallout as more traders move to decentralized exchanges and non-custody trading solutions.
Trend : Uptrend on Short-Term basis and Downtrend on Medium- and Long-Term basis.
Momentum is Bullish (MACD Line is above MACD Signal Line and RSI is above 55).
Support and Resistance : Nearest Support Zone is $4.00, then $3.65. The Nearest Resistance Zone is $4.75 (previous support), then $6.50.

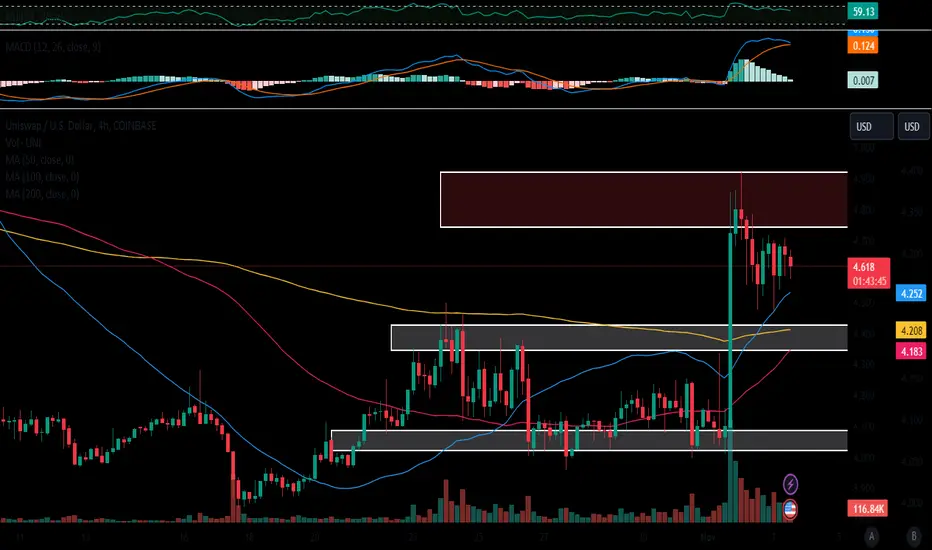
Brief Analysis——UNIWhen BTC does not give back its gains quickly after rising, Altcoins will experience a pump. Yesterday BTC exceeded 35000, and many DEX tokens experienced pumps. Among these, UNI gained 15% yesterday.
As a DEX emission token, it has been under huge selling pressure for a lot of time. DEX users have obtained a large number of tokens through staking or providing liquidity. When the market is not bullish, tokens are often swapped in exchange for stablecoins. Except for UNI, emission tokens such as CAKE and JOE maintain a decline with fluctuation most of the time.
Uniswap is the pioneer and leader of DEX. But it has also run into some trouble recently. The first is that the front-end platform will charge a 0.15% fee for some specific pair. A total of US$630,000 in fees has been collected so far, and this part of the income has nothing to do with UNI holders, which has hit the holders. On the other hand is the UniV4 feature. Although the new Hook function improves customization, it remains unclear whether it is truly decentralized. These will all affect holders’ enthusiasm for Uni tokens.
Returning to the analysis, we can see that although BTC has experienced an increase of more than 200% in 2023, UNI has maintained a decline with fluctuation. It entered a bearish trend again starting in late August. Although there was a bottom-buying sentiment on the MBF indicator in mid-October, nothing changed in the subsequent movements. The ME indicator still maintains the yellow bearish trend. Judging from the WTA indicator, after the bottom-buying sentiment appeared (in the first green area), the bulls strengthened, and the blue column representing the whale began to appear. After that, UNI began to experience a correction. At this stage, as we mentioned above, Uniswap began to charge service fees, but they were not used to incentivize Uni holders. Whales participated in the trade as the price declined, eager to close long positions. Now it have been pumping again and we are seeing the whales return.
If on a subsequent move the whale decreases again and a destructive candle appears (long red candle or with long upward pin-bar), then the bullish trend may be terminated for the emission token UNI.
Disclaimer: Nothing in the script constitutes investment advice. The script objectively expounded the market situation and should not be construed as an offer to sell or an invitation to buy any cryptocurrencies.
Any decisions made based on the information contained in the script are your sole responsibility. Any investments made or to be made shall be with your independent analyses based on your financial situation and objectives.

UNIUSDTHi my friend
This is my point of view. I would be happy if you follow me and leave your comment
BINANCE:UNIUSDT

Bitcoin decopule with US10Y ? Where to look in bull cycle ?It has been commonly accepted that when yields and rates rise then higher risk assets should fall in value as money is tempted by yield returns
This relationship seems to be getting tested as Bitcoin and US10Y moves up together. It does give impression that bitcoin is not as risky as potentially imagined and can be seen as a flight to safety or "quality" to quote Fink.
If bitcoin continues then it is commonly accepted that it will lead out smaller caps in the cryptosphere
Its important to note that Bitcoin (on average) moves first. Why this is important is because it flies in the face of those who say Bitcoin will give less return then 'X' coin because in the very end X will ultimately move up more in % terms. However, if Bitcoin (on average) leads out the rest then the opportunity to reallocate lays mostly with those holding bitcoin. If you have to wait and watch as the rest of the market booms to see smallcap X coin eventually make its move.. then you have little chance of redistribution and any compounding. Whereas Bitcoin holders can take profit during btc move and redistribute into smallcap X coin pre its own breakout and essentially compound growth in that cycle.
Where after Bitcoin?
I believe that safe bets beyond Bitcoin that will move well post bitcoin runs are the sub sector monopolies within the cryptosphere. Coins that dominate their sector. Clear example is Uniswap's UNI.

UNI SHORT SIGNAL Hello dear traders
I hope you are well
In the uni currency, the price has hit the swing resistance level in the 15 and 30 minute time frames
Considering the decrease in momentum in the price of this currency, we can think about short positions
The loss limit and final profit limit are specified in the chart.
I hope you use this signal

UNI ☀️ Ahead; Slightly Bullish Trend Over 24-Hr Horizon Cloudy ☁️, slightly bearish trading conditions will linger over the global crypto market in the next 24 hours. Sunnier ☀️ slightly bullish conditions will, however, prevail over Uniswap, Cardano, and Chainlink, according to ATTMO’s forecasts.
Over a one-week horizon, a mixed picture arises. The sun ☀️ will return and shine over Bitcoin, Litecoin, Cardano, and Uniswap. Other altcoins including Ether, XRP, and Binance face bearish clouds ☁️ and downside risks. Avalanche may even face stormy ⛈️ trading conditions, signaling the risk of a very bearish trend.
Follow us for more crypto weather reports!

Big Technical Alert on Uniswap (UNI)These technical data points can be extremely powerful
Its not a holy alert and can change in time too as the current monthly candle has not yet closed. That said the current data offers an interesting bit of potential and very worthy of getting a technical alert on.
When price is able to recover and reverse then the follow thru can be fast
Failed moves fail fast. This can be seen time and time again. Of course it too isnt holy but is a very powerful bit of technical data to look out for. As price recovers and the trend swings then people seem like they want to rush in and catch the changing tide.
Is this happening right now with UNI?
I cannot be sure Im still searching for that damn crystal ball. We interested understand that there can be a big move incoming and keeping an eye out for interesting opportunities that offer low risk can be part of the why were interested.
Keep an eye on how it develops
Could be a different set of circumstances tomorrow.. be like water to the changes in the flow (of data)


UNI SWING SIGNAL WITH TERIGER LONGHello again dear traders
UNI currency is located on a pivot support zone in high timeframes such as daily
Also, a decrease in sales momentum can be seen in the 12-hour time frame with an upward divergence
You can enter long trades with your own trading style with the entry trigger.
Thank you for your support
I would be happy if you could comment your opinion.

UNIUSD - Down Channel UNIUSD on this 4Hr chart is currently within a down channel
Some promise of recovery is possible along the green diagonal line if price decides to double bottom.
Until this happens we are stuck in a down channel.

Brief Analysis——UNIAlthough BTC led most tokens to usher in a pump, the next day red candle covered the gains of most tokens. Today's brief analysis will continue the review of previously analyzed tokens. What we chose today is UNI and 1inch.
We conducted a brief analysis of UNI in mid-July. It is believed that the high probability of the rise has not ended. As we thought, the price rose and broke the given resistance level. And after the bears strengthened, it returned below the given resistance level. The long red candle on Aug. 2 means that the bears was starting to attack. After that, UNI fell, broke through the given support level downwards, and came to near the lower rail of the gray range.
This week, the bulls started to strengthen and the price rebounded. However, whether it is from the trading volume or the length of the green candle, it can be seen that the power of the bulls is still very weak. It is just a normal rebound after the bears decay. On Tuesday, UNI formed a long green candle due to market-driven effects. One day later, long red candle covered the gains brought by the pump.
Conclusion: The high probability decline has not ended. UNI remains neutral on a large scale. The bears are stronger than the bulls, who barely gain strength after the price approaches the green dotted line. So we come to this conclusion. We set new resistance level at 5 and support level at 4.
Disclaimer: Nothing in the script constitutes investment advice. The script objectively expounded the market situation and should not be construed as an offer to sell or an invitation to buy any cryptocurrencies.
Any decisions made based on the information contained in the script are your sole responsibility. Any investments made or to be made shall be with your independent analyses based on your financial situation and objectives.

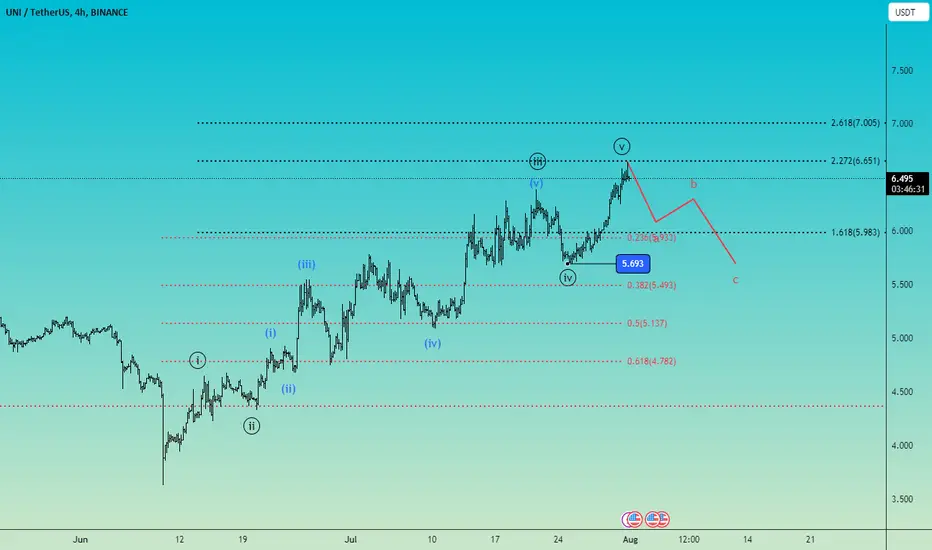
Uniswap intraday 4H, Elliott wave countAfter 5 waves to the upside expecting a correction for wave 2 that may keep the prior 4th wave pivot and than to continue up with a 3rd wave.
Future updates will be posted as updates to this count.
Daily intraday updates on 1H and 4H time frame, don`t miss them!!
Good luck!
UNIUSDTThe conditions of the BINANCE:UNIUSDT are as follows:
Over the past 50 days, we have witnessed an uninterrupted 85% price growth.
Most of the resistance lines we assumed for UNI turned out to be weak, and the price easily surpassed them.
However, now we are approaching the 0.786 Fibonacci retracement level, which is located at a price of $6.75. In my opinion, this point, or $7, could potentially lead the price back to $6, and then $5.30.
At the $6 price point, we have strong support. However, between $5.80 and $5.35, there is a fear value gap(FVG), which could guide the price to those points and cause a price drop.
Also, in the 4-hour timeframe, we are witnessing a divergence in the RSI (Relative Strength Index) indicator, which can be an initial signal of a trend reversal.
But we need to wait and see how the market reacts to the $6.75 price level.
Ultimately, everything depends on the overall market conditions.

UNIUSDTUniSwap is in a good position to sell, the first target is -6%, the second target is -14%.
good luck

UNIUSDTAccording to chart after two unsuccessful times for breaking up the broken support its time to take action on short position.
I'm bearish at the moment.

From Support to Surge: A Look at #UNIUSDT's Ascending Channel💎 Paradisers, the mid-term price action for #UNIUDT remains optimistic, as we continue to observe a pattern of higher highs and higher lows. What's more, #UNI has recently retested and rejected the vital demand zone near $5.7 for the third time in a row. It's evident that the bulls are holding their ground, and this could lead to a powerful surge shortly.
💎 We must also consider the bounce off the 50% Fibonacci retracement level, intriguingly situated right in the supply/demand area. Furthermore, #UNI continues to trade above the 200 Simple Moving Average on the 4H timeframe, once again displaying its bullish intentions.
💎 In terms of immediate resistance, the peak of the ascending channel could be the first area for profit-taking. However, if the price breaks above the channel with robust buying pressure, we could witness a much more potent trend in the upcoming weeks.
💎 Of course, this bullish outlook would be negated if the bulls fail to defend the demand zone, but as of now, #UNI appears quite bullish. Stay tuned for more updates and happy trading, Ladies and Gentlemen of ParadiseClub!

long UNIBME:UNI bounced off the ascending trendline. Bullish movement to resistance level at $6.64 is expected to happen.

Finally Breakout above the Descending Trend Line | New CycleWeekly Chart
UniSwap BINANCE:UNIUSDT was under the descending trend line, you can see that on Weekly Chart
Daily Chart
Last week, Uniswap has broken out resistance and now it's trading at 6.42x
Uniswap has support zones around 6.1
Wait a retest and join Defi's trend
