UniversOfSignals | Ethereum – The Never Ending Bear Trend?👋 Welcome to the UniversOfsignals channel!
Current Market Structure – Bearish Trend Dominates
Ethereum (ETH) is currently in a well-defined downtrend, consistently rejecting imbalance zones (highlighted in blue on the chart). Each time price reaches one of these zones, we see a rejection followed by a move lower. This has been a repeated pattern, confirming that sellers remain in control and that ETH is struggling to gain any meaningful bullish momentum.
The presence of a clear descending trendline further supports this bearish structure, as ETH continues to respect this resistance and fails to break higher. Until we see a strong shift in price action, the trend remains intact, and lower prices are likely.
Rejection of Imbalance Zones – No Bullish Confirmation Yet
The imbalance zones act as strong resistance, and so far, every attempt to push above them has resulted in rejection. This means that until one of these imbalance zones is invalidated (i.e., price breaks and holds above one), we cannot consider any bullish scenario.
Each rejection strengthens the bearish case, reinforcing the idea that ETH is likely to continue making lower lows and lower highs. Unless buyers step in with significant strength and push ETH beyond a key resistance level, the safest approach is to assume that the downtrend will continue.
When Can We Consider a Bullish Scenario?
For ETH to turn bullish, we need to see at least one of the following:
Breakout above an imbalance zone – This would indicate a shift in market structure and potential strength from buyers.
Higher highs and higher lows forming – A sign that momentum is shifting away from the current bearish trend.
Price reclaiming key resistance levels – If ETH can reclaim lost ground and sustain above it, it may indicate a potential reversal.
Until one of these conditions is met, there is no reason to be bullish. Any upside move that fails to break a key resistance should be considered a shorting opportunity rather than a bullish reversal.
Key Bearish Confirmation – Lower Prices Expected
As long as ETH keeps rejecting imbalance zones and making lower highs, the market structure remains bearish. The next downside targets are likely to be the previous support levels, with price potentially dropping towards the $1,600-$1,500 range if selling pressure continues.
The projected red price movement on the chart suggests that ETH could consolidate for a bit before continuing its descent. This aligns with the current trend and price behavior.
Historical Context – ETH at 2-Year Lows
ETH is currently trading at a price level last seen two years ago, reflecting significant weakness. Despite temporary rebounds, price action remains suppressed, and we are not seeing the kind of momentum that would indicate a strong recovery.
While some may view this as a “cheap” buying opportunity, the reality is that ETH is showing no bullish strength in its current price action. Without a confirmed trend reversal, simply being at a low price does not make it a good buy. Catching a falling knife is risky, and it is better to wait for confirmation before considering long positions.
Final Thoughts – Patience is Key
ETH remains in a strong bearish trend, and every rejection confirms lower prices.
No bullish confirmation yet – price needs to break a key level before we consider upside potential.
Expect further downside unless market structure changes.
ETH is at historical low levels, but low prices alone do not mean bullish momentum is coming.
As traders, the best approach is to wait for confirmation and trade with the trend. Until ETH proves otherwise, the bearish structure remains dominant, and downside targets remain in play.
__________________________________________
Thanks for your support!
If you found this idea helpful or learned something new, drop a like 👍 and leave a comment, I’d love to hear your thoughts! 🚀
Make sure to follow me for more price action insights, free indicators, and trading strategies. Let’s grow and trade smarter together! 📈
Also let me know if you want to see a chart of another coin. I will create it for you.
Universofsignals

UniversOfSignals | NEAR: Weekly Timeframe 👋 Welcome to UniversOfSignals !
Today's analysis will focus on NEAR, a Layer 1 and AI crypto project with a market cap of $3.17 billion, ranking 31st on CoinMarketCap.
📅 Weekly Timeframe
In the weekly timeframe, as you can see, following an upward leg from $0.993 to $8.298, a range box formed over a year from $3.615 to $8.298. Recently, with the market's downturn, the price finally broke below this box's floor at $3.615.
✅ Currently, the price has pulled back to this area after breaking $3.615 and has dropped to $2.574, where it's currently forming a supportive green candle.
⚡️ The $2.574 area is robust, showing positive price response, and it remains to be seen what happens next. If this support breaks, the price could move towards lower areas like $1.830 and $0.993.
🔑 Conversely, if the price can sustain this support and move above $3.615, a significant upward momentum could enter the market, potentially driving the price at least up to $8.298. A break above $8.298 could see the next target at $16.839.
📊 Market volume has increased following the range break, which is natural as the price has finally moved out of a range, and increased volume has entered. Continuation of this volume increase could heighten the likelihood of breaking $2.574.
📝 Final Thoughts
This analysis reflects our opinions and is not financial advice.
Share your thoughts in the comments, and don’t forget to share this analysis with your friends! ❤️

universOfSignals | NEAR: Breaking Boundaries in Layer1 AI Crypto👋 Welcome to universOfSignals !
Today's analysis will focus on NEAR, a Layer 1 and AI crypto project with a market cap of $3.17 billion, ranking 31st on CoinMarketCap.
📅 Daily Timeframe
In the daily timeframe, we can observe more detailed price movements.
💫 As seen, the main support at $3.615 has broken, and subsequently, a price box formed between $2.804 and $3.615. Coinciding with an RSI divergence, the floor at $2.804 broke, and the price dropped to $2.161.
🎲 Currently, the price is correcting back towards the $2.804 area. Market volume is rising, and the RSI divergence trigger has not yet been activated, indicating ongoing bearish momentum.
💥 If the RSI breaks the 50 area, the divergence could impact the market and eliminate the bearish momentum. This would be the first sign of a trend change, but the main ceiling at $3.615 must be broken to confirm a trend reversal.
📉 For short positions, breaking the $2.161 area is suitable, and if this area breaks, the price could drop to $1.682. For long positions, breaking $2.804 is a risky trigger, with the main trigger at $3.615 for a more solid position.
📝 Final Thoughts
This analysis reflects our opinions and is not financial advice.
Share your thoughts in the comments, and don’t forget to share this analysis with your friends! ❤️

Univers Of signals | HBARUSDT Better Condition Than the Market!👋 Welcome to the Univers Of signals channel!
Let's go together and examine one of the popular coins in the market that has experienced less correction recently and is in better condition than other altcoins!
📊 Weekly Timeframe
We go to the weekly time frame and see that hbar's condition is much better than other altcoins, and this is precisely due to the entry of momentum and Bitcoin's bullishness!
After we broke through the support at 0.04339 and engulfed the previous weekly candle, it was a bullish sign, and after the trigger at 0.06219 was activated, we broke this resistance and momentum entered this coin!
If you made your purchase in the spot section from this level, the situation is okay for now, but you can save profit or withdraw the principal capital. If you want to re-enter, you can make your purchase after the 0.33056 break.
📈 Daily Timeframe
In the daily time frame, we have higher levels and a better situation than the rest of the coins, and in a situation where most altcoins are forming lower bottoms, this has not even lost its main level.
After the 0.06470 and daily box break, we experienced a movement of about 500%, and if we draw a Fibonacci, we are currently at the 0.382 level, and this in itself increases the importance of this level! If the 0.37350 ceiling is broken, it shows us that we are going to experience a new movement!
This daily candle can be a good trigger to buy again, and the reason is that we are rising from a good support level and it is also a good Fibonacci level, but this trigger is risky and after the break of 0.26486 it will be a better trigger to welcome, and for a temporary exit, you can also temporarily exit with a break of 0.18653.
📝 Final Thoughts
Stay calm, trade wisely, and let's capture the market's best opportunities!
This analysis reflects our opinions and is not financial advice.
Share your thoughts in the comments, and don’t forget to share this analysis with your friends! ❤️

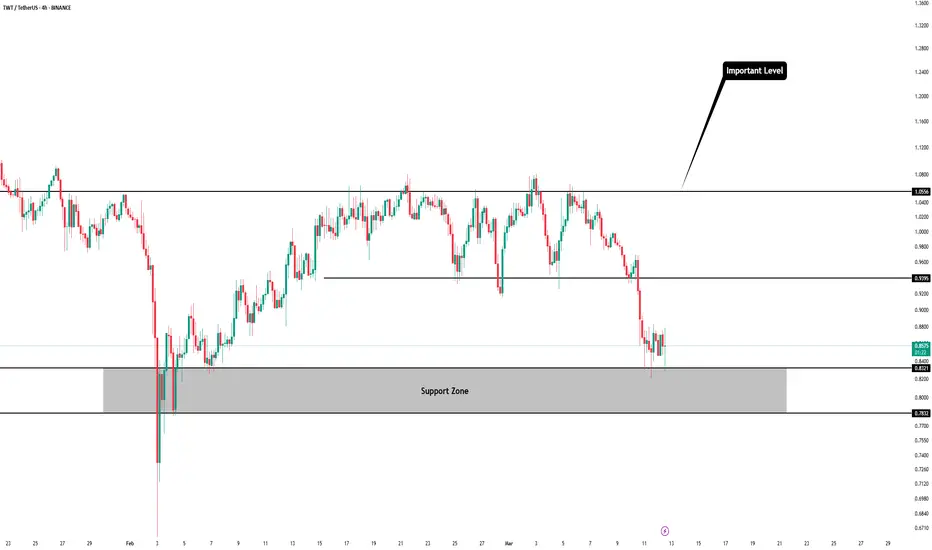
univers Of Signals | TWT: Navigating Trust Wallet's Market Moves👋 Welcome to univers Of Signals !
In this analysis, I'll be reviewing the TWT coin, a part of the Trust Wallet project, which is currently ranked 126th on CoinMarketCap with a market cap of $358 million.
📅 Daily Timeframe
As you can see in the daily timeframe, we're observing a very large range box from 0.7832 to 1.5725, where the price is currently near the bottom of this box.
✅ The floor of this box is a significant support range from 0.7832 to 0.8321 and is acting as a demand zone for the price.
🔽 Currently, the price has reached the 0.8321 area, tested it once with a shadow, and received support from it. If this area breaks, we'll enter the support zone, and we'll need to see how the price reacts to this zone.
📊 The market volume is very low, and for now, it seems there isn't enough strength and momentum in the market to break this area, but if a selling volume enters the market and the RSI goes into oversell, the likelihood of breaking this area increases. In this case, the next support will be at 0.6215.
🛒 For buying this coin, I recommend waiting until it exits the range box it has created, as this would indicate upward momentum entering the market. Currently, there is no momentum in the market. Thus, the best trigger from my perspective is the breakout at 1.5725.
📈 However, for a long position or a risky spot purchase, you could enter upon the breakout of 1.0556. I mainly consider this trigger for futures, and for spot purchases, I would wait until the main resistance is broken.
⏳ 4-Hour Timeframe
In the 4-hour timeframe, as you see, we had a box between 0.9395 to 1.0556, which has been cleanly broken from below, and you could open a short position with price consolidation below this area.
💥 Currently, the price has reached the next support at 0.8321 and has shown some reaction. The RSI is currently in oversell, and if it receives support from this area, it could return to the normal range.
📉 For short positions, the triggers at 0.8321 and 0.7832 are suitable. The 0.8321 trigger is riskier, and I suggest waiting until the 0.7832 support is lost before opening a more secure position.
🔼 For long positions, there's a very suitable ceiling at 1.0556, and breaking this area could lead to opening a long position.
📝 Final Thoughts
This analysis reflects our opinions and is not financial advice.
Share your thoughts in the comments, and don’t forget to share this analysis with your friends! ❤️
Univers Of Signals | SUI👋 Welcome to Univers Of Signals Channel!
Let's analyze and review one of the most popular coins in the market, sui, and update our previous analysis and find new triggers
🌐 Bitcoin Overview
Before starting today's altcoin analysis, let's look at Bitcoin on the 1-hour timeframe. Since yesterday, Bitcoin experienced a correction, which was necessary for the market, and it pulled back to the 102135 range. The next trigger for a long position will be a breakout above 104714.
Yesterday's correction, coupled with an increase in Bitcoin dominance, caused noticeable declines in some altcoins. This highlights the importance of monitoring BTC pairs in your checklist these days.
📊 Weekly Timeframe
In the weekly time frame, it is one of the coins that is in good condition, it is really in the market and is still fluctuating on the high support levels.
After hitting 5.24, we made a new ceiling or ATH, and after that, due to recent market news, we experienced some drops, and this has also caused the price correction of this coin.
For re-buying, if we make a good support candle at this level 2.4, it will be a good trigger and the main trend will start again after we break 5.24. Also, after breaking 1.77, we can temporarily exit this coin and cash out!
📈 Daily Timeframe
In the daily time frame, it has been in relatively good conditions compared to other coins in the market and has experienced fewer declines and still has a lot of support to lose!
After breaking the 1.0333 level, which was our trigger spot, we made our purchase and experienced a move after its failure with the entry of momentum and recorded a new ceiling with this event!
Along with this trend, we can draw our Fibonacci levels, which are currently involved in the important level of 0.382, and after it rises and breaks the ceiling of 5.24, we can experience a powerful move!
If this level is broken, we can also hit the support levels of 1.7702 and 1.3859 and we need to form a structure to buy now, but after breaking the trend line and the 3.65 trigger, it can be a good point! For selling, I will continue to hold for now!
📝 Final Thoughts
Stay calm, trade wisely, and let's capture the market's best opportunities!
This analysis reflects our opinions and is not financial advice.
Share your thoughts in the comments, and don’t forget to share this analysis with your friends! ❤️

Univers Of Signals | Bitcoin Daily Analysis #24👋 Welcome to Univers Of Signals !
Let's dive into the analysis of Bitcoin and other key cryptocurrency indicators. In this analysis, I want to review the important futures triggers in today's New York session.
⏳ 1-Hour Timeframe
Before we start the analysis, let's review the positions we could have opened yesterday. I mentioned that if the area of 83151 was breached, you could enter a short position. As you can see, that happened, and the candle stabilized below this area, and I opened a short position which then hit the stop loss.
⚡️ However, after this occurred, we observed a very strong support candle at this level, which caused this break to be a fakeout, and the price started to move upwards. If you recall, I mentioned that if the price could stabilize above the ceiling, a new upward leg could start, which is why I had placed a stop buy above this area. With the fakeout of the lower support, this stop buy was triggered, and the price began its upward movement.
🧲 Currently, as you can see, the price has also passed the 0.382 Fibonacci area, breaking through it and moving upwards. An important resistance that we had previously charted was at 89318, which, as you see, the price is stabilizing above. If this happens, we could see the price potentially reaching back up to 94355. It's challenging to give a trigger for today because our main trigger, the 0.382 Fibonacci area, has unfortunately been activated in recent candles.
📊 We need to wait for the market to form a structure now. If the break of either the 89318 area or the 0.382 Fibonacci turns out to be a fake, you could consider finding a trigger in lower time frames to open a short position. The reason is that the price is making a lower high compared to 94355. But overall, be cautious about opening risky positions on Bitcoin today and tomorrow because Trump's speech on Friday could move the market significantly, and the market might be less volatile in these two days.
👑 BTC.D Analysis
Looking at the Bitcoin dominance, it continues to range between 60.40 and 61.41. As you can see, it's really hard to predict the movements of the dominance as it's mostly ranging between these two levels.
🔼 Currently, it's moving towards the upper limit with a green candle. A higher low has been made compared to the 60.40 area, which increases the chances of breaking out from the top of the box.
🔍 If this occurs, the next resistances are at 62.19 and 62.66. If Bitcoin dominance rises, and the market drops, altcoins will likely fall significantly. If the market rises, Bitcoin might perform better than altcoins.
📅 Total2 Analysis
As observed, we saw an upward movement in Total2 yesterday after consolidating above the 1.07 area, starting a new upward leg. Currently, this index has reached the resistance at 1.13, and we need to wait and see if it can break this area. Currently, the trigger for a long position is precisely this break of the 1.13 area.
🧩 If this area is breached, the price could move to further resistances at 1.18 or even 1.23. However, if Total 2 is rejected from this area, we might expect another drop, potentially reaching back down to 1.01.
📅 USDT.D Analysis
As seen, yesterday after USDT.D pulled back to the 5.30 area and failed to consolidate above it, we witnessed a significant drop. This initial downward leg saw the price even rise above the 5.08 area, and this morning, after pulling back to this area, as you can see, dominance continues to trend downward with the next significant support at 4.82, which I believe could be reached.
🎲 I don't have much else to say about this dominance because I don't have any specific triggers for today.
📌 Overall, I don't have any specific triggers in the market today; we had one yesterday that was activated, but today I can't specify any particular triggers for you, and it's better to be an observer and wait for significant news from the US, especially the meeting that Trump is expected to hold on Friday, which could be very decisive for the market's future.
❌ Disclaimer ❌
Trading futures is highly risky and dangerous. If you're not an expert, these triggers may not be suitable for you. You should first learn risk and capital management. You can also use the educational content from this channel.
Finally, these triggers reflect my personal opinions on price action, and the market may move completely against this analysis. So, do your own research before opening any position.

Univers Of Signals | JUPLet's quickly review JUP, one of the DeFi coins, which is currently ranked 51st on CoinMarketCap with a market cap of $1.75 billion.
🔍 In the 4-hour timeframe, we are observing a very large range box from 0.6312 to 1.2542, where JUP is currently at the bottom of its box.
✨ There is also a descending channel that has been accompanying the price from the top of the box, with several touches to both the bottom and top of the box, and now it has approached the bottom of the box again.
📉 If the area of 0.6312 is breached, you can enter a short position targeting 0.5588. Entry of the RSI into the oversell zone would provide a suitable confirmation for this move.
📈 For a long position, wait until the channel is broken upwards, and in this case, with the breakout of the trigger at 0.8365, you can enter a long position.

UniversOfSignals | Bitcoin Daily Analysis #21Today, we're going to dive into the analysis of Bitcoin and the crucial crypto indices. I will review the significant futures triggers for today's New York session. The market conditions haven't changed much from yesterday and continue to range between 83,779 and 87,070.
⏳ 1-Hour Timeframe
In the 1-hour timeframe, as you can see, I've outlined the Fibonacci levels because it seems that the previous bearish leg has ended, and the market is ranging, preparing for either a trend reversal or the next bearish leg.
🔄 Yesterday, I mentioned that it appeared the price was pulling back to the SMA 99 and that if the trigger at 83,779 was breached, we could confirm a pullback to the SMA 99 from the market. As you see, this did not happen, and the trigger at 83,779 was not activated.
🔍 As observed, there is a cross between the SMA 99 and the SMA 25, which has led the market to start ranging. Currently, there's a very important PRZ (Potential Reversal Zone) above the price, overlapping with the 0.5 Fibonacci zone and the resistance at 87,070. This makes it a critical area, and I suggest you stay behind the chart to see how the price reacts to this area.
🔽 If the price gets rejected from this area, we can take an early trigger for a short position, and if this area is breached, you can proceed to take a long position. However, be mindful that today is Sunday, and as you can see, the market volume has significantly decreased. This happens because the bearish leg has ended and the market is correcting, but also because it's Sunday and during weekends, market volume typically decreases. I recommend keeping an eye on risky positions such as the one at 87,070 during holidays or when the market volume is low.
⚡️ However, there are areas that are still good for opening positions even on holidays like Sunday when the market volume is low, such as the area at 83,779. In my opinion, this could cause the price to move towards its next bearish leg if this area is breached, so even if the market volume is low and it's a holiday, I think if this area is breached, significant selling volume will enter the market and for this reason, I try to keep a short position open if this area is broken.
💥 The RSI oscillator, as you see, has moved above the 50 area, and breaking this area could be a good momentum confirmation for opening a short position. If the RSI enters the oversell area, we can have momentum confirmation for the start of the next bearish leg.
👑 BTC.D Analysis
As you can see, I had marked a trigger at 61.21 yesterday, which the price didn't manage to break convincingly, showing little respect for this area, so I have removed this line. Currently, it seems that Bitcoin dominance is ranging between 61.91 and 61.49, and I believe that sooner or later, the large box ranging from 60.48 to 62.19 will be broken.
✨ If this break is from above, Bitcoin dominance could even experience more bullish legs, increasing Bitcoin's dominance in the market. However, if dominance breaks from below and the market turns bullish, altcoins could perform very well.
🔼 The trigger for today's dominance is that if 60.91 is broken, we can confirm a bearish turn in dominance, and conversely, if 61.49 is broken, we can confirm a bullish turn.
📅 Total2 Analysis
As you see, Total2 was supported from 1.01 and has moved upwards to 1.09, where it is currently being rejected. The SMA 99 in Total2 has also reached the price, and the price has reacted to it.
📉 We have a very risky trigger for a short position on Total2, which is the break of 1.06; this position is very risky and can be opened as a scalp in lower timeframes.The primary target I can consider for this position will be the area of 1.01.
📅 USDT.D Analysis
As you observe, Tether's dominance was rejected from 5.21 and could not stabilize above this area, creating a very small ranging box between 5.08 and 5.21. Currently, it's near the area of 5.08, and if this area is broken, dominance could drop to 4.92.
🎲 This drop would likely boost the market upwards, and if this area is broken, depending on Bitcoin's dominance, you can decide to open positions on altcoins or Bitcoin.
💫 Conversely, if dominance is supported from this area and moves towards 5.22, and if this area is broken, you can open short positions on altcoins or Bitcoin.
❌ Disclaimer ❌
Trading futures is highly risky and dangerous. If you're not an expert, these triggers may not be suitable for you. You should first learn risk and capital management. You can also use the educational content from this channel.
Finally, these triggers reflect my personal opinions on price action, and the market may move completely against this analysis. So, do your own research before opening any position.

UniversOfSignals | MKRUSDT 70% Move?Let's analyze and review one of the best coins in the DAo area together and find another entry point together and update our previous triggers
🌐 Overview Bitcoin
Before starting today's altcoin analysis, let's look at Bitcoin on the 1-hour timeframe. Since yesterday, Bitcoin experienced a correction, which was necessary for the market, and it pulled back to the 102135 range. The next trigger for a long position will be a breakout above 104714.
Yesterday's correction, coupled with an increase in Bitcoin dominance, caused noticeable declines in some altcoins. This highlights the importance of monitoring BTC pairs in your checklist these days.
MakerDAO’s sharp increase in fees and growth in Total Value Locked (TVL) has fueled demand. On February 20, $156.77 million of MKR was burned, reducing supply. Growth in active addresses and trading volume has driven the price higher. Strong resistance at $1,800 may limit further growth. MakerDAO’s emergency offering has raised concerns about $3.1 billion USDC exposure.
📊 Weekly Timeframe
In the weekly timeframe, the token has seen a 95% gain on the coin, which is a good sign in these market conditions!
Also, in this timeframe, we are in an opening triangle, which is characterized by high volatility, and we are constantly moving towards the bottom and top of this triangle, regardless of the ceiling and floor or support and resistance, and the exit from this triangle will also be sharp.
In this timeframe, we did not have a trigger in advance to say that we could buy or anything else, and it moved very sharply. If you lose, it is normal and do not blame yourself and your strategy.
After exiting this triangle and breaking 2.182, we can have a good trigger to buy, and for now, if you bought and held during this fluctuation and are in profit above 50%, it is logical to save profit, but if you did FOMO and bought, it is better not to continue trading and be busy watching the tutorial for now.
📝 Final Thoughts
Stay calm, trade wisely, and let's capture the market's best opportunities!
This analysis reflects our opinions and is not financial advice.
Share your thoughts in the comments, and don’t forget to share this analysis with your friends!

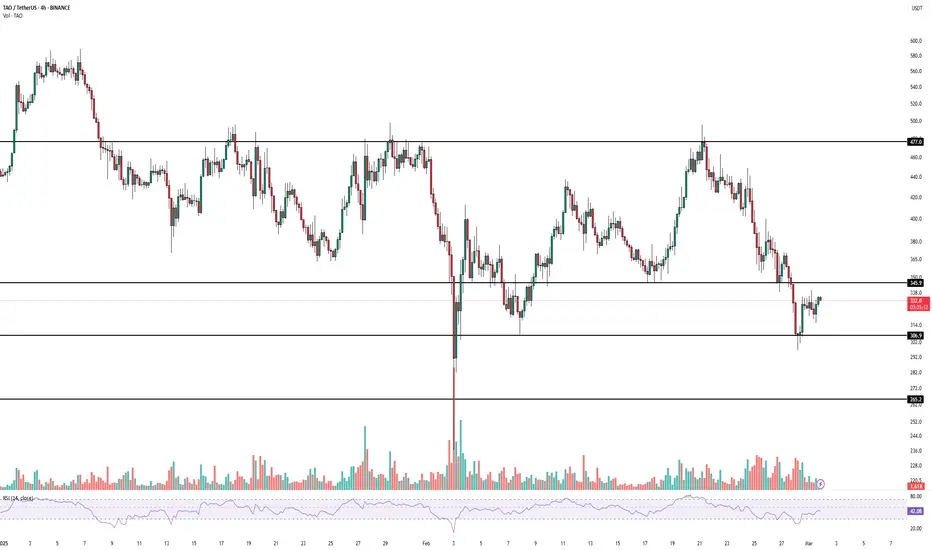
UniversOfSignals | TAO, an AI-focused cryptocurrency currentlyLet's take a quick look at TAO, an AI-focused cryptocurrency currently with a market cap of $138 million, ranked 36th in the coin market cap.
🥸 In the 4-hour timeframe, we are observing a descending range pattern with significant resistance at the area around 477. Every time the price attempts to rise, it gets rejected from this level. Recently, the support at 345.9 was broken, and the price has dropped to a lower level, reaching the support at 306.9.
⭐ The RSI oscillator has exited the oversell zone after completing a bearish leg and has returned to the normal range. The market volume appears to be decreasing, which is common on weekends.
🕯 If the support at 306.9 breaks and the RSI enters the oversell zone again, we could witness the next bearish leg down to the support at 265.2. If the price ranges today and tomorrow while the market volume is low and then breaks this support at the start of the new week, this breakdown would be more credible.
📈 As for long positions or buying, we need to wait until this bearish momentum exits the market and the price establishes a new structure. Therefore, I cannot provide a specific trigger for long positions at the moment.
UniversOfSignals | ONE: Key Levels and Market AnalysisIn this analysis, I want to review ONE, the token of the Harmony project. Harmony is one of the layer-1 blockchain networks and is considered one of the older crypto projects.
✨ The token currently holds a market cap of $205 million, ranking 198th on CoinMarketCap.
📅 Daily Timeframe
On the daily timeframe, as you can see, there is a large consolidation box between $0.01033 and $0.032724. In the last bullish leg, the price started from the $0.01033 low and moved up to the main resistance at $0.032724.
✅ It even broke above this level, reaching $0.04532, but was rejected and fell back into the range, turning this bullish move into a fake breakout.
⚡️ After returning to the range, the price first corrected to $0.02286. Once this level was broken, the next bearish leg pushed the price down to $0.01346. Currently, we are seeing a smaller consolidation box between $0.01346 and $0.01681.
🧩 Looking at the RSI oscillator, there is also a range between 37.05 and 50. A breakout in either direction could confirm the momentum for that direction. Naturally, a break below 37.05 would be a stronger confirmation for downside movement, as the market momentum is already bearish.
📊 If $0.01346 is broken, the price could move toward the bottom of the large range at 0.01033.If $0.01033 is broken, a new all-time low (ATL) is likely to be registered.
🔼 On the bullish side, if the $0.01346 support holds and the $0.01681 resistance is broken, we can expect the price to rally toward $0.02286 and possibly even $0.03274.
🛒 For spot buying, I prefer to wait until this coin shows strength against Bitcoin and Bitcoin dominance starts declining. My spot trigger is currently at $0.04532, and I will not enter a position before this level is broken.
⏳ 4-Hour Timeframe
On the 4-hour timeframe, the price remains within the same range as identified in the daily timeframe.
🔽 For a short position, if $0.01327 is broken, you can enter a short trade targeting the bottom of the range.
📈 For a high-risk long position, if $0.014825 is broken, you can target the top of the range, but this trade is very risky.The main long position will be confirmed if the price breaks above $0.01681.
🔑 Regarding indicators and oscillators, I don’t have much to say in this ranging market. Volume is also low, making it difficult to rely on momentum indicators in this sideways phase.
📝 Final Thoughts
This analysis reflects our opinions and is not financial advice.
Share your thoughts in the comments, and don’t forget to share this analysis with your friends! ❤️

UNIVERSOFSIGNALS| Bitcoin Daily Analysis #19👋 Welcome to UNIVERSOFSIGNALS !
Let's dive into the analysis of Bitcoin and important crypto indices. As usual, I will review today's future triggers for the New York session. Today's analysis will be conducted in the 4-hour timeframe, as the 1-hour timeframe does not provide the clarity of price information we need, and the 4-hour timeframe is better suited for today's analysis.
⏳ 4-Hour Timeframe
As you can see, after the price broke through the $95,108 area, we witnessed a significant drop on the chart, with the first bearish leg reaching down to $87,070 and subsequent legs moving to lower areas. Currently, the price has reached the support at $78,940 and has been supported there.
🔍 As you can observe, the volume of the price candles is very high compared to the green candles, which clearly indicates that the market's control is heavily skewed towards sellers.
✨ The RSI oscillator, after forming a Double Bottom in the oversell area and returning to the normal zone, re-entered the oversell zone yesterday, which led to another bearish leg after breaking the $83,779 trigger, which I had previously identified for you, and the price then proceeded to perform its next bearish leg.
💥 Currently, we have positions open from the $95,108 and $92,433 areas, and if you have been following and looking to open more positions, you would have also opened positions upon the breaks of $87,070 and $83,779. Given the sharp market downturn, you would have made a considerable profit by now.
✅ I suggest that if you have open short positions from any of the levels that were breached, to take profits and even close the position because it seems the market has completed its downturn and might start correcting or ranging.
🧩 The range I anticipate the price might oscillate within is between $72,940 to $82,700, but keep in mind that these analyses are my personal opinion, and the price could break the $78,940 area and perform its next bearish leg at any moment. In that case, I would personally open a short position and ensure to have a short position open in case of a break below $78,940.
🔽 Today, apart from this short trigger, I cannot give you another trigger. This short trigger is very risky, and you should open this position with the minimum risk your strategy allows.
👑 BTC.D Analysis
As observed in the 4-hour timeframe, BTC.D is currently forming a smaller box between the areas of 60.48 to 60.91 and continues to fluctuate within this box, so no specific trend can be predicted.
🔑 However, if the area of 60.48 breaks, we can be more hopeful for an altcoin rally, expecting that altcoins might recover some of the ground they have lost because, along with Bitcoin's ranging, Bitcoin dominance has been increasing, and altcoins have been bearish for several months.
📅 Total2 Analysis
Moving on to Total2, as you can see, Total2 was rejected from the crucial area of 1.13, which I mentioned before, and broke the 1.07 area, currently registering a floor at 1.01. This area was not historically significant, and the price has reacted alongside Bitcoin, so we need to see how Total2 moves.
⚡️ If the 1.01 breaks, you can open a short position, which I will also be doing. However, I will open this position only if Bitcoin dominance turns bullish, expecting further declines in altcoins if that happens.
🔼 For a long position, you need to wait until the price forms a new upward structure, and if it moves sharply upwards, you can enter on a break of 1.13.
📅 USDT.D Analysis
As I mentioned yesterday, there was a significant resistance area at 5.45 in USDT.D, where Tether's dominance was rejected from slightly higher at 5.50, and we are seeing a red candle which might indicate the start of a correction and the end of this bullish leg in dominance.
⭐️ The only trigger for a bullish scenario in USDT.D dominance and a market downturn is 5.50, and for a long position and a decline in Tether's dominance, there is no trigger at this moment.
❌ Disclaimer ❌
Trading futures is highly risky and dangerous. If you're not an expert, these triggers may not be suitable for you. You should first learn risk and capital management. You can also use the educational content from this channel.
Finally, these triggers reflect my personal opinions on price action, and the market may move completely against this analysis. So, do your own research before opening any position.

UNIVERSOFSIGNALS| SUSHI: Key Levels and Market Outlook👋 Welcome to UNIVERSOFSIGNALS !
In this analysis, I want to review SUSHI for you. SushiSwap is a DeFi protocol operating in the DEX sector, with its token currently ranked 195th on CoinMarketCap and a market cap of $58 million.
📅 Weekly Timeframe
On the weekly timeframe, we can see a consolidation box between $0.534 and $1.959. Since 2022, the price has been fluctuating within this range, forming a large consolidation zone, with multiple touches to both the upper and lower boundaries of this box.
🔍 As observed, in the last bullish leg, the price broke above the box's upper boundary with a large weekly candle. However, it quickly retraced back into the range after being rejected at $2.734, resulting in a fake breakout.
🧩 Currently, the price is near the lower boundary of the range at $0.534. If this support level breaks, the price could initiate another bearish leg and move toward a new all-time low (ATL). On the other hand, if the upper boundary of the box is broken and price stabilizes above it, we could see an upward movement in SUSHI.
⚡️ The largest and most significant resistance ahead is at $20.444, which is the all-time high (ATH). Reaching this level would be extremely difficult, as it would require a significant increase in market capitalization, meaning a substantial capital inflow into the coin.
✨ Let’s now analyze the daily timeframe to gain more insight into price movement.
📅 Daily Timeframe
On the daily timeframe, as seen in the last bullish leg, the price bounced from the $0.534 support and moved upward. After breaking $0.803, strong bullish momentum entered the market. Additionally, RSI reaching the oversold zone contributed to a stronger bullish push.
🔽 Following this movement, the fake breakout at $1.855 led to the start of a corrective and bearish phase, with the price initially declining to $1.347.
📊 After breaking below $1.347 and retesting it as resistance, the price entered another bearish leg, reaching $0.803. Currently, after some range-bound movement around this level, RSI has exited the oversold zone, and the price seems to be retesting this level as resistance.
✅ If RSI re-enters the oversold zone, the price could drop further to the lower boundary of the range at $0.534, which would not be a good sign for SUSHI. As observed, buying volume has significantly decreased, and most traders in this market are sellers.
🛒 For spot buying, I recommend avoiding this coin for now and waiting for a clear bullish structure to form. At a minimum, SUSHI should start showing strength against Bitcoin.
🧲 From a USDT perspective, if the upper boundary of the range ($1.855) breaks, then $2.734 could serve as a trigger for a buying opportunity.
📝 Final Thoughts
This analysis reflects our opinions and is not financial advice.
Share your thoughts in the com

UNIVERS OF SIGNALS| ASTR: Key Support Levels and Market Momentum👋 Welcome to UNIVERS OF SIGNALS !
In this analysis, I want to review ASTR, one of the coins in the Ethereum ecosystem, currently ranked 159th on CoinMarketCap with a market cap of $297 million.
📅 Daily Timeframe
On the daily timeframe, as you can see, the price is in a long-term downtrend. The first bearish leg started from the $0.1907 high and moved down to the $0.0505 level. After this move, the price formed a consolidation box between $0.0505 and $0.0813. Once $0.0505 was broken, the price dropped further to the key support at $0.0369.
⚡️ As highlighted on the chart, there is a critical demand zone near the $0.0369 level. If the price breaks below this zone, it could register a new all-time low (ATL), which could put serious pressure on the project’s outlook.
📊 As observed, market volume within the consolidation box was decreasing. However, after the breakout, volume increased. Now that the price is ranging again, volume is dropping once more. If RSI enters the oversold zone and breaks below the 30 level, the likelihood of breaking $0.0369 significantly increases, which could trigger a strong downward momentum, leading the price toward new lower targets.
📈 On the bullish side, if the $0.0369 support holds and pushes the price upward, the first long trigger we can consider is $0.0505. We can also confirm bullish momentum from RSI if it breaks above 54.14.
⏳ 4-Hour Timeframe
Now, let’s examine the 4-hour timeframe for a more detailed view of price action. As you can see, the price has formed a ranging box between $0.0369 and $0.0499.
🧲 At one point, the price attempted to break above this range, even forming a higher high and higher low, but failed. After a fake breakout, a double top pattern was confirmed, and when the neckline broke, the price moved downward, reaching the $0.0369 zone once again.
✅ This $0.0369 level remains crucial, as it could keep the price in the current range or push it upward once again.
🧩 However, as seen on the chart, green candles have significantly lower volume than red candles, indicating that bears still dominate the market. The possibility of breaking below this support remains high.
📉 For short positions, the break of $0.0369 would be a strong confirmation. However, keep in mind that below this level lies a strong demand zone, meaning that a reversal could happen at any time. It’s crucial to manage risk carefully when entering shorts.
🔼 For long positions, assuming the previous bullish move was a fake breakout, a break above $0.0419 would be a reasonable entry. However, a more secure long trigger would be at $0.0456.
📝 Final Thoughts
This analysis reflects our opinions and is not financial advice.
Share your thoughts in the comments, and don’t forget to share this analysis with your friends! ❤️
