BABA: triangle with tensionOn the weekly chart, BABA has already formed a golden cross - price is above both MA50 and MA200, confirming a bullish trend shift. The stock is now approaching the upper edge of the symmetrical triangle and the key resistance at $122, which also aligns with the 0.5 Fibonacci level.
The numbers inside the triangle represent the contraction phases, not Elliott waves. This is a classical consolidation before a potential breakout. If the $122 level is broken and retested, upside targets are $128 (0.618), $137 (0.786), and eventually $148–181 (1.0–1.618 extension).
Volume is rising, MACD is flipping bullish, and RSI is climbing out of oversold territory — all signs point to growing bullish momentum.
Fundamentally, Alibaba benefits from China's economic rebound, possible regulatory relief, and ongoing share buybacks. With Chinese tech rotating back into favor, BABA could lead the rally.
So if you're still waiting for a signal - it's already here. The golden cross is done, price is flying above moving averages, and all that’s left is a clean breakout. Watch $122 — that’s the launchpad.
Up

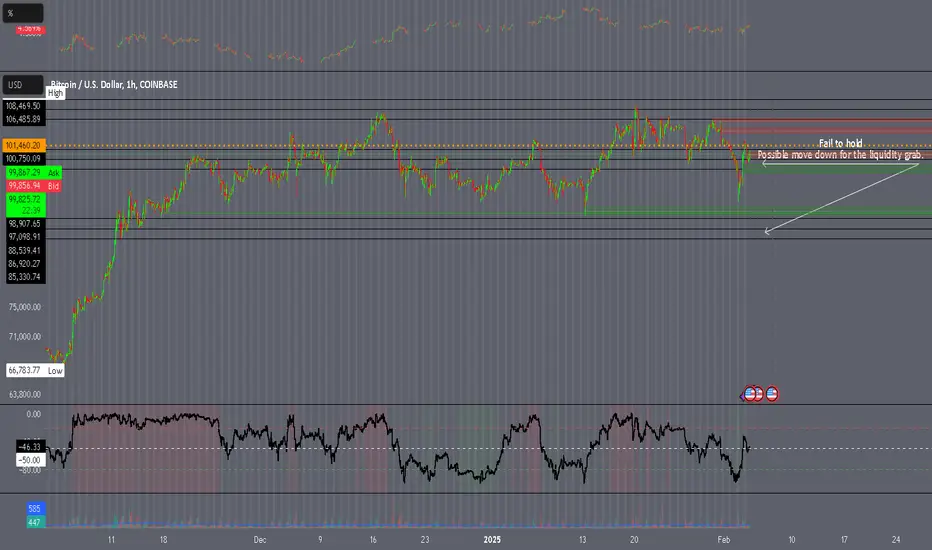
Expecting 90k in BTCAs per daily chart, I'm expecting BTC to hit 90k and face resistance.
If that resistance is broken, we may see one more move towards ATH.
Given global instability, it's not that hard to imagine BTC becoming safe heaven.
There have been signs recently that BTC is getting bought in large QTY. So keeping fingers crossed and holding longs.

$BTC/$USDT Small uptick then short before long up? ThoughtsI am not a pro trader so know that. I do trade and I make money. I also loose it to. But over all I am up.. still nothing to say I am better than anyone else other than I guess time spend researching myself most days and many days at length. Into finance and crypto laws tax and more.
This idea is purely speculation and I would love the speculation and or validation if you agree. I’m using a simple 1-2 level support and resistance signal/indicator. Thanks for looking! Hope it surveys you well! Stay trading! Book orders CHEAP and sell HIGH! Set the orders so you don’t miss bottoms and tops! You can do it just be PATIENT. They are who win. Trust in it! Study and be happy enjoy the ride! Good luck all.

tHE mAN sAID lIGHT iT uP BTCUSDBTC Big Pump The Sky is the limit
Light It Up
The Rise of Batman & Bitcoin: Icons of Their Worlds
Bitcoin: The Digital Knight of Finance
Bitcoin has risen from the depths of skepticism to become the dominant force in digital currency. Once dismissed as a niche experiment, it has now secured a place in mainstream finance, with institutions, governments, and major corporations embracing its potential. With a capped supply of 21 million coins and increasing global adoption, Bitcoin has positioned itself as a hedge against inflation and economic uncertainty.
Major milestones include:
Institutional Adoption: Companies like Tesla, MicroStrategy, and PayPal have integrated Bitcoin into their business models.
Regulatory Battles: Governments worldwide are crafting regulations, while some, like El Salvador, have adopted Bitcoin as legal tender.
Technological Innovations: The Lightning Network and Ordinals (Bitcoin NFTs) continue to expand BTC's functionality beyond just a store of value.
Despite volatility, Bitcoin remains the Dark Knight of decentralized finance, fighting against the forces of traditional banking and inflationary fiat currencies.
Batman: The Eternal Icon of Justice
Meanwhile, in Gotham (and Hollywood), Batman continues his legendary ascent as a pop culture juggernaut. From comic books to blockbuster films, the Caped Crusader’s relevance has never waned. With the DCU reboot on the horizon, anticipation is high for the next era of Batman storytelling.
Key moments in Batman’s rise:
The Batman (2022): Robert Pattinson's gritty take on the Dark Knight revived detective noir storytelling.
Upcoming DCU Plans: With James Gunn and Peter Safran leading DC Studios, a new Batman is set to emerge in The Brave and the Bold, bringing the Bat-Family to the big screen.
The Bat’s Enduring Legacy: From comics to animated series (Batman: Caped Crusader), Gotham’s protector remains an unstoppable force in entertainment.
Both Bitcoin and Batman embody resilience, innovation, and an unwavering ability to adapt. One fights crime in Gotham; the other fights financial centralization. Either way, both are here to stay, shaping the future in their own way. 🦇🔥🚀

Hold!Bulls! My fellow warriors of the market! I see fear in your eyes... I See hesitation... But I also see fire! The Bears think they own this battlefield! They think they can drive us back, force us to surrender, and take what is ours!
But I ask you - will you run? Will you let them push us down, and break our support and trample our dreams?!
HELL NO!
Then stand up! Hold the damn line! Push through that resistance! The Bears are clawing, but they are weak! You are stronger! Your are relentless!
You are BULLS!
So I ask you one last time - WHAT ARE YOU DOING LYING THERE?
GET UP!
PUSH FORWARD BREAK THEIR SPIRIT!
TAKE BACK THIS MARKET!
DO YOU WANT TO LIVE FOREVER!
Bollinger Bands — Enhanced Classic Tool for Technical AnalysisBollinger Bands — Enhanced Classic Tool for Technical Analysis
Bollinger Bands are a classic technical analysis tool designed to identify short-term trends and gauge market volatility. We’ve upgraded their functionality to make them even more intuitive and precise for trading decisions.
What’s New in Our Bollinger Bands:
Color-Coded Trend Identification
The band color automatically shifts with short-term trend reversals. This allows traders to quickly spot trend direction and decide when to enter trades.
Band Width
Reflects current volatility levels and price momentum. Narrow bands signal consolidation (accumulation/distribution), while wide bands indicate high volatility and potential trend initiation.
Dynamic Support & Resistance Levels
The outer bands, calculated as standard deviations from the moving average, act as dynamic reference points for entry and exit levels.
Gradient Zones
The bands are divided into four gradient zones, highlighting optimal areas for position sizing. Buy near the lower zones, sell near the upper zones—simple yet effective.
How to Use Bollinger Bands in Trading:
1. Identify Short-Term Trends
Bullish Trend: Green bands signal a bullish market.
Bearish Trend: Red bands indicate bearish sentiment.
2. Assess Volatility & Choose Strategies
Wide Bands: High volatility, strong trend initiation. Consider breakout strategies.
Medium Bands: Range-bound markets. Trade bounces from band boundaries.
Narrow Bands: Consolidation (accumulation/distribution), often preceding strong price impulses.
Pro Tip: A sharp band contraction often precedes explosive price movements.
Volatility Assessment Examples
High Volatility + Trend:
Wide band expansion signals a strong bullish trend (green bands).
Medium Volatility + Range:
Moderate band width and frequent color shifts suggest choppy markets—ideal for boundary bounce trades.
Low Volatility + Breakouts:
A narrow band breakout (green bands) confirms a strong bullish impulse.
Trading Bounces from Band Boundaries
Prices tend to revert to the moving average (midline). This makes Bollinger Bands a powerful tool for swing traders:
Lower Band (Support): Oversold zone—consider long positions.
Upper Band (Resistance): Overbought zone—consider short positions.
Bounce trades work best in sideways markets or unclear trends. Avoid bounce strategies during band expansion (new trend formation).
Example Trades
Short on Upper Band Rejection:
Price stalls at the upper band in a bearish macro trend, offering a high-probability short entry.
Long on Lower Band Rebound:
Price bounces from the lower band in a bullish macro trend, confirming a long opportunity.
Additional Confirmation Tips
Combine Bollinger Bounce signals with:
Midas Multi-Indicator: Whale activity detection, trend ribbon reversals.
Oscillator Overextension: RSI, Stochastic, or MACD divergence.
Price Momentum: Volume spikes or candlestick patterns.
Refine entries by aligning band signals with broader market context and multi-timeframe analysis.

XRP is flying. How much further?I published this chart a few weeks ago showing the potential for a gorgeous fratcal that's appearing for XRP. Do we dare to dream to see if reach three figures as we continue to soar? There's a few other alternatives that I'll also share some ideas around. But, this could be the best uptick we've seen from any coin... ever.. Good luck and follow and share for more.

STEPN - Looking great, don't let FOMO draw you inYes, this looks like a fantastic time to buy. But is it? No. Until the super simple chart with the trend line is breached decisively, there shall be no buy. If the trendline is not broken, then we're just set for more down and lower lows. Want to lose all your money? Plough it in based on FOMO. If you do not want you bank account to go to $0.00 then step back, zoom out and keep an eye on the signals to ensure you're not putting good money after bad. All the glitters is NOT gold. Follow for more.

USD/RUB to target 98 Daily chart, the currency pair has formed a chart pattern and the target is 98 extended to 100 - passing through resistance levels as shown.

USDJPY Will GO Up Long please check our technical outlook for USDJPY.
The market is on a crucial zone of demand 153.692.
The oversoldmarket condition in a combination with key structure gives us a reelatively strong bullish signal with goal 157.722 level.

Power law and the halvening theory In 2021, I was convinced that the power law model had been broken and wrote it off as invalidated.
But when I turned on the halvening date indicator, it marked the exact top of the last market cycle.
Coincidence? I THINK NOT!
Get on the gravy train now! Next stop $300k motherfucker!

BTC Friday set up the TGIF Today, I’ll be considering the possibility of a 70+% retrace to the upside using the TGIF (Thank God it’s Friday) setup. This usually kicks in by the London or NY-AM open if it’s going to happen.
If we don’t see more downside and traders decide to close out their short positions from the week, we could see an upside move. I’m watching for a market structure shift to the upside and confirmations like higher highs or significant moves around the London session at 3AM New York local time.
If we see displacement to the upside during the London session, that’s a strong indicator. If not, I’ll be looking for similar signs during the NY-AM session.
When this setup engages, it tends to be a high-probability trade.
What are your thoughts on this potential move?
#BTC #Bitcoin #CryptoMarket #TradingIdeas #MarketAnalysis #PriceAction #CryptoTalk #LondonSession #NYSession #TradeSmart #BTCTraders

MTL - BuyFrom the specified range, it is possible to return the price to a higher side, and it is a holding for a few days, and the purchase will be in two steps.
#MTL
#MTLUSDT

What Traders and Rock Climbers Have in Common!This post is inspired by @TradingView's rebranding in 2021 and the recent Leap competition.
At first glance, trading and rock climbing might seem worlds apart. One involves analyzing market trends, while the other requires physical strength and agility.
However, both pursuits share surprising similarities, highlighting unique skills and mindsets.
Here’s a look at what traders and rock climbers have in common.
⚙️ Risk Management: Both traders and rock climbers excel at managing risk. Traders use strategies like stop-loss orders and portfolio diversification to protect their capital.
Rock climbers assess risks, use safety equipment, and plan routes to avoid danger. Effective risk management is crucial in both fields to prevent catastrophic outcomes.
💡Mental Toughness: Traders face market fluctuations and must make quick decisions under pressure.
Rock climbers need to stay focused and composed while navigating challenging routes. Both activities demand mental resilience to overcome fear, maintain focus, and make calculated decisions.
📊 Strategic Planning: Success in trading and rock climbing involves strategic planning.
Traders develop strategies based on market analysis and economic indicators, while rock climbers meticulously plan their ascents, studying routes and assessing conditions. Strategic planning helps achieve goals efficiently in both areas.
⚖️ Adaptability: Adaptability is key for both traders and rock climbers. Market conditions can change rapidly, requiring traders to adjust their strategies.
Rock climbers face changing conditions like weather and rock quality, adapting their techniques to overcome obstacles and reach their objectives.
📜 Continuous Learning: Both traders and rock climbers are committed to continuous learning.
Traders stay updated on market trends and new tools, while rock climbers seek to improve their skills and stay informed about gear and safety practices. The pursuit of knowledge drives success in both fields.
🧘♂️ Focus on Execution: Execution is crucial in trading and rock climbing. Traders need precision, timing, and discipline to execute trades effectively.
Rock climbers must execute their moves with precision and confidence to progress safely. The ability to execute under pressure is essential for success in both activities.
🔄Passion and Commitment: Passion and commitment are integral to both trading and rock climbing.
Traders have a deep interest in financial markets, while rock climbers are driven by their love for the sport and adventure. This passion fuels their dedication, driving them to invest time and effort into their pursuits.
🧗♀️ Conclusion: Despite their apparent differences, trading and rock climbing share many commonalities.
Both require effective risk management, mental toughness, strategic planning, adaptability, continuous learning, focus on execution, and a deep-seated passion.
Recognizing these parallels can provide valuable insights and inspiration for those engaged in either pursuit, highlighting the universal qualities that drive success in diverse fields.
📚 Always follow your trading plan regarding entry, risk management, and trade management.
Good luck!
All Strategies Are Good; If Managed Properly!
~Richard Nasr

Today analysis xauusd Go up baby :)
GO UP? Go 2360?
in the long term, we are still waiting for further descent. but to go down we have to go up to at least 2365! we'll see :)

$JASMY forming concomitant flagsTwo distinct flags can be drawn here and market is just waiting the breakout!
Targets are indicated by pink arrows!

COTI - Zone UPHello. Today we are looking at COTI cryptocurrencies. Recently we saw a strong upward move, which was caused by fundamental information. At this point, we can see a clear corrective structure with a clear entry zone. The entry condition is the breakout of the low of wave A and low RSI on the H4-D1 intervals. We should look for a candle formation in the zone. The target for this trade will be a new top. This is a SPOT and leverage zone.

Digibyte has hit the first to 2 targets onto the next 2!Digibyte is finally awakening from hibernation. As ong as it maintains the teal neckline as support we will hit the dotted green measured move lines target and the dotted teal measured move line’s target in the very near future. *not financial dvice*


BTC to ##*%) ..... de code down we go get ready .... daily \ weekly pinting to mid 30 k btc hold ya hats

Bitcoin's temporary riseThis triangle is being formed. We expect it to be penetrated within a short period and then returned

Movr coin rising flagA bullish flag pattern has been formed. The currency’s targets are shown in the picture

UP - Lift-up soon?
All EMS claimed. If the price holds the 4.5 zone, likely pushes to 6, 10 and 14 soon.
Disclosure: No position yet.
