USDCADThe price of USDCAD have been growing since last week.
Affter this break at my zone and retested I can expect the price to grow for more 100 pips at least!
Up

#Bitcoin red or green?i think we will BART up to fill the gap on CME before heading down
however this also looks like a possible bear pennant LOL!!

⚠️⚠️⚠️ BITCOIN 🧭 Multi-Timeframe Outlook w/ 15m Support💬 Bitcoin still looks strong despite being rejected pretty hard at $12k. Let's take a look at some key levels for Bitcoin to see what's next for the king of crypto.
Hit that 👍 button to show support for the content!
Help the community grow by giving us a follow 🐣
-----
Support:
S1: The S/R flip here is a valid support level, and there is a lot of support below this level as well. However, the bulls will be much better off focusing on breaching resistance than they will retesting support to at best form a new range and at worst risk a breakdown.
Resistance:
R1: This orderblock range acted as resistance on the move up and it is our first point of resistance here as well. This is until we have broken above it with conviction, an S/R flip of this would be nice to prove that we have more buyers looking to accumulate.
R2: A move up past R1 to R2, with consolidation between R1 and R2, would also be ideal for the bulls. The market structure created by this as opposed to a retest of S1 is far more ideal.
R3: The orderblock range at the previous high is surely going to provide some resistance if and when Bitcoin makes it this far.
-----
Multi timeframe:
15m BTC Resistance:
S1: This orderblock range is where we are looking for support in the here-and-now. We have already put in some higher lows, what we expect is a move similar to the ABC on the chart which could include for example a retest of the lower range which leads to the previous high. This is the sort of price action that could lead us to a break of R1.
-----
Summary:
What the bulls need is to break past R1 and leave all those previous ranges behind to show they have what it takes to keep going. Good luck bulls!
✨ Drop a comment asking for an update, we do NEW setups every day! ✨


Looking Good ***IDEA***Microsoft Is looking to make a move this week, Its in the bottom of the regression trend and in its 204 - 202 support zone, looking to see the move to around 208, earning i believe will be good, i mean come on its microsoft... but looking good on the macd, Rsi is low and stoch rsi made the turn up. Lets see what happens. This is kind of a continuation of my idea from last week. *JUST A IDEA* Looking for move up to $220!!! Fingers Crossed!

Is it possible? *just a idea* $197???i know the RSI is low but we are still below o.oo on the macd hasnt quite made a turn up. I dont know, i have lost and made money, its a tough short but when do you really get in to the long postion? its a question we all have, but we will see, thats just the 1hr chart, make a judgement based on what you see, *just a idea*


Snap possible passHello. Here what I think about SNAP. Friend asked me if we should do something about this stock. It seems like it has upside down head and shoulders now. Which is a bullish reversal sign for long near term. You can see clearly the setup on chart and probably future upside path. 3rd path maybe greater. But for now, I would target $28-29 per share. We will see how much snap made during the quarterly report, I would assume a lot of people were snapping while on lock down. I might get into trade as well. If I would, I would get a month long option here. ( some correlation for quarterly report needed. If it pops, sell the option ). However, my friend buy and sell share, so less risk. Options require timely sell, shares requires time :)

#XTZ - waiting for breakrn price is in the middle of ascending triangle, waiting on either side to give in, either break resistance or break support


I see you This is a swing channel that I have been paying attention to ever since we began our long trek back up the covid climb.
I'm posting about it now due to the terrible time BTC is having at getting over the hump of that descending resistance right from 2019's bullrun high.
When this line breaks (tie goes to the bears, every time.) I think we will slide pretty quickly into this range.
Cheers

NZDUSD correction and upwithout a slight correction, and here it will not do. However, the goal is also a resistance line.
Traders, if you liked this idea or have your opinion on it, write in the comments. I will be glad👩💻

AUDUSD a little patienceThe price showed a good increase. And it seems that her goal is a line of resistance. However, there is a small level of 0.675 where the price may go down. But then she will come to the resistance line.
Traders, if you liked this idea or have your opinion on it, write in the comments. I will be glad👩💻

Long trade set up for BTCWaiting for retest off untested gained support.
Stop at 10117
take profit at 10205/10220
Trade Save!

#Banknifty - Relief soon Looking at the charts we are trading inside a descending triangle, after the dump, we had this could also be a continuation to lower levels but i see a relief rally coming soon in markets. a final pump before another major crash.
one more thing noting here is this possible H&S in the making, there is a low chance of this working out as we are at the BOTTOM not the top still unless we break the red resistance line this will be valid


GOLD push from the support lineInside a strong channel. We have a good support line. From it, the price will go up to the resistance line.
Traders, if you liked this idea or have your opinion on it, write in the comments. I will be glad👩💻

#ETH - Really Bullish! bounced at triangle support, good zone to accumulate, as expecting a drop in BTC, alts should perform well

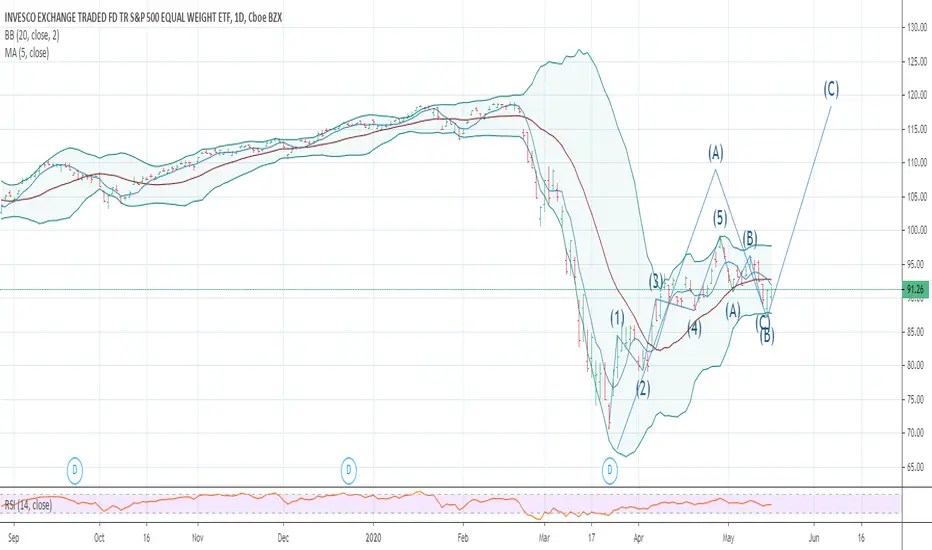
NEW UP LEG TO START THE CYCLE LOW DUE 3/21 AND 4/2 CAME IN RIGHT ON TIME THE NEXT CYCLE LOW WAS DUE 5/10 TO 5/23 I SEE IT ENDING NOW WE SHOULD NOW START ANOTHER 5 WAVES UP TO .618 TO 786 AND EVEN A SLIGHT NEW HIGH COULD BE SEEN FOR WAVE B WITHIN THE FORECAST DEC 23/2019 THAT THE EVERY LARGE SUPER CYCLE 4TH WAVE TRIANGLE WHICH WOULD END OCT 2021 AT THE LATEST AND IF EARLY WOULD BE OCT 10 TO JAN 10
#Bitcoin CypherBitcoin is forming a Bullish cypher pattern, i am currently long will look to short in 9700-9800 ranges

WORK / SLACK UP? or Down? im hoping its going up - I failed to make a trade after it falled today, but I really think the technicals look like a keeper, Id like to exchange ideas... I think this one has been and will continue to be slow, so maybe it will go up mid next week... Whats your thoughts

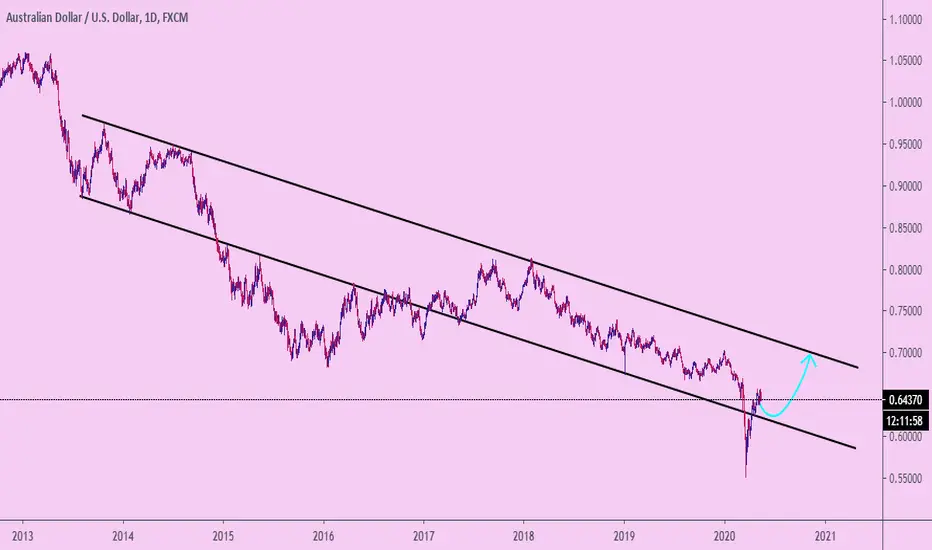
AUDUSD upWe see a good channel. And now the price is below this channel, I am waiting for its growth to the resistance line.
Traders, if you liked this idea or have your opinion on it, write in the comments. I will be glad👩💻
PULLBACK ENDING IN WAVE B LOOK FOR MUCH HIGHER TARGETS THE LOW INTO THE PANIC WAS A PERFECT.382 FROM THE LOW IN THE NYSE DEC 1974 WAVE 2 OF FIVE AND NOT WAVE 4 . I WILL POST DETAILS ABOVE 13000 BY JULY AUG
