Up

DOUBLE BOTTOM(GO ON DAILY TO GET A BETTER PERSPECTIVE) )Similar to NZDCHF (Makes for decent correlation) , in a case like this one pair will just work as a leading indicator where price will go , if you miss one there's another one, use it to your advantage i guess (doesn't mean you should have positions open on both , it just means double the risk not the money, you could but that's not the best idea)
evidently NZDJPY is the leading indicator here , and it in the horizontal neckline zone. and i an waiting for price to continue to the upside and might buy and T.P @ 70.594 end of this zone.

DOUBLE BOTTOM ON SUPPORT TRENDLINEminor res broken forming 2nd bottom on trend line
(GO DOWN TO 4HR TO ASSESS SITUATION AND FIND RIGHT ENTRY FOR YOURSELF)
P.A- 0.63000 for early entry ( this level is prone to getting triggered early af if price decides to be on some bs) could be a good outcome or bad , close to current price (good stops and lot size can save you )
P.A-0.63249 safe entry after res at 0.63182
(IT IS ALL SUBJECTIVE)


NASDAQ bulls aren't doneTrump will carry it up
3TP Levels
Manage your risk, we expect a slowly but steady move.

My prediction for BTCI think we will reach the bottom in a few hours and then we will go up very high.
Just my prediction. If you have some feedback or constructive critism, please let me know :)
Save trading guys ;)


Divergence play on GOLDSup gold diggers.
I believe from yesterdays price action we see a rally to a higher price of 1520 in the short term.
Could happen in the next couple of days...
Stay tuned
Keep risk managed!

$RETA ShortStock: $RETA (Reata Pharma)
Stock Price: $169.00
Position: Short
Type: Options (Buy Put)
Play: Swing
Risk: Very-High
Date: 11/15
Strike: $160
Limit: $17.20
Contracts: 1
Equity: $1,720
*Note: This short is expensive and will open up negative if you have to get filled higher than the market.
This is a 1 of 2 short position open.
This stock recently beat a Phase II study. Causing it to gap up AH. Currently up 70% in the last 24 hours.
There is a Phase 3 coming up which can cause another 30% to 50%+ run. So, yes this is a high-risk trade.
I expect this company to hit $170 by the end of the day.

long bitcoin & elliotwave Analysislong trend for bitcoin up
because 8200 or 7080 or 6250 are support.

BTC What about cue ball? let's go down...ororrWe are standing in the middle of a new channel, about which I wrote here t.me
We’ve been standing for 20 + days sideways.
Supports EMA99 at the same level. We are under average EMA8,21,50
We are going in a narrowing range, noted in red.

My prediction for the next few hoursLet´s see if my time management is better this time :P
Save trades guys !

From 1000 to 8 in 11 yearsSES Gasification Technology (SGT) produces synthesis gas.
+60% Synthesis Energy Systems, Inc. - after growing 193% on Friday. That all after announcing the purchase of Austalian Future Energy for $36 million.
SES also has offered to acquire Batchfire Resources, owner of the Callide Mine in Queensland, Australia, for ~US$80M.

11.10.2019 - Altcoin CapitalizationHi Traders!
Today we will look a bit unconventionally on the capitalization of altcoins. We know that many beginners also read these articles, so let's first say what capitalization of altcoins is? Altcoins are all coins except Bitcoin. Altcoin capitalization means how much money is allocated in all coins except Bitcoin. The difference between total capitalization and capitalization of altcoins is therefore only Bitcoin itself.
What does the graph look like?
A lot of people these days say that the altcoin season could come. What does it mean? This means that altcoins would grow faster than Bitcoin. The graph looks like this. We are currently in a channel with a target we have already achieved. However, this target is conservative. Whenever we reach the target, it is important to wait for the reaction.
Bullish scenario
The reaction came, but down. At the moment, it is absolutely essential that we do not break the channel downwards and keep the decline in the channel. If we can do that, further growth is possible.
Bearish scenario
This scenario is such that growth has indeed been completed and we will continue down. The previous forecast came out perfectly and there is nothing else left to do but wait for the market to offer.
From the point of view of altcoin trading, this is an absolutely crucial situation and a key graph to follow. We are more in favor of the bearish scenario, and we are also a little worried that a number of altcoins will still go to their new low. To confirm growth, we need to cross the channel upwards. Until we break it, we are more bearish.
May the crypto be with you!

BREAKOUT OF DESCENDING CHANNEL ????NEXT WEEK ???Price shot back into my descending channel , do you think it will break to the upside , i have been avoiding trading any pound pairs lately, however is this recovery long term or short term ?
i stick to what i see on the chart , maybe some fundamental analysis would say otherwise, it would be interesting to get a different perspective.

DOUBLE BOTTOM STILL ??earlier on during the day analysing this chart had pointed out that double bottom , few hours later that red candle followed , im curious as to that makes the DB invalid , considering its Thursday , pretty much the end of a trading week, could it be foreshadowing what we will see next week or expect , i personally do expect price to continue upwards eventually.
TRIPLE BOTTOM ???
INVERSE HEAD AND SHOULDERS??(IF YOU SEE WHAT I MIGHT MEAN)

CHFJPY Long IdeaFrom my analysis, I got this bad boy going up! Came down to around the bank candle which is highlighted in yellow to the left. bounced off of that support. Low risk trade if it doesn't play out!

Cradle Pattern ?inside bar or inverted hammer on weekly , double bottom on daily about to form(possible) ,4hr cradle pattern near resistance.
thoughts welcome


18.9.2019 - Litecoin (LTC / USD)Hi Traders!
Today we will finally look at LTC / USD. Why now? If you're watching the crypto market actively, you probably know what has been going on for the last 48 hours. The current situation is very favorable for altcoins . Bitcoin stands in place, dominance decreases and altcoins grow. It all started with EOS / USD last week, and in recent hours, ETH / USD, XRP / USD and ZEC / USD have also joined. However, the LTC is still silent and that is why we will analyze it today. The graph looks very simple. LTC / USD moves in channels and we have two options .
1. Bullish scenario
The LTC will break the channel up and follow its altcoin colleagues, as described above. This possibility is highly probable , since it would not make sense if all altcoins had a similar graph, they eventually grew and LTC did not.
2. Bearish scenario
I find this scenario less likely and it is a reflection back into the channel and the subsequent movement in it.
We must perceive the market as a whole and take into account all its signals. Each coin lives its own life, but we must not forget the global perspective. Large altcoins have very similar structures and the whole growth started last week by EOS. Only then began to add more coins. Will the LTC be different? We will see in next few hours.
May the crypto be with you!

TRX/USD bear trend might be in troubles!HELLO everybody
TRON losing his selling power
Smaller swings, a LOT of divergences (both from RSI14 and MACD 3-10) which makes me think the trend is about to correct.
It looks like we also broke the discending support (for the bears) and / or falling wedge formation (orange lines) with a decent burst of momentum, which could be identified as a Kick-off , namely the first signal of the beginning of a possible correction.
If so, we are now testing the orange trendline to then move higher.
We also have a pretty big resistance (dotted red horizontal line) and the 20MA is close for a 50MA cross.
SO, power is being lost, what do You think?
NOW: I really can't be sure of the entity of the correction. in this 7H chart I placed 3 blue rectangle boxes, which are the most important areas of resistance.
In my strategy, I will wait to see what price does and how the buyers will behave to decide where to consider the correction depleted.
I am not a professional Trader, these are only my opinions on TRX USD and I wanted to share this idea with You to gather feedbacks and maybe improve it togheter =)
let me know your thoughts on this

FRAN going upFor at least the next week or two, FRAN is a safe bet going forward. Wait for the dip, buy on the upswing.

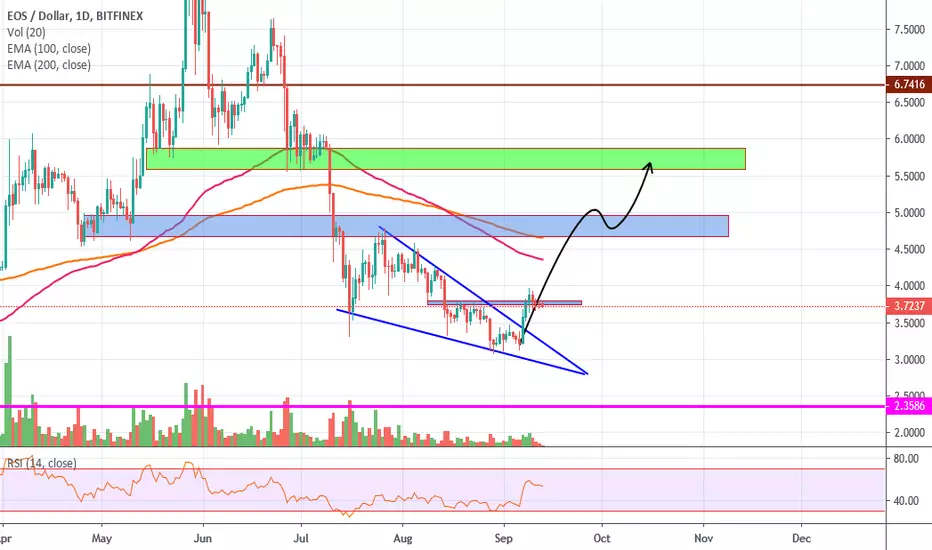
EOS time to go up !We should going up because on the chart is confirmed falling wedge pattern.The first we need cross up the blue s/r zone and then we will must bounced to green s/r zone, which can be TP. We must be carefuly when price will cross EMA 100,200 and blue s/r zone. At this zones price can slowdown or go down. Dont forget work with SL.