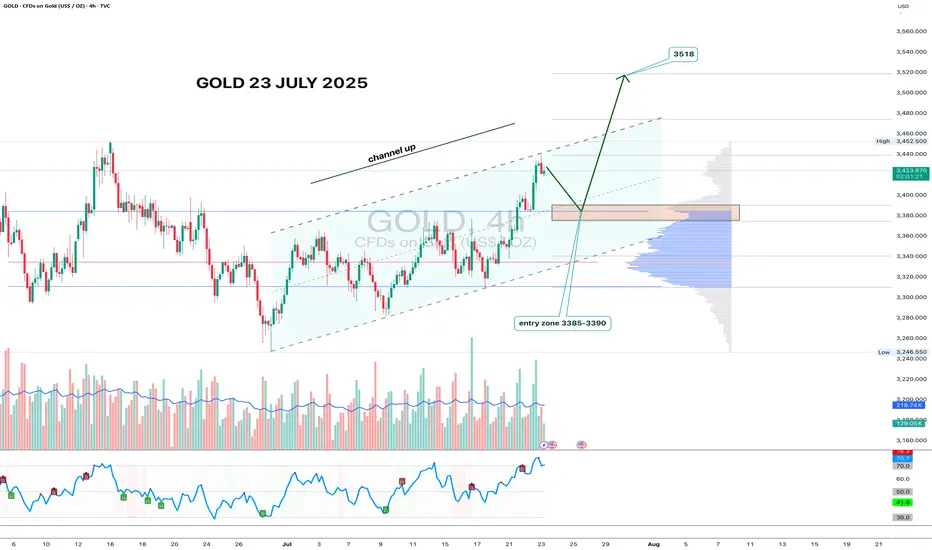
Gold 4H - channel breakout, looking for 3518 nextGold has formed a clean ascending channel on the 4H chart, broke out above resistance, and is now pulling back into the 3385–3390 zone. This area aligns with volume clusters - a perfect entry zone for bulls waiting on the sidelines.
If price holds this zone and prints a reversal candle with volume, the upside target remains at 3518 - the 1.618 Fibonacci extension and historical resistance. Volume increased during the breakout move, confirming interest. RSI still has room to go higher, supporting the bullish continuation.
Fundamentally, gold remains a safe-haven asset amid geopolitical tension, USD weakness, and potential Fed easing. Central bank accumulation further supports the bullish case.
Tactical setup:
— Entry zone: 3385–3390
— Trigger: candle confirmation + volume
— Target: 3518
— Invalidation: break below 3360 without buyer volume
If the plan plays out — gold might shine bright while bears squint in disbelief.
Update
Gold 22 July 2025 updateGood afternoon, update to last week's post of 21 July on gold, which worked yesterday, new zone to buy, the chart shows everything in detail, so today with the message "brevity is the sister of talent"
#GOLD
BUY LIMIT ZONE 3365-3370
🎯 TP1: 3385
🎯 TP2: 3400
🎯 TP3: 3412
🎯 TP3: 3428
⛔️ Stop loss: 3355
Regards, Totoshka™

btc/usdtI think it's time for Bitcoin to grow. It doesn't matter what the news is. This time, Bitcoin and Tether's dominance have reached their peak and are ready to make Bitcoin grow. This is my analysis. What do you think?

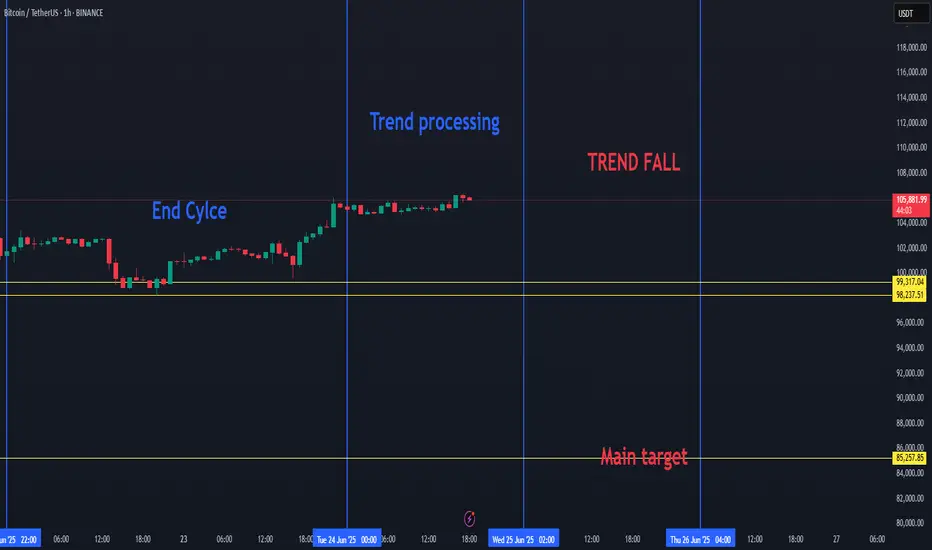
BTC HIGH DATA SHOW BREAKDOWN TO 85K FOR BITCOIN SOON.Bitcoin Market Update
BTC SEEMS TO ENTER A NEW CORRECTION PHASE SOON.
Recent data suggests that the current Bitcoin (BTC) cycle is coming to an end. As a result, we may soon see a downward move in BTC's price. The key target in this potential drop is around $85,000, with expectations that BTC will fall below $100,000.
This week, Bitcoin completed its cycle trend and is now entering a processing or transitional phase. Once this phase ends, we anticipate another decline in price.
This outlook is based on recurring patterns seen in previous BTC cycles, which have shown similar behavior in the past.
BTC can play on the low time frame with uptrends and downtrends, but if we will choice a side, then it will be the red trend.. since BTC cycle is ending.
WTI(oil)For oil, what I have in mind, considering the conditions we are in, if the Strait of Hormuz is not closed, we will remain at the same prices, that is, $75 to $80. But if the Strait is closed 100%, the price will go up to $130 and $150 in the short term.

BTC/USDTHello friends, I hope you are doing well. This analysis came to my mind for Bitcoin. On the 4-hour time frame, if Bitcoin crosses the areas I specified, it will move towards its targets. It could be bullish because gold and oil were bearish yesterday. What do you think, friend?

XRp/USDTFor Ripple, according to the chart, we are in a wide trading range, and according to the lines I drew, I am waiting for a reaction to them. I have a rule: if I don't understand a part of the chart, I won't enter. Tell me your opinion, be sure.

BTC/USDTWhenever Bitcoin goes above 106k, we can enter a long position at the target I specified on the chart. What do you think? Tell me.

BONK/USDTThis time, we reached a resistance area for this currency and I think this currency has the potential to be bullish. I have specified the target for you. Remember, this is an analysis, not an entry point. Tell me your opinion.

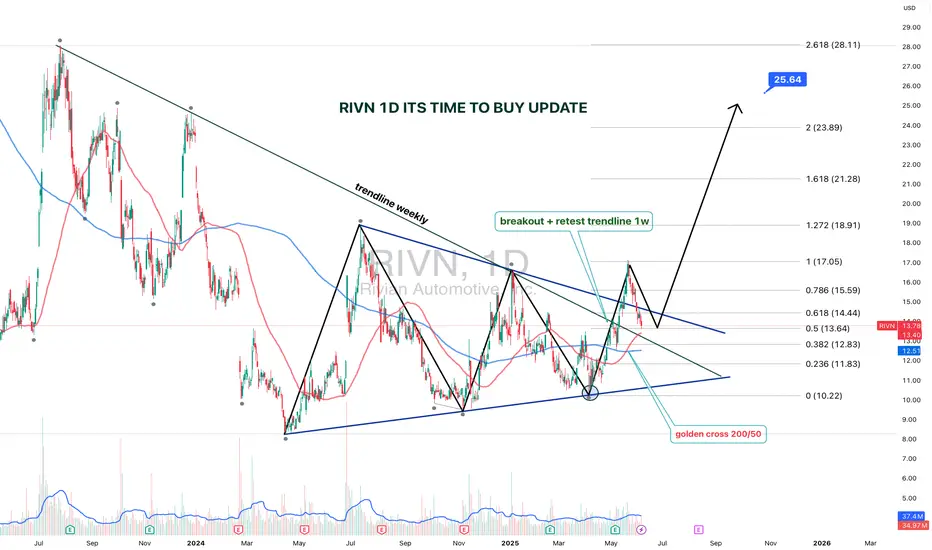
RIVN 1D — It’s Time to Buy: Setup UpdateThe setup on Rivian (RIVN) just got upgraded from “interesting” to “strategically significant.” We’re looking at a textbook symmetrical triangle that’s been developing since July 2023, with a clean breakout and retest on the weekly trendline.
The breakout was followed by a bullish retest, right at the intersection of the triangle base and the key trendline. Volume kicked in, price held — and that’s what smart money calls confirmation.
Now, the Golden Cross is live: the 50-day MA just crossed the 200-day MA from below. Price is confidently holding above both — momentum is shifting hard. Fibs from the bottom (10.22) to the last local top (17.05) project the first target at $17, and the extended Fibonacci confluence gives us $25.64 as a long-range goal (2.618 extension).
The weekly trendline — which acted as resistance for over a year — has flipped to support. Price action respects it, bulls are loading, and structure is clean.
This is not just a bounce. It’s a technical rotation from accumulation to expansion.
The time to talk about potential is over — price action has spoken.
BTC/USDTThe only re-entry I would consider as great in terms of risk reward is the region of 99-100k if market allows to visit. Orders are placed accordingly. In the meantime holding all positions since 77k re-entry.

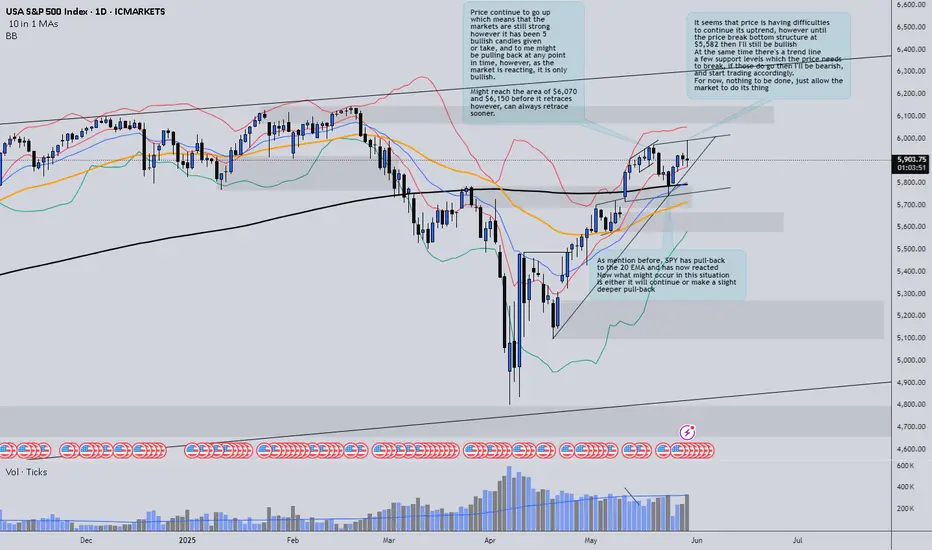
SPY update - still bullish!In today’s session, we saw an increase in volume without significant price movement. This could indicate underlying uncertainty or a potential shift in momentum.
At the moment, price is still respecting a key trend line and several support levels. Until these are broken, it's too early to confirm whether the broader market is turning bearish.
🧠 I also want to point out that the price is forming an ascending channel, often a reversal pattern, especially when occurring at market highs. While we’re seeing some bearish signs, it’s crucial to remain patient and let the market show its hand.
📊 As always, the key is to observe, not assume, and be ready to adapt as the price action develops.
Thanks for watching the update, I hope it brought some insight and value to your trading journey!
SILVER 1DA possible scenario for silver on the daily timeframe involves buying from the levels of 30.90-31.00 with further targets at 33.02, 34.8291 and the expected completion of the rounding pattern with a subsequent movement to the zone 40.0251
Everything is clearly depicted on the graph!
Have a good day!

BTCUSD update May 22nd, 2025I have returned and here is my updated chart. I'm such a perfectionist sometimes when it comes to lines that it takes my hours to get them exactly how I envision. To start off, yes I am bullish on Bitcoin and believe that this cycle hasn't ended yet but I will admit that I think the end of it is closer than the beginning. With that being said, I will not disappear when the bear market starts, I will simply make updates and try to catch the bottom like I did in the past. So far I am going with history and my bottom target is above 66,800 and I expect the floor to fizzle out around 71-73k; if it ends up being higher than that, great! Overall this idea is just an update for my own personal records and my prediction is based on what has happen that last time this pattern was brought to us.
Stay safe out there, happy trading, and as always--Cheers!

XAUUAD UPDATE 22-05-2025The chart you provided is a technical analysis for Gold (CFDs on Gold - US$/OZ) on a 1-hour timeframe. Here’s a breakdown of what it shows:
1. Price Action:
The current price is around $3,331.56.
The price has recently entered a resistance zone (highlighted in yellow-red near the top).
2. Resistance Zones:
Upper resistance: Around $3,389 (top yellow box).
Immediate resistance: Around $3,330–$3,340 (where price is currently reacting).
3. Support Zone:
Lower support: Around $3,142–$3,160 (bottom yellow box).
4. Bearish Outlook (as indicated by the blue arrow):
The chart suggests a potential rejection from the current resistance zone.
A projected drop toward the lower support area is illustrated.
There’s a red-shaded box likely representing a stop-loss zone, implying a short trade setup with entry near the current level.
5. Volume: There’s a moderate rise in volume recently, which could support the momentum shift.
Conclusion: The chart analysis suggests a short setup expecting gold to fall from the current resistance zone to the support zone around $3,140, assuming price fails to break above resistance.
Would you like a technical analysis or trading plan based on this idea?

USDJPY - Long Done, Soon Short!Hello TradingView Family / Fellow Traders. This is Richard, also known as theSignalyst.
📈As per our last USDJPY analysis, it rejected the orange support zone and has been trading higher.
What's next? As USDJPY approaches the upper blue trendline, we will be looking for shorts.
🏹 The highlighted red circle is a strong area to look for sell setups as it is the intersection of the upper blue trendline and green supply zone.
📚 As per my trading style:
As #USDJPY retests the red circle zone, I will be looking for bearish reversal setups (like a double top pattern, trendline break , and so on...)
Meanwhile, USDJPY would remain bullish medium-term and a bullish continuation towards the red circle is expected.
📚 Always follow your trading plan regarding entry, risk management, and trade management.
Good luck!
All Strategies Are Good; If Managed Properly!
~Rich
Disclosure: I am part of Trade Nation's Influencer program and receive a monthly fee for using their TradingView charts in my analysis.

BTC/USDTbtc is ready to enter acceleration phase.
expect high volatility in all coins. it's better to go for swing long or hold rather than using high leverage with tight stop losses

Bitcoin update 17th of mayhope you enjoy my analysis! Bitcoin has a sustainable Pa as for now and i'm expecting a big break out shortly!

GOLD (XAU/USD, 4H) updateOn the 4-hour chart, GOLD has broken below the lower boundary of a pennant pattern on increasing volume, signaling potential for continued downside. Despite this, the asset remains within the confines of a bullish megaphone structure, whose boundaries are still intact. The EMA indicators (20/50/100/200) are aligned in a bearish sequence, exerting downward pressure. The price is consolidating below the $3295 level and is approaching key demand zones.
Near-Term Downside Targets:
- $3177 — Intermediate demand zone
- $3063 — Major support level
Technical Highlights:
- Breakdown from bearish pennant confirmed by volume
- Price action continues within the bullish megaphone pattern
- EMA 20/50/100/200 positioned above price, indicating overhead resistance
- Volume increases observed during downward moves
- Key buyer interest zone: $3060–$3080
- Resistance zone: $3295–$3305
Following the breakdown from the consolidation pattern, gold is exhibiting a downward trajectory targeting support zones at $3177 and $3063. The bearish scenario is technically confirmed as long as the price remains below $3295. However, the movement within the bullish megaphone structure warrants close monitoring for potential shifts in momentum.

TURBOUSDT Showing Bullish Breakout
TURBOUSDT has successfully bounced from a strong support zone, marked by extended consolidation and accumulation in the highlighted pink range. This critical area acted as a base for bullish interest and now the price is showing a breakout pattern with a surge in both volume and momentum. This is typically a strong sign of renewed bullish sentiment among retail and institutional traders.
As seen in the chart, Turbo is currently trading around 0.0055 and could be setting up for a major move towards the projected price target of approximately 0.013. That’s a potential gain of over 130%, which makes this trade highly attractive for short to mid-term swing traders. The volume confirmation adds further strength to the breakout, suggesting that demand is increasing and sellers are drying up.
Technically, the market structure has shifted with higher highs and higher lows, signaling trend reversal from the downtrend seen earlier in the year. If price holds above the breakout zone, we could witness rapid movement to the upside. Investors are taking interest in this low-cap gem, especially with current sentiment favoring altcoin breakouts.
✅ Show your support by hitting the like button and
✅ Leaving a comment below! (What is You opinion about this Coin)
Your feedback and engagement keep me inspired to share more insightful market analysis with you!


atom sell midterm "🌟 Welcome to Golden Candle! 🌟
We're a team of 📈 passionate traders 📉 who love sharing our 🔍 technical analysis insights 🔎 with the TradingView community. 🌎
Our goal is to provide 💡 valuable perspectives 💡 on market trends and patterns, but 🚫 please note that our analyses are not intended as buy or sell recommendations. 🚫
Instead, they reflect our own 💭 personal attitudes and thoughts. 💭
Follow along and 📚 learn 📚 from our analyses! 📊💡"
