ETH/USD Where is it going to?Hello Friends,
I will update this chart with expected targets if there is enough interest from the community. If the community wants more details, please show your interest by hitting the like icon .
Looking at the daily chart we can see a rising wedge after a long down trend since the peek of the market. Has ETH hit bottom or is another bottom still in the cards?
All I can say at this point is the RSI has turned downward along with the MACD in tow. The RSI is showing a divergence yet there is a fractal signal giving indication to stick it out for now. The bollinger bands have turned inwards for a possible squeeze, forcing out whatever juice that remains of this trading pair. Despite the SMA golden cross and its SMA 100 predecessor, we haven't seen much action. The 50 is looking temporarily as support but the pattern will dictate the outcome as will sentiment in the market.
Looking at the weekly chart the RSI is neutral yet curling towards the bottom but the MACD is showing mixed signals and continues to climb. Volume has significantly decreased since November yet we are watching a decline in price. So which way is it going?
I have an answer but that will require an interest in the community.
Cheers!
Update

EUR/USD-->Update My Previous Chart Hello to all of you,
Because of the fluctuation on the markets, I thought that it will be useful to do another analysis for updating the latest on Eur/Usd .
After the good news and the decrease of bearish pressure, as we pass the resistance and stable at the first yellow line, we can search for the best entry like I said in the previous analysis.
Furthermore, I have drawn for you the demand and supply zones, specifically the demand zone is the area that Big Buyers are taking control of the market, in contrast the supply zone is the level that the Sellers short big amounts. Therefore, I expect the price to touch the second or the third yellow resistance horizontal lines and after that to decline with target the supply zone.
But remember, we have to see a confirmation signal from the price action in order to start putting entries and stop losses to this trading plan.
But the bias remain Short.
You can join if you like in my free telegram group, I am trading almost 2.5 years, you are more than welcome.
Thank You,

The most significant release since 2015 incoming!! v 1.4.0.Sia version 1.4.0 is the most significant release since Sia’s public launch in 2015.
source: blog.sia.tech
Expect it very soon. Do I need to say more?
Have a nice day.


EOSBTC - updated chartBlue triangle indicates the current range.
Green box is buy.
Red box is sell.
Blue line indicates major resistance.
I wasn't satisfied with the placement of one of the prior gann fans. This range seems more probable.
Target 1: 0.00011900

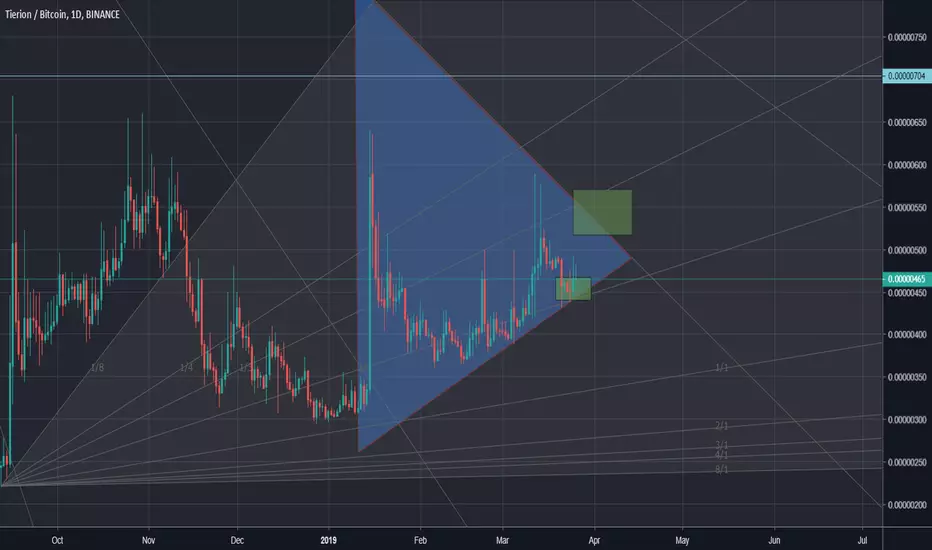
TNTBTC - potential breakout opportunity (updated chart)Blue triangle indicates the current range.
Green box is buy.
Red box is sell.
Blue line indicates major resistance.
TNTBTC has the potential to breakout towards the resistance line if a daily candle closes in the 550 area.
Target 1: 700
Target 2 (if the resistance line and the next fib line are broken (ie: daily close above 750)): 1050
[Update] 2019-03-05 GBPUSD Daily Trading
Open conditions:
1. EMA (20) < MA(72)
2. Pull back up to EMA (20)
3. Pull back more than 30pip today
4. London market opened
Stop loss:
5. 30pips
6. 2% risk
Take profit:
7. 1.3075, 95pips
8. The top of the last range
Notes:
1. London opened at 8:00 in GMT,
order opened at 9:05 in GMT,
too earlier, after 9:30 is better.
Updated at 2019-03-05 14:40
Set stop-loss to 1.3155

The Likely Retest of the Weekly 200 Grows CloserI've layered into my positions, the retest of the weekly 200 is on its way!


Advanced Volatility Theory Daily Bitcoin UpdateAs predicted, compression has ended today and a new upward trend is being defined on bitcoin. It's a clean chart with defined pivots, have fun trading it!


BITCOIN UPDATE: Back to 3.200?#CHANCEThis is an update for the following signal:
I WISH YOU GUYS A HAPPY NEW YEARS EVE! Enjoy the time with friends and family!
-----------------------------------------------------------------------------------------------------------
LEAVE A LIKE AND A COMMENT - I appreciate every support! =)
Peace and good trades
Irasor
Wanna see more? Don`t forget to follow me.
Any questions? PM me. :-)

Sustainable trending and Great profit Ratio's For BTC!As shown, the mass of price has created a sustainable trend above the empirically relevant pivot of the longest overexpanded distribution. If the band is reentered, short to the 370 moving average

Short Term Mean Reversion! Bullish Break for BTC?"Oversold" is a condition weighted by the volatility of the previous defined range. With a very tight trading range an oversold condition will appear significantly MORE oversold than as defined by a longer period. During this most recent drop, it's likely you've read dozens of Bitcoin predictions telling you to buy the dip, this is another one of those posts (but I hope with clearer logic as to why it's a good idea this time.)
When the bellcurve surrounding price action becomes too wide, it requires more force to continue expanding it. The more mass something has, the harder it is to push. Currently, the "mass" surrounding bitcoin is massive, though that doesn't mean much until a condition is met. It's when the bellcurve around price to starts to compress that you can make accurate predictions.
There are only two conditions in the market, trending and not trending. For the 4h chart's 200 period we are defined as "not trending." When an overexpanded bellcurve starts to compress price is driven to the center of the data. Currently for bitcoin that price target is 4,600. Withe the rolling up of the 20 period CCI, it provides solid entry into a solid condition. This trade has an excellent profit ratio.
Your target should be the 4h 200 MA.
Your stop loss should be a local low.
If you're interested in learning more about the concept of "mass" in the markets, check the links in the signature of this post. Trading is a high risk endeavor and you should always do your own research.

USDCAD: After BoC Interest Rate Good afternoon everyone,
we are looking at the USDCAD pair again after the BoC Interest Rate decision. They did not change anything so the news were not that good for the CAD and for our long term short trade, that we linked below. On the other hand the pattern is pretty much the same as before. The only difference is that there is another spike high and a better entry chance for now - divergence also held its form. Means we are still overall bearish on this pair.

Bitcoin: Last weeks action and coming weeks forecast (49)Weekly
The weekly chart is not the chart I trade, but it always important in terms of finding the right context. The charts shows me a number of things which make think that a bullish relief rally is due.
The first indication is the flatness of the trend line and the distance between trend line and price. Second is the overextension signal printed on the previous candle and the reversal signal (the green bar) on this candle. This weeks candle has not closed yet, so that reversal signal is not confirmed, but as long as it closes above 4096 we should be good. Third is the shape of the candle, which is not exactly there yet. There’s still a few hours to go, and ideally I would like to see the candle close at the highs. The least I’m looking for is for the top wick to be shorter than the bottom wick.
What I don’t like about this bounce is that it apparently is happening in the middle of nowhere (according to my TA). I would have expected price to move down at least to the 200MA at around 3200 and probably down to 3000. And I do see still see that as something that will happen, perhaps not in the coming weeks though.
Daily
On the daily chart I can see the first signs of a relief rally forming. I made a wrong trade this week based on the green reversal bar and subsequent hammer candle. It’s actually a nice trade to illustrate what went wrong, but most importantly why I went wrong. I’ll write an article on that in the coming week, and I’ll also discuss where the trade was that I should have taken.
Although I made a mistake when timing and executing that trade, the daily chart still tells me that the direction of the trade is valid. Trend line is flat and theres a good distance between trend line and price. We had a reversal bar and a reversal candle, and we broke the IBR from the reversal bar. Price made it into the trend cloud and is hanging in there. I can see it going up further from here, as long as we don't close beneath the bar that printed the re-entry signal.
The absolute safe thing to do here is not trade. If you’re trading this system, you should have either exited the short at the overextension signal follow by the hammers, or moved the stop to 4420. Then you can wait for price to reach the trend line and look for a re-entry signal into a short there (or if it breaks through we may get a long opportunity). The re-entry signal that printed two days ago can be ignored since it is at the bottom of the trend cloud. Safest re-entry signals are at or at least near to the trend line.
More adventurous traders can still take a swing at a long, although in my opinion the safest countertrend long has already passed (I’ll talk about that when I evaluate the boo-boo I made). I am taking a jab at a long, but recognising that I may be a bit late, and adjusting the risk (position size) accordingly. Sometimes you must indulge yourself and allow yourself to take a more risky trade. You need to offset that risk though in your position sizing..
You can find a link to the long setup on the 4HR chart below
4HR
Weekly forecast
The weekly and daily charts both tell me that we’ll most probably see either some ranging of some relief up to around 5000. If that happens I’ll get in long for a bit according to the 4HR setup and look for signs of weakness to exit around the trend line at 5000. I am bit bit late to this trade, but have to allow myself some fun, so I'll adjust my position size accordingly and allow myself only to take a minute risk.
If I get a clean re-entry signal short I’ll enter short there too, but that all depends on if, when, and how we get there. And what price does if it gets there.
If we don’t get any relief, and price starts breaking down, I’ll wait for a new setup to form. I can gladly miss the drop from 4000 to 3000. Trading is not about being in every single move an asset makes, it about trying to weasel yourself into the safe ones. I made a good profit on the last short, if I miss this one there;s no harm done.
If you enjoy these setups and analysis please like and subscribe. It’s the easiest way to support my work and get spread this content further :)
If you want to tryout the indicator and strategy, follow me and drop a comment or pm and I’ll get you set up.
Stay calm, and happy trading!
More information on the indicator can be found below:

GOLD: And Here Is Another Update & Why We Secured ProfitHey guys here is another trade update.
We are looking at XAUUSD from previous idea, but on a lower time frame and right before FOMC statement. So be careful out there anyway. In the comment section on the last Gold idea i said that we closed our profit with +180 pips, but there is much more potential on the long side - BUT not now. I think Gold might retouch last lows on the daily and here is the short term outlook on the 1h chart. You can see a bearish cycle between larger structure consolidation. Our entry was pretty much at the bottom of this. To risky to let it run there again. So lets be patient and wait for another move down and then enter our long again.

BTC $6,000 Officially Broken!Welcome, with this bitcoin update , as you all know bitcoin is flanking. But now the question is what will happen to bitcoin? And looking at history? Of course I have already indicated it, we were in a D-triangle and 70% of the time it breaks down to the trend of below. There was a lot of support around the $ 6,000 / $ 5,900 , but finally 70% of the time a D-triangle breaks to the side where the market is going and thus down. So, of course, this was not such a big surprise.
What does bitcoin do at present?
At the moment bitcoin is at $ 5,500, well all we have a restistence level at $ 5,550 that has to go through, which is currently being rejected. And that is still a problem, you would think well are there not enough buyers for bitcoin? Or do they want that bitcoin even lower? think of levels $ 4,900 / $ 4,800 . personally, I expect that we will look for that channel.
Follow us for more daily updates of the market.
Telegram : t.me
Happy trading!


Litecoin (LTC) Core 0.17 will make it x10 cheaperFollowing our previous idea on Litecoin, where Blockstream announced about the LTC potentially joining the Liquid network, now there are even more good news.
Litecoin client release is on its’ way, which was announced on the official Medium blog page of the Litecoin Foundation. LTC Core 0.17 will introduce a faster and cheaper Litecoin, with a very low transaction costs, which can be compared of that in 2015.
Below is the quote of the official announcement:
"The average transaction fee as it stands on the network is L0.001 per KB or ~$0.05. With the announced changes that will soon become L0.0001 per KB or ~ $0.005, half a cent and back at 2015 levels."
This is huge for the Litecoin, because transaction costs will be literally reduced by x10. It’s actually almost inline with the recent Monero announcement, where they recently reduced the transaction cost by 97%.
The reaction to the news announcement was taken very positively by the market. You may ask how come?; LTC hasn’t gained much, in fact, its moving very slowly!
But let’s take a closer look at the price development. According to our previous idea on LTC/BTC, Litecoin has reached the support level at 427.2% Fibonacci retracement level, rejected it and started to move north. By looking at the chart, it is clear that LTC/BTC has produced a double bottom near the etc 0.007 area. After the price bounce, it reached the and broke move the 23.6% fibonacci resistance, which currently acting as the support. The RSI oscillator trigged a buy signal while breaking above the downtrend trendline.
So far price action is being very positive, while showing the potential for more growth. As long as Litecoin remains above the 0.00795 support, bullish momentum should be increasing. At some point price will reach the 0.008 resistance area, and if broken, next stop will be near btc 0.009. But in any case, investors will be paying attention to the etc 0.0076 support, where double bottom has been formed. If support will be taken out, LTC can drop down to 0.0073 area.
Nevertheless, the timing for buying LTC could be just about right for some investors. And combined with a relatively cheap price, large buyers might start getting involved in LTC trading. As the downtrend is dominated, the risk will remain very high, although the rewards could be much higher. Please do not consider this article as a call to buy LTC, but look at it as a map, which may help you to trade Litecoin more effectively.

Time for an updateWell, it's been a looooooong and boring time since I last posted here about BTSBTC, and I guess we are finally at a meaningful point. Looking at the chart, it's not a question of wether or not the fib channel is valid or not, because it obviously is. The million dollar question is: will we stay inside the fib channel or not.
If we stay inside the channel, we might very well look up the center line again which would mean a pretty steep drop. I know a lot of people think the only way is up at the moment, but I'm not so sure. We had something that looked like a 3-wave up over the last 2 days, but volume is so low it's almost non-existent, so I would hardly call that impulsive.
In the meantime king Bitcoin is also low on volume and moving ever more sideways. Don't fall into the trap of thinking there are only 2 options, a huge burst up or down. There is also the option of remaining boringly sideways for a lot longer. Guess what that would do the alts market? Alt season or a slow withering away of interest?
