Upstart ~ $UPSTUpst might be able to find some support here near 244, if it doesn't this would be a huge break to the downside and I'd enable to open puts in this name... AFRM looks like it's on thin lining as well.
UPST

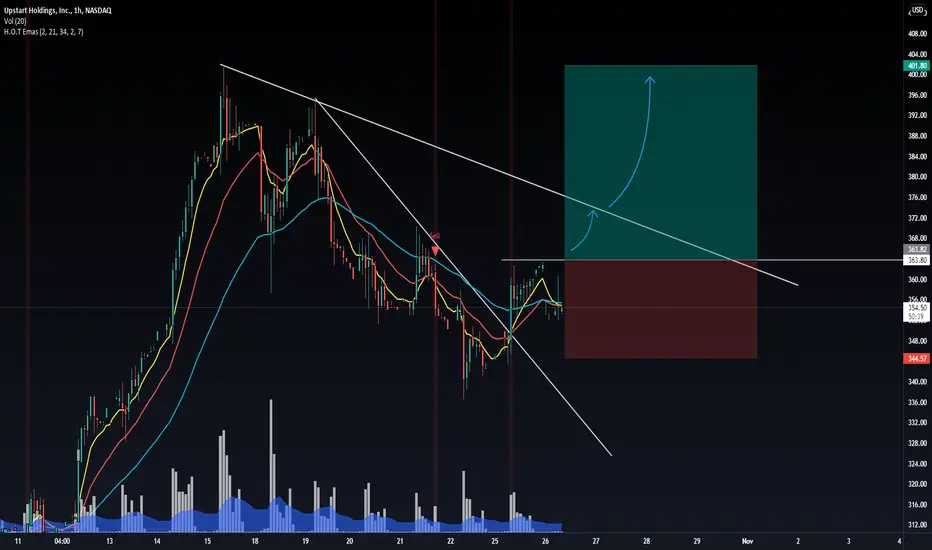
UPST retracement - Publishing my own idea, come to own conclusions.
Fibonnacci says it's retraced and MACD and RSI are near bottom. CCI is at a low and doubt going lower. CCI with other indicators are best to buy at bottom or crossing 0.
UPST earnings a year ago was positive and now $0.60 for QTR, reported revenue is up 3x from a year ago and only double from $125.
Good entry point to not worry about, but fun enough to watch. Too many panic around earnings looking at all the red and green spikes.

ROKU - STRONG CONFLUENCE SUPPORT & AVG $30+ BOUNCE OFF TREND All,
OVERALL (BULLISH 70/30)
I think we break out this wedge down here either now or one more attempt on bottom of wedge and hit 280-293. However, see details below. I am most likely going to hedge downside depending how Mon/Tues go. A breakout Mon-Tues I will just go into maintenance mode and watch it closely.
FUNDAMENTALS
Let's get to fundamnetals first. There are some "doubters" on ROKU. However, they may be right in the future as of NOW in the past quarter financialls and NOW as a company ROKU is very undervalued here reardless of future ROKU beliefs. If you want to be short next quarter for reasons "XYZ" totally get that. Arguing against ROKU after 600% EPS and customers Y/Y drastically increasing it's very obvious ROKU is worth 375+ at a "fair" valuation.
TECHNICAL ANALYSIS
There is a very stong support trend line here that is holding on average acting as support we have $30-$50 moves off of it regardles of what comes after.
MY POSITION(S)
$300 Calls Dec 3rd 2021 @ $3.65
(Will add pending non breakout by Tues) -- Either $265 or $255 PUTS for Dec 3rd 2021 (May want to add some regardless just as protection or even shorter timeframe)
**Remember on options you can close/sell at any time there is a good chance if I get that 293 clean and soon I might just sell there and take a pretty solid profit. Or sell half and see if we can break the downward trend to push 315-330 area.**
BULLISH
PT #1: 285
PT #2: 293
PT #3: 304
PT #4: 330/342 --- "wait and see if we can break downward trend will be 3rdish time so 50/50 it breaks barring any bad/good news. Also approaching Christmas/Black Friday time.
BEARISH
I think the bearish comes from the obvious part of it not being able to re obtain that 376ish level. We are currently above that other previous low of 372. A break under that signls a possible big downside of 240s. The other factor is the overall market/SPY/Holidays/Feds
PT# 1: 267
PT# 2: 255
PT #3: 244
PT #4: 220 (if we somehow got down 220-240 range I will immediately swap to 100% calls and a huge buy in as the stock would be at such a mind blowing discount.

COST - CostCo - PARABOLIC CURVE COMING TO AN END?Interesting to hear peoples thoughts on this. If you know what I am talking about it will become obvious that this arc might/could end soon. Hard to say with stocks like costco because of their obvious growth nature. In fact, might be more positive during these financial times using costco for bulk/saving money vs others. In general some studies show that parabolic arcs typically retrace 62%.
Of course CostCo is a great/money saving company. However, what goes up must come down. The best stocks/ BTC all do at some point. Any news or bad PR I could see COST getting demolished due to the parabolic nature on the monthly cart.
Let me know your thoughts.

GNW - THE MOST UNDERVALUED COMPANY IN THE MARKET? MIND BOGGLING All,
Lets get down to the financials on this one. Outside the fact this is absolutely going to break here with this bullish ascending tri. I mean take a look at P/B at 0.14... Price to Free Cash Flow ... 2?!?! I mean forward P/E is 4.98?
THEY HAVE 1BILL REV AND NET MARGINS LOL @$4. SOME COMAPNIES WITH WORSE FINANCIALS THEN THIS TRADE AT $15-$55 ON HIGH END.
Summaries
-EPS has not only grown over 5 years but even gotten better exponentially now.
-Price to free cash flow is essentially what Buffett looks for I mean holy hell not to mention P/B puts this as 1/10th undervalued (even though PB is an older valuation usage still)
Highlights
-P/S 0.25
-P/B 0.14
-P/FCF 2.06
-EPS past 5Y 40.10%
-EPS Q/Q 651.30%
These financials are real.. and disturbing this somehow is trading at $4
Negatives (about one)
-Float 500M (hard to move but does have options)
Positives
Market Cap 2.13B
Income 1.02B
Sales 8.36B
Book/sh 29.91
Cash/sh 4.47
P/E 2.19
Forward P/E 4.98
PEG 0.44
P/S 0.25
P/B 0.14
P/C 0.96
P/FCF 2.06
EPS
EPS next 5Y 5.00%
EPS past 5Y 40.10%
Sales past 5Y 0.20%
Sales Q/Q 1.90%
EPS Q/Q 651.30%


Buy UPST 8/11/2021You can buy UPST target 401.3 stop loss 299
Money management your responsibility.
I recommend entering a maximum of 10% of the portfolio.
Good luck

Bullish and Bearish case for UPSTUPST, forming a pennant. If it can reverse here then we can see $364. UPST is known to move fast. They report earnings on Tuesday. A bearish case for UPST. Head and shoulders formed on the daily chart. Their earnings can move this stock either way so I would wait if you were to play this.

UPST - log scale tracking countThis is just to keep track of the movement. Its so i dont forget what i was thinking in a few weeks
Looks like we might see a last push to 450 before dropping back down.

UPST-- Time to go shortUPST-- bearish territory started. Might go down in waves. But the descend is on. The wild ride or more than 1000% gains since the beginning of the year are about to end.
There will be a profit-taking cycle happening.
Few data points,
1) 9 EMA crossing below 23 EMA
2) Price is not able to break above the trendline from recent highs. Forming lower lows on daily
3) Price is not able to break above 9EMA recently on 4hr and daily
4) 333 is acting as resistance from the left shoulder of the H&S pattern.... and in the distribution phase, as per stock cycles
If you follow this chart, it is matching to the textbook representation of stock cycles. Will it go down before ER or after?
Note: ER is on Nov 9th. It is time to watch this one. What do you guys think?

UPST possible pullback, regression channelHello everyone! UPST is now in the resistance zone of this regression channel in the daily chart. I think we can experience a pullback to the $340 in the upcoming weeks. Remember that the trend is your friend, that's why I'll not short UPST for now. NASDAQ:UPST
Not a financial advisor. Just my personal opinion. Enjoy your weekend.

UPST Projections.These aren't accurate to time but to patterns visible on the monthly and weekly time frames.
UPST is following the Elliot Wave cycle and so far, Wave 3 is in the extension zone. I project a completion of the extension into earnings and a retracement for wave 4 anytime after that. Once that retracement is done, wave 5 will push us even higher. My current timeline is between now and 08/2022 for the cycle to complete.
Always do your own DD and pls add any corrections or comments to this thought.

My Trading Mantra: "Follow the Money "I believe one of the best indicators to watch is Volume Price..!
You should try to invest where money flows in..!
In trading and investing your mantra should always be: Follow the money..!
I believe stock prices only go up when there are fresh players who bring money to the play, regardless of the quality of the underlying asset!
One of the most important duties you have as a trader or investor is to monitor the money flow in the market to find out emerging opportunities!
I have picked 3 Stocks with a +100% gain since August, let's review them
My best-performing picks since August:
-1 UPST: +150% gain since August 2nd when I published my analysis at 131.65
2- AFRM: +125% gain since August 2nd when I published my analysis at 64.71
3- DATS: +100% gain since October 6 when I published analysis at 8.16
For complementary information, you can watch my youtube video about volume and Volume Price:
youtu.be

AFRMScalping lvls here for AFRM .. if market sentiment was bullish I would believe this would breakout to upside but am skeptical with how market is digesting currently. Therefore here's both sides to this hot name.
Break above 115 - > 119
Break below 106 - > 100 - > 96

UPST long ideaA few different patterns are forming to the upside.
I like the $327 as a pivot to the upside,
It has been holding well despite of market weakness.
Keeping this on the WL

$UPST - Is this just the start?!?!This is a hyper bullish count, but considering what this name has done recently and the massive increase in guidance from management, this is far from impossible.
1) Either we have completed a primary 5 wave structure, giving us wave 1 of the cycle around 300 (in yellow) and will now begin a cycle wave 2 that could take us to between 84-135, before a wave 3 takes us to a mind boggling value of 550-600 (white dotted line)....I don't wanna get ahead of myself, but a full completion of this count takes us to 800+, and more likely closer to $900+. This hyper bullish scenario could play out if Upstart is truly the disruptor it claims to be.
OR
2) We are in a triple nest which is currently playing out with cycle wave 3 (yellow count, but 3/4/5 are not complete yet), a primary wave 3 (red count, w3 not complete yet, targeting ~400) and an intermediate wave 3 (pink count) which just reached its 161.8% target of ~290. From here we could see a retrace for primary W4 to around 235-210, before we reverse for a intermediate wave 5 and head back to ~400 to reach the primary W3 target (red count). The interesting thing about this is, when you take the red count to its final wave 5 target, you end up at 560-600! this is the same range as W3 target of scenario 1.
Regardless of how you count is, you end up at 400, then 600 then 900. The key is, do we hold 235-210, confirming that we are in the triple nest, OR do we fall below 200 and back down to 135-84, confirming that we have just completed cycle wave 1 at 300.
Basically, this is looking like a massive opportunity with buy zones at 235-210 and 135-84. Give this name a couple of years and see where we end up!
BTFD

$UPST - Can UPST Continue this huge bull run?$UPST is very overbought on RSI, I would actually expect it to come down in the short term or trade sideways for a while, but this is definitely a long-term hold for me.
#Investing
#Trading
#Stocks

UPST - LONGalmost a 62% retrace here in Wave 4 so starting a position here for what is expected to be a wave 5 towards 270-278ish. Will follow the white curve on this one for Stop loss. Looking for 6-12 month out 130/140 Calls.

Win Big and Lose Small storyAugust 2021, was one of the best months for me.
While Major indexes (NASDAQ, S&P 500, Dow Jones, Russell 2000) gained between 1.5-4 %, I had 8 analyses with a 10-73% gain in one month, those which hit stop loss made 1- 4% loss..!
I also trade BABA option twice and close them with +180 and 100% profits..! and had 2 unsuccessfull trade with -30% loss
(use 3% of my capital for each trade)
I publish this review to talk about one of the most important habits(strategies) in trading.
Novice Trader Story:
Season 1: In the middle of a bullish market, FOMO: Fear of Missing Out
Episode 1: Before Trading Journey Started
Many people and friends share their experience of making profits trading cryptos and stocks on their social media, why should not I give it a try???
Episode 2: Trading Journey Started
Opening the trading account, installing the app, transferring the money, and the gate of a multi-trillion dollars world are open now!
Episode 3: Pushing the first buy button
Welcome to the journey of trading, a journey full of adrenaline for novice traders!
Episode 4: Making the first profit
It feels like I am the wolf of wall street!
Those who entered the market after March 20, 2020, think making money in the market is the easiest thing in the world.
From a statistical point of view, it is very unlikely to made loss between March 2020 and February 2021.
Episode 5: Market become less inefficient
In a trended market (inefficient market) most tickers are positive on most of the trading days..! so making money is more probable than loosing it even for novice traders!
Problems start when corrections start, novice traders start changing their positions to find the bullish tickers that gave them the same good feeling.
They do not know market behaves in cyclical patterns and they experience multiple corrections by chasing for the best bullish movees.
Episode 6: Fear of Loss
after a couple of bad experiences, they decide to cash out the profits as soon as they see any, no matter how little it is..!
Episode 7: Vicious Cycle
Novice traders now experience the killing phenomenon of losing big in the hope of making reversals and wining small in fear of losing their small profits.
Episode 8: blowing up the trading account
There is not much left to lose!
After the trading account becomes smaller and smaller, it is time to go all-in. Usually, it does not work..!
Episode 9: what should I do now
Novice trader is now addicted to trading and can not stop trading, so decides to recharge the account..!
Episode 10: start over
Novice Trader 1: Keep doing the same thing over and over again, the same result over and over again (majority)
Novice Trader 2: Start learning about the market (reading books, courses) and keep trading, better results but making lots of mistakes because of not having a fully defined strategy.
Novice Trader 3: Stop trading and back to normal life, an insightful decision for many people if they make it..!
Novice Trader 4: Stop trading, start learning, and promise themselves not to start trading unless they have a fully defined strategy with good backtesting results. (less than 5% of all people)
Nash Equilibrium:
What Is Nash Equilibrium?
Nash equilibrium is a concept within game theory where the optimal outcome of a game is where there is no incentive to deviate from the initial strategy. More specifically, the Nash equilibrium is a concept of game theory where the optimal outcome of a game is one where no player has an incentive to deviate from their chosen strategy after considering an opponent's choice.
Overall, an individual can receive no incremental benefit from changing actions, assuming other players remain constant in their strategies. A game may have multiple Nash equilibria or none at all.(Investopedia)
What Is a Zero-Sum Game?
Zero-sum is a situation in game theory in which one person’s gain is equivalent to another’s loss, so the net change in wealth or benefit is zero. A zero-sum game may have as few as two players or as many as millions of participants. In financial markets, options and futures are examples of zero-sum games, excluding transaction costs. For every person who gains on a contract, there is a counter-party who loses.(Investopedia)
Conclusion :
Traders can make decisions and hurt themselves if they deviate from their main strategy based on Nash Equilibrium.
Most Important Question any trader should ask her/himself:
What is my strategy to make money in the market?
How I can make it better???
Refrence:
1- UPST:
2- AFRM;
3-ROOT:
4- PLTR:
5-AMC:
6- COIN:
7- GME:
8- BABA:
9- SPRT:

UPST: Pullback in progress (ON AN UPTREND)UPST: pullback in progress
~Ever since it opened in feb at 44 bucks, it has been growing fast and is at 270 rn
~The uptrend we are in now is in the midst of a pullback and is a good replica of the one on Aug 18-20
^^Support zone 1 at 260-263: should bounce here to around 276 resistance before going back down to a PT: 255
~I would play puts in parts
Part 1 with a PT: 262.50
Part 2 entry at the bounce to 276 with a PT of 255
~After we confirm a bounce off 255 support, swing long 3 weeks out

It's Time. Round 2 baby.UPST took my beer money but it's time for the redemption arc. Retest of $200 coming very soon and it will sky drop past every resistance level into oblivion. Weak momentum and True Bearish Divergence spotted. Overvalued? More like Overflowing Beer Money. Let's get this bread by shorting this bread

Small Correction possible at $UPSTI think UPST will go up in long term, but in short term i am expecting a correction as it is currently at resistance levels. So i think selling now and buying at lower levels (around 200) can be a great idea.
